

Machinery · Repair and service guide
Farm Equipment Repair and Maintenance Market Guide
Research firms value the farm machinery maintenance and repair market at about US$33-40 billion a year worldwide. USDA data show US farms spent $24.0 billion on supplies and repairs in 2024. Here is what drives that spending and how to cut downtime.
Key takeaways
- No public source sizes fertilizer equipment repair on its own; the wider machinery maintenance market is put at US$33-40 billion a year by three research firms.
- US farms spent $24.0 billion on farm supplies and repairs in 2024, 5.0% of total production expenses, up from $19.4 billion in 2020 (USDA NASS).
- Average spending on this line ranged from $1,482 per farm for the smallest sales class to $351,908 for farms selling $5 million or more (USDA NASS, 2024).
- Under a July 2026 FTC settlement, Deere must give farmers and independent shops the same repair tools and software as its dealers for 10 years.
- A simple seasonal checklist and good repair records are the cheapest way to cut downtime.
In this article
- Farm equipment repair and maintenance services market size
- What US farms spend on supplies and repairs
- Why agricultural repair and service matters
- Common agricultural equipment repairs and solutions
- Common equipment issues and service solutions
- Mobile repair: fixing machines in the field
- Preventive maintenance for farm equipment
- A seasonal maintenance checklist
- Repair, replace or hire?
- Technology in equipment repair and maintenance
- Training and certification for technicians
- Right to repair: the Deere settlement and what it means
- Choosing a reliable agricultural equipment service provider
- Repair costs outside the US
The agricultural fertilizer equipment repair and maintenance market has no separate official size. It sits inside a wider farm machinery service market that research firms value at about US$33 billion to US$40 billion a year worldwide. The firmest number comes from USDA: US farms spent $24.0 billion on farm supplies and repairs in 2024, 5.0% of all production costs. This guide sets out what those numbers mean, which repairs come up most, how to cut downtime, and what the July 2026 right-to-repair settlement changes for farmers.
It covers tractors, combines, planters, sprayers, spreaders and pumps. It also gives you a calculator to compare the cost of one breakdown with the cost of a service plan. If you are thinking about older machines, our guide to used harvesting equipment covers buying checks.
Farm equipment repair and maintenance services market size
Three research firms publish estimates for this market. They draw the edges of the market in different ways, so their numbers do not match. Treat them as a range, not one answer.
Global Market Insights valued agricultural machinery maintenance services at US$39.7 billion in 2024 and expects US$93.4 billion by 2034, growth of 9.1% a year (Global Market Insights, via GII Research). Market.us puts the same market at US$38.8 billion in 2024, reaching US$98.8 billion by 2034 at 9.8% a year (Market.us). WiseGuyReports measures the agricultural equipment repair service market, which it splits into routine maintenance, emergency repair, parts replacement and tuning. It valued it at US$33 billion in 2025 and expects slower growth of 3.2% a year, to US$45 billion by 2035 (WiseGuyReports).
All three are paid reports. Their full methods sit behind a paywall, so readers cannot check how they were built. The gap in growth rates (3.2% against 9-10%) cannot be explained from the public summaries; the firms define and measure the market differently, and their methods are not published.
What about fertilizer, harvester, livestock and vineyard equipment?
Search engines show many “market” pages for narrow segments: fertilizer equipment, harvesting equipment, tractors, livestock and poultry equipment, vineyard equipment, crawler tractors, crop processing and canning lines. No public, checkable source gives separate sizes for these. Figures quoted for them online come from paid reports whose methods cannot be seen.
What can be said is practical. Fertilizer spreaders and sprayers handle corrosive products, so they need washing, rust checks and calibration after each season. Harvesters carry the highest repair bills per job. Livestock, poultry and vineyard equipment depend on small specialist dealers, which makes parts access and travel time the main costs. Each group is covered in the repair table below.
Chart
Three estimates of the global market
US$ billion, latest base year each firm reports
What US farms spend on supplies and repairs
For an official number, USDA’s National Agricultural Statistics Service (NASS) surveys farm costs each year. In the USDA NASS Farm Production Expenditures 2024 Summary, published July 2025, farm supplies and repairs came to $24.0 billion in 2024. That is 5.0% of the $477.6 billion US farms spent in total.
Chart
US farm spending on supplies and repairs
US$ billion per year, all US farms
Two points matter when you read this figure. First, it is what farms spend, not what repair firms earn. Second, NASS groups repairs with other supplies such as oils, lubricants, shop tools and temporary fencing. So it is a ceiling for repair spending, not an exact count.
The line has risen by about a quarter in four years, from $19.4 billion in 2020. Most of the rise came by 2023, and spending held flat in 2024.
Spending per farm grows fast with farm size. A farm selling under $10,000 a year spent $1,482 on average in 2024. A farm selling $1 million to $5 million spent $79,505. For farms above $5 million, the average was $351,908. About 79% of US farms reported some spending on this line.
By farm type, crop farms spent $14.0 billion on supplies and repairs in 2024, down from $14.9 billion in 2023. Livestock farms spent $10.0 billion, up from $9.2 billion.
Chart
Supplies and repairs spending per farm by sales class
Average US$ per farm, 2024, by annual gross sales
Why agricultural repair and service matters
Tractors, combines and planters do the core work of a season: planting, spraying, spreading and harvest. When one stops at the wrong time, the cost is not only the repair bill. Crops planted late, sprays missed and grain left in the field can cost far more than parts and labor.
Chart
Supplies and repairs: crop vs livestock farms
US$ billion, total for each farm type
Purdue economist Michael Langemeier explains that machine costs fall into two groups. Ownership costs cover depreciation, interest, insurance and housing. Operating costs cover repairs and maintenance, fuel, lubrication and labor. He adds that repair and maintenance costs can vary a lot among farms, and that a farm’s own repair records are the best guide.
That is why the first step in any plan is simple record keeping. Log hours, faults, parts and bills for each machine. After two or three seasons you can see which machines cost the most to keep running.
- Regular service keeps tractors, combines and sprayers ready for planting and harvest.
- Inspections catch small faults before they turn into field breakdowns.
- Good records show when a machine costs more to repair than to replace.
Common agricultural equipment repairs and solutions
Farm machines work long hours in dust, mud, heat and cold. The same faults come up again and again. Knowing them helps you plan parts and service before the busy season.
Engine diagnostics and repairs
Misfires, overheating and hard starting often trace back to dirty fuel, blocked filters, worn parts or poor cooling. A technician with the right diagnostic tool can read fault codes and find the cause quickly.
Hydraulic system maintenance
Hydraulics lift, steer and drive many implements. Common problems are leaking hoses, lost pressure and sticking valves or cylinders. Check hoses for cracks, keep fittings clean and change hydraulic oil and filters on schedule.
Transmission and gearbox repairs
Slipping gears, grinding noises and hard shifting are warning signs. Technicians inspect, lubricate and replace worn gears, bearings and seals.
Electrical system troubleshooting
Modern machines carry many sensors and control units. Loose wiring, weak batteries and corroded connectors can stop a machine as surely as a broken part. Clean and protect connectors, and test batteries before the season.
Brake inspections and replacements
Brake pads, discs and lines wear over time. Worn brakes are a safety risk on slopes and roads, so check them at every service.
PTO (power take-off) repairs
The PTO sends engine power to balers, augers, spreaders and sprayers. Noise, trouble engaging and uneven power need attention early. Keep guards in place; an unguarded shaft is a serious injury risk.
Cooling system and radiator repairs
Clean radiators and screens often in dusty work, replace coolant on schedule and inspect hoses. Overheating is one of the fastest ways to damage an engine.
Fertilizer spreader and sprayer care
Fertilizer salts and crop chemicals attack metal, seals and wiring. After each use, rinse the hopper, spinner discs or tank and booms. Check nozzles and calibrate the rate before each season, so the right amount goes on each acre. Follow the label and local rules for rinse water and product handling.
Common equipment issues and service solutions
The table lists typical faults by machine. Downtime and cost ranges are rough examples from the original version of this guide, not survey results. They vary widely by region, model, dealer and parts supply. Always get a written quote.
| Equipment | Common issues | Typical downtime (example) | Usual fix | Example cost range (US$) |
|---|---|---|---|---|
| Tractor | Overheating, starter failure, hydraulic leaks | 4-24 hours | Diagnostics, coolant flush, starter or hose replacement | 150-1,200 |
| Combine harvester | Clogged filters, electrical faults, transmission failure | 6-48 hours | Filter change, electrical checks, transmission repair | 300-3,000 |
| Seeder or planter | Worn belts, calibration errors, drive faults | 3-8 hours | Belt replacement, recalibration, drive check | 80-600 |
| Fertilizer spreader | Rust, worn spinner vanes, uneven spread | 2-8 hours | Cleaning, vane and chain replacement, calibration | 60-500 |
| Irrigation pump | Motor failure, leaks, electrical issues | 2-24 hours | Motor rewinding, seal replacement, wiring repair | 90-800 |
| Sprayer | Blocked nozzles, PTO shaft failure, tank leaks | 1-6 hours | Nozzle cleaning, PTO repair, seal replacement | 50-400 |
| Livestock and poultry equipment | Feeder motors, ventilation fans, water lines | 1-12 hours | Motor or fan replacement, line flushing | 50-700 |
Mobile repair: fixing machines in the field
A breakdown during planting or harvest can cost more than the repair itself. Mobile repair brings the technician, tools and common parts to the farm, so heavy machines do not need to be hauled to a workshop.
- Shorter downtime, because the machine is fixed where it stopped
- Lower hauling costs
- Faster diagnosis with portable tools
- Emergency call-outs in the busiest weeks
Independent mobile shops, such as 361 Repairs in central Minnesota, offer on-site diagnostics and repairs for many machine types. Dealer field-service trucks do the same for their brands.
Custom hire is another way to cover a gap. University of Illinois farmdoc estimates of machine costs show how much it costs to own and run a combine, cart and truck. Its harvest cost sheet notes that combine overhead includes depreciation, interest, insurance, housing and repair charges. Comparing those costs with local custom rates helps you judge whether to repair, replace or hire.
Preventive maintenance for farm equipment
Preventive maintenance means fixing small things on a schedule, before they fail. It covers inspections, part changes, calibration and, on newer machines, checks of fault codes.
- Oil changes, greasing and coolant checks
- Air, oil, fuel and hydraulic filter changes
- Belt, chain and hose inspections
- Tire pressure and wear checks
- Calibration of planters, sprayers and spreaders
The payoff is fewer sudden failures, smaller repair bills and longer machine life. Follow the service intervals in your operator’s manual; they differ by make, model and workload. Many dealers, such as Holt Ag Solutions in Texas, sell service plans that bundle these checks. For a step-by-step routine for hand tools and small implements, see our guide to preventive maintenance of farm tools.
Fleet records help too. Farms and contractors with many machines use fleet management tools to track hours, locations and service dates in one place.
Use the calculator below to compare one breakdown at a busy time with the cost of a yearly service plan. Every value is an example; replace it with your own.
Try the numbers for your own farm below.
Calculator
Is a service plan cheaper than one breakdown?
Compare one breakdown in a busy week with a yearly service plan.
- Crop value lost to delay: 2,041 US$
- Total cost of the breakdown: 3,541 US$
- Service plan cost: 3,500 US$
Example values only, set near break-even; replace every number with your own. Prices: example, use today’s price. The yield loss per day is your own estimate. This is a rough guide, not financial advice.
A seasonal maintenance checklist
Most breakdowns can be traced to a check that was skipped. A simple seasonal routine spreads the work across the year, so that no machine goes into a busy week untested.
Before planting
- Change engine oil and filters on tractors that sat over winter.
- Test batteries, lights and warning systems.
- Inspect planter discs, seed meters, chains and closing wheels.
- Calibrate sprayers and fertilizer spreaders with clean water or a test product, following the maker’s guide.
- Grease every fitting and check tire pressure.
During the season
- Walk around each machine every morning and look for leaks, loose bolts and worn belts.
- Blow dust out of radiators and air screens, more often in dry weather.
- Write down hours, faults and fixes the same day.
- Keep a small stock of filters, belts, hoses and shear bolts on the farm.
After harvest
- Clean combines, headers and carts thoroughly, as trapped crop holds moisture and attracts rodents.
- Wash spreaders and sprayers and treat bare metal against rust.
- Book major repairs in the quiet months, when shops have more time and parts arrive before spring.
- Store machines under cover where you can, to protect seals, tires and wiring.
Repair, replace or hire?
Each large repair raises the same question: is the machine still worth fixing? There is no single rule, but three checks help.
First, compare the repair quote with the machine’s market value. If one repair costs a large share of what the machine would sell for, look at replacing it. Second, look at your records. A machine whose repair bills climb every year will likely keep climbing. Third, think about timing. A machine that fails during harvest costs more than its repair bill, because crops wait.
Hiring a contractor is the third option. Custom rates include the contractor’s own repair costs, so for small acreages they can be cheaper than keeping a rarely used machine. Ask local contractors for prices and compare them with your own cost per acre.
Technology in equipment repair and maintenance
Newer tractors and combines carry control units, sensors and telematics. These change how repairs are found and planned.
- Built-in diagnostics show fault codes as soon as a problem starts.
- Telematics log hours and send service reminders.
- Software tools let technicians test parts before they replace them.
- Cloud records keep a full service history for each machine.
- Remote support lets an expert look at fault data without a farm visit.
The catch is access. Many of these tools have been sold only to authorized dealers, which is the root of the right-to-repair dispute below.
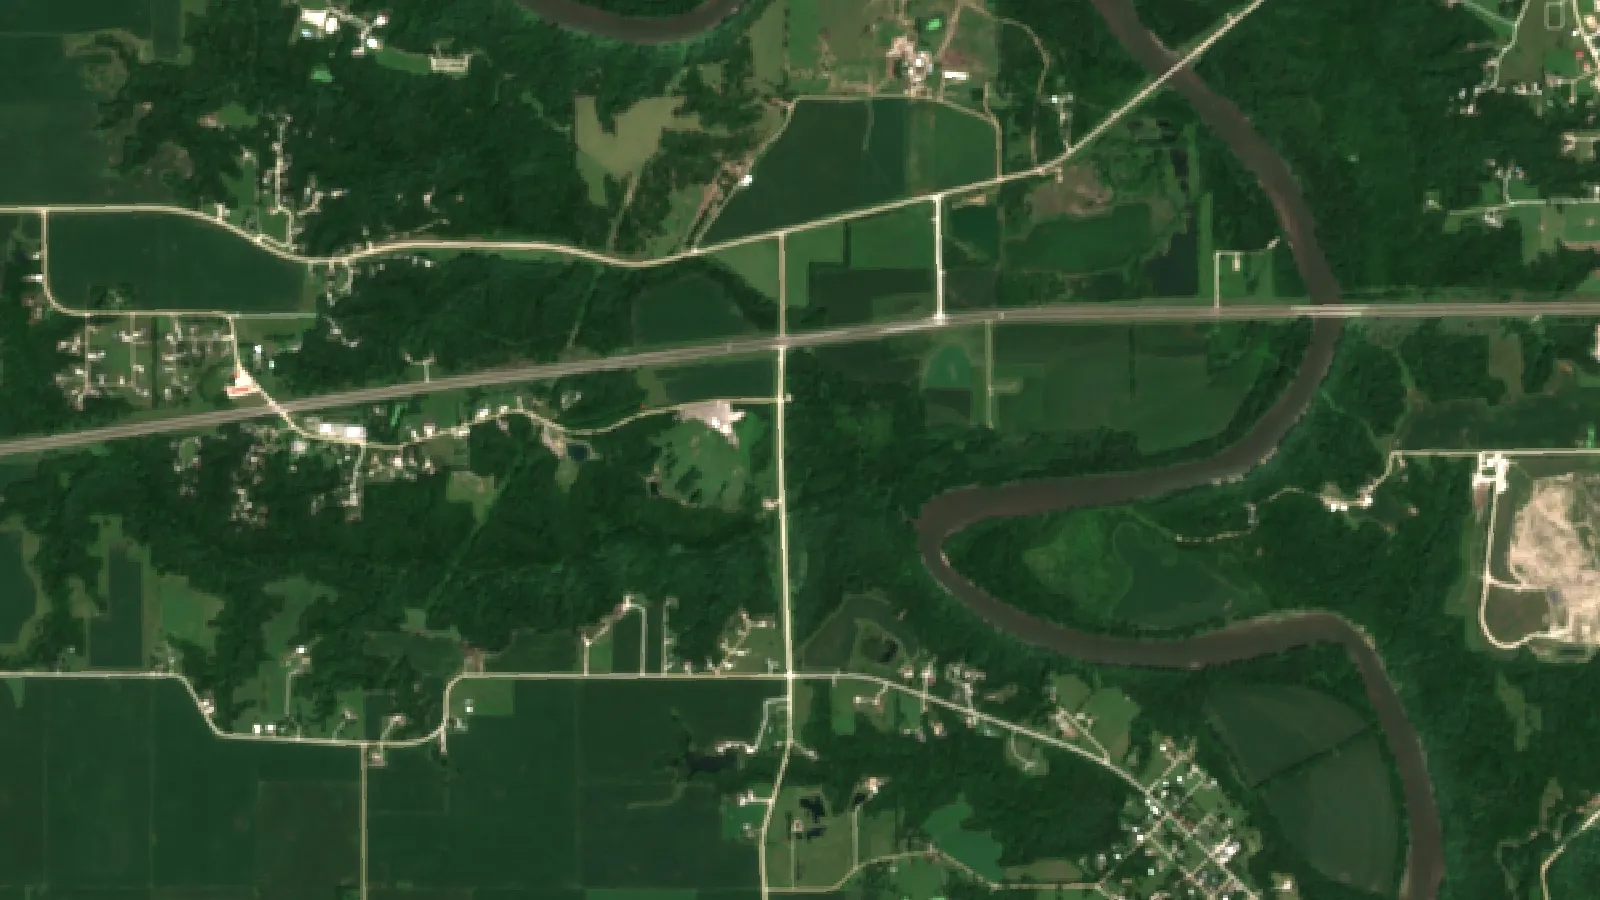
Field data can help as well. Satellite crop maps sometimes show stripes or patches where a planter row, sprayer section or spreader was not working. Seeing those patterns early can point to a machine fault before the next pass. Services built on satellite crop monitoring show vegetation maps for each field through the season, and the satellite and weather API lets developers bring that data into their own records.

▶ How satellite crop health maps show stress across a large farm, the kind of pattern that can point to a machine fault. · 4:09
Training and certification for technicians
Skilled technicians are the core of good service. As machines add electronics, training has to cover diesel engines, hydraulics, electrical systems and diagnostic software.
- Find mechanical, hydraulic and electronic faults fast
- Repair to the maker’s standards
- Use current diagnostic tools and software
- Advise farms on service schedules
In the US, community colleges and dealer programs train diesel and agricultural technicians. In Canada, the UK, Europe and Australia, apprenticeships do the same job. When you choose a shop, ask what training its staff hold for your brands.

▶ What new farm technology means for jobs and services in rural towns. · 3:50
Right to repair: the Deere settlement and what it means
Farmers have long asked for access to the manuals, software and parts needed to fix their own machines. In January 2025 the US Federal Trade Commission (FTC) sued Deere & Company; five states later joined the case. They said Deere drove up repair costs by forcing farmers to rely on its authorized dealer network.
The FTC announced a settlement in July 2026, filed as a proposed court order. According to the FTC’s settlement announcement, Deere must, for the next 10 years, give farmers and independent repair shops the same repair resources, including software, that it gives its authorized dealers. The FTC and the states of Arizona, Illinois, Michigan, Minnesota and Wisconsin will oversee it.
It was the second right-to-repair settlement Deere reached in 2026, after a separate $99 million class-action settlement with farmers in April. The class action paid farmers; the FTC order changes access going forward.
What it means in practice:
- Owners of Deere machines can buy the same diagnostic and repair tools dealers use.
- Independent shops can compete for repair work on Deere equipment.
- Other brands are not covered by this order, so check what tools your maker sells.
This is general information, not legal advice. Rules differ by state and country, so check local law or ask a professional advisor before relying on them.
Choosing a reliable agricultural equipment service provider
A good repair partner keeps your season on track. When you compare shops, look at:
- Experience: technicians trained on your brands and machine types
- Availability: emergency call-outs during planting and harvest
- Mobile service: trucks that can reach your fields
- Full service: scheduled maintenance, major repairs, calibration and diagnostics
- Clear pricing: written quotes, labor rates and parts prices up front
- Parts supply: stock of common wear parts near you
Large farms often link service planning with their wider farm records. Data on product traceability and carbon footprinting also rely on accurate machine logs, such as fuel use and field passes.
Related pages on our site: sustainable farming practices.
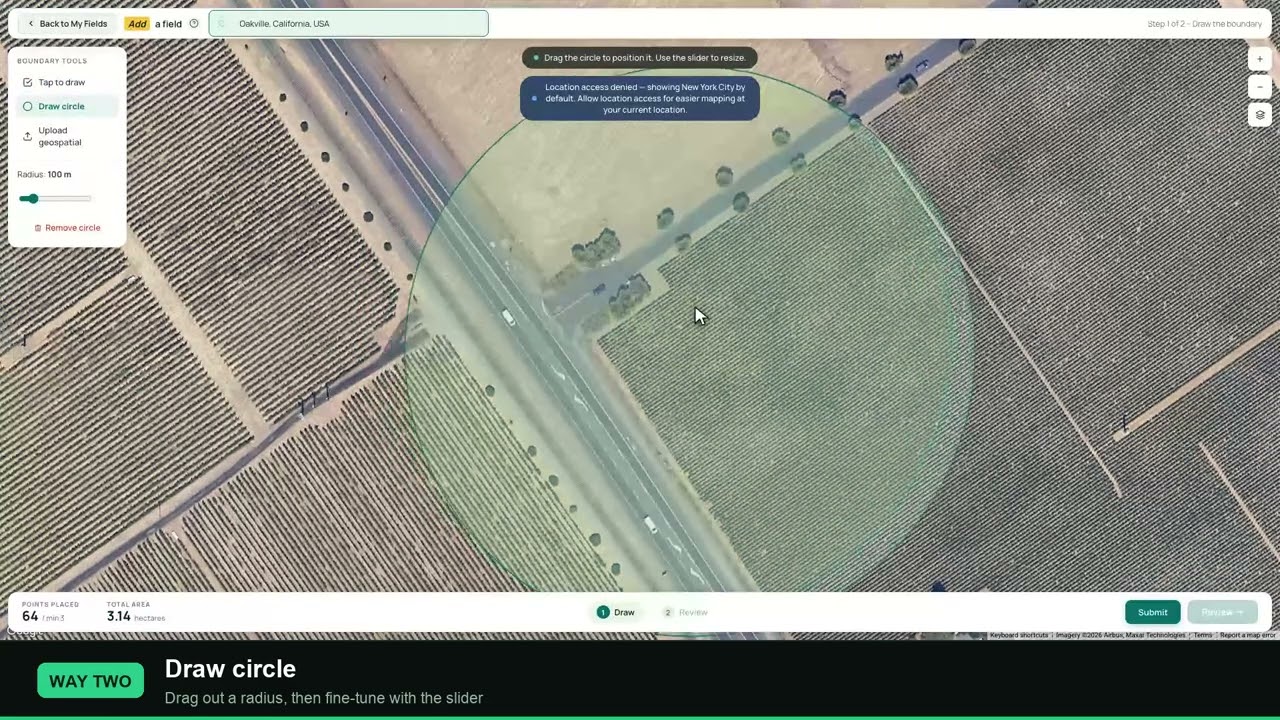
▶ How to add a field boundary so each field has its own record. · 3:50
Repair costs outside the US
Farms in Canada, the UK, Europe, Australia and New Zealand face the same basic issues: costly parts, long dealer distances and tools locked to dealers. National farm surveys in those countries report machinery costs in their own categories, so their figures cannot be added to the USDA number. Ask your local farm advisory service or farm business survey for benchmarks that fit your region and farm type.
The Deere settlement is a US order. Farmers elsewhere should check what repair tools and software their dealer or maker sells locally, as access differs by country and brand.
How we checked the numbers
Spending figures come from the USDA NASS Farm Production Expenditures 2024 Summary (July 2025). Market sizes come from the public summaries of three paid reports and are labelled as such. Right-to-repair facts come from the FTC announcement and University of Illinois Farm Policy News coverage. Downtime and cost ranges in the repair table are examples only.
FAQ
How big is the agricultural fertilizer equipment repair and maintenance market?
No public source gives a separate size for fertilizer equipment repair. The wider machinery maintenance market is valued at about US$33 billion to US$40 billion a year worldwide by three research firms. US farms spent $24.0 billion on supplies and repairs in 2024 (USDA NASS).
What does preventive maintenance for farm equipment include?
Inspections, oil and filter changes, greasing, coolant and hydraulic checks, belt and tire checks, calibration of planters, sprayers and spreaders, and scheduled replacement of wear parts.
How often should a tractor be serviced?
Follow the intervals in your operator’s manual, which depend on make, model and hours of use. Also check machines before and after each busy season.
What did the Deere right-to-repair settlement change?
Under the July 2026 FTC settlement, Deere must give farmers and independent shops the same repair tools and software as its dealers for 10 years.
Where can I find reliable maintenance services to keep downtime low?
Ask your dealer about service plans, find independent mobile repair shops nearby, and compare written quotes. Ask about emergency call-outs in harvest and planting weeks.
Farmonaut crop monitoring
Spot field problems from space
Draw your fields once and Farmonaut shows satellite vegetation maps for them through the season, on web, Android or iOS.





Sources
- USDA NASS, Farm Production Expenditures 2024 Summary (July 2025): esmis.nal.usda.gov
- Global Market Insights, Agricultural Machinery Maintenance Services Market (via GII Research): giiresearch.com
- Market.us, Agricultural Machinery Maintenance Services Market: market.us
- WiseGuyReports, Agricultural Equipment Repair Service Market: wiseguyreports.com
- Langemeier, Farm Machinery Costs and Custom Rates, Purdue Center for Commercial Agriculture (2017): ag.purdue.edu
- University of Illinois farmdoc, Harvest Operations machinery costs (September 2021): farmdoc.illinois.edu
- Farm Policy News (University of Illinois), FTC Sues John Deere Over Right to Repair (January 2025): farmpolicynews.illinois.edu
- Farm Policy News (University of Illinois), FTC Settlement Secures Right to Repair for Farmers (July 2026): farmpolicynews.illinois.edu
- Potato Grower, FTC, States Secure Settlement With Deere & Company (July 2026): potatogrower.com
- Iowa State University Extension, Estimating Farm Machinery Costs, PM 710 (March 2026): store.extension.iastate.edu
Discussion
Questions, corrections or field experience? Share them below. First-time comments are reviewed before they appear, and your email is never published.
No comments yet. Be the first to add a question or your experience.

 Bharat Krushi Seva
 Geno
 Hayleys Agriculture
 Linx Agritech
 Adinet
 Save Your Soils
 Grandstream Algérie
 XOS Realty
 Geospatial Lab Africa
 Agro La Gándara
 HIPSAC
 ZOL Zimbabwe
 Juligerm
 AdBio
 MISE Maroc
 NWNS

 Licence holder · Niger · Gold
 Client · Somalia · Gold
 Client & affiliate partner · Ghana · Gold










