

Farm finance · Lender comparison
Best Bank for Agriculture Loan: 6 Farm Lenders Ranked
No single bank is best for every farm. At the end of 2025 the Farm Credit System held 48% of US farm debt and commercial banks 34% (USDA ERS). FSA lends directly to farmers who cannot get credit elsewhere, at 5.375% for operating loans from 1 October 2026.
Key takeaways
- The Farm Credit System held 48% of US farm debt in 2025 and leads in farmland loans; commercial banks held 34% and are close to Farm Credit on non-real estate loans (USDA ERS).
- USDA FSA direct rates from 1 October 2026: 5.375% for operating loans, 6.25% for farm ownership and 2.25% for the down payment program.
- Commercial bank survey averages in early 2026 were 7.1% for operating and 6.7% for farm real estate loans in the Chicago Fed district (University of Illinois summary).
- FSA direct loans go to farmers who cannot get credit elsewhere on reasonable terms; FSA can also guarantee a bank loan up to $2,558,000.
- Get written quotes from at least one Farm Credit association and one bank, and compare the total cost of rate, fees and term, not the rate alone.
In this article
- Which bank is best for an agriculture loan?
- Six types of farm lender, ranked by share of US farm debt
- How we ranked the lenders and checked the numbers
- Agriculture loan rates: what each lender charges
- USDA FSA loan limits and terms
- How to choose the best bank for your farm loan
- Step by step: applying for an agriculture loan
- Farm lenders outside the United States
- Where satellite farm records fit in a loan application
- FAQ
There is no single best bank for an agriculture loan, but the data shows where farmers actually borrow. At the end of 2025, the Farm Credit System held 48% of US farm debt and commercial banks held 34%, according to USDA’s Economic Research Service. For farmers who cannot get credit elsewhere, the USDA Farm Service Agency (FSA) lends directly, at 5.375% for operating loans from 1 October 2026.
This guide compares the six main types of farm lender in the United States, with short notes on Canada, Australia and the UK. It gives dated rates and loan limits from official sources, three charts built from USDA data, and a calculator that compares two loan offers on your own numbers. It is general information, not financial advice. Rates change often, so always compare written offers and check current terms with each lender before you sign.
Which bank is best for an agriculture loan?
The right lender depends on what you are financing. A land purchase, a one-year operating line and a tractor loan are different products, and lenders specialise. USDA data shows that the Farm Credit System held more farm real estate debt than any other lender at the end of 2025, while commercial banks were close to Farm Credit on non-real estate loans (operating, machinery, livestock).
Chart
Who holds US farm debt
Share of total US farm debt by lender, end of 2025 (percent of $578.8 billion)
So the useful question is not “which bank is best” in general. It is “which lender is best for this loan, on this farm, right now”. A practical start is to get quotes from at least one Farm Credit association and one local or regional bank with an agricultural lending team. If both say no, FSA may be able to lend directly or guarantee a loan from a commercial lender.
A few points apply to every lender:
- Compare the full cost, not just the headline rate. Fees, the rate type (fixed or variable) and the term change the total you pay.
- Match the loan term to the asset. Land can be financed over decades; seed, feed and fertilizer should be repaid from the crop or livestock they produce.
- Ask how repayment dates fit your cash flow. Many farms receive most of their income at harvest or at sale time.
Six types of farm lender, ranked by share of US farm debt
We ranked lender types by their share of total US farm debt at the end of 2025, using the USDA balance sheet published on 3 September 2026. A bigger share does not make a lender better for you. It shows who does the most farm lending and therefore who you are most likely to deal with.
Chart
Real estate versus non-real estate farm debt
US farm debt held at end of 2025, billion dollars, real estate vs non-real estate
1. Farm Credit System (48% of farm debt)
Best for: farmland purchases, long-term real estate loans, and farmers who want a lender that only does agriculture and rural lending.
The Farm Credit System is a nationwide network of borrower-owned lending institutions. It is regulated by the Farm Credit Administration. In 2025 it held about $280 billion of farm debt, including $193 billion of farm real estate debt, the largest share of any lender. You borrow from a local association, which is a cooperative owned by its borrowers.
The System also reports on lending to young, beginning and small farmers. In 2025 it made 310,821 loans worth $150.2 billion, and 175,068 of those loans, worth $38.2 billion, went to young, beginning or small producers. Ask your local association what programs it runs for newer farmers.
2. Commercial banks (34% of farm debt)
Best for: operating lines of credit, equipment and livestock loans, and farmers who want one bank for farm, business and personal accounts.
Commercial banks held about $198 billion of farm debt in 2025. They are strongest in non-real estate lending (operating, machinery, livestock): banks held $82 billion of non-real estate farm debt, close to Farm Credit’s $88 billion. Options range from small community banks with a few agricultural loan officers to large national banks with dedicated agribusiness divisions. Ask each bank how many farm loans it makes and whether a loan officer specialises in agriculture.
FSA also guarantees loans made by approved commercial lenders, covering up to 95% of the lender’s loss of principal and interest. If your application is borderline, ask whether the bank can make the loan with an FSA guarantee.
3. Individuals and other lenders (8% of farm debt)
Best for: buying land from a retiring farmer on a land contract, or short-term input credit from a supplier.
This group includes family members, land sellers who finance the sale themselves, input suppliers, equipment dealers and other sources. It held about $45 billion of farm debt in 2025. Dealer and supplier credit is quick to arrange, but read the terms closely and compare the cost with a bank or Farm Credit loan. USDA’s research found that farms lean on these sources more for non-real estate loans than for land.
4. Life insurance companies (4% of farm debt)
Best for: large, long-term farm real estate loans for established operations with strong balance sheets.
Life insurance companies lend only on farm real estate in the USDA data, and held about $24 billion in 2025. Life insurance lenders suit large loans secured by land; the USDA data shows no operating (non-real estate) farm debt held by them.
5. USDA Farm Service Agency direct loans (3% of farm debt)
Best for: beginning farmers, farmers who have been turned down elsewhere, and small loans through the microloan program.
FSA is a government lender, not a bank. Its direct loans held about $18 billion of farm debt in 2025. To qualify for a direct operating loan you must show a satisfactory credit history, the ability to repay, and that you cannot get credit elsewhere at reasonable rates and terms. In return you get rates set by FSA, which in October 2026 were below the commercial bank survey averages from early 2026, and special terms for beginning farmers. The down payment program for farmland charged 2.25% from 1 October 2026.
FSA also guarantees loans made by commercial banks and Farm Credit lenders. Those guaranteed loans are counted under the lender that made them, not under FSA, so FSA’s role in farm credit is bigger than its 3% share suggests. Our guide to USDA grants and loans for farming covers other USDA programs.
6. Farmer Mac (2% of farm debt)
Best for: borrowers whose bank or Farm Credit lender wants to offer a long-term fixed rate on a land loan.
Farmer Mac, created in 1988, runs a secondary market for agricultural real estate loans. It buys eligible loans from lenders and guarantees securities backed by them, which gives lenders more capacity to offer long-term credit at stable rates. Farmers deal with their own lender, not with Farmer Mac. Farmer Mac held about $12 billion of farm real estate debt in 2025. Ask your lender whether it uses Farmer Mac if you want a long fixed-rate period.
How we ranked the lenders and checked the numbers
The ranking uses one source for every share: USDA ERS farm debt by lender, end of 2025, from the farm sector balance sheet dated 3 September 2026. Total farm debt was $578.8 billion in 2025, and ERS forecast $605.1 billion for 2026. The 2026 forecast is not yet broken down by lender, so 2025 is the latest year with lender shares.
Chart
Farm Credit’s lead over banks has widened
Total US farm debt held, billion dollars, 2019 to 2025
Rates come from the FSA rate page (effective 1 October 2026) and from Federal Reserve district surveys of commercial banks for the first quarter of 2026. Loan limits come from FSA program pages as of October 2026 and FSA’s October 2025 loan chart. We did not rank individual banks by name, because no official source compares named lenders on price and service, and offers differ by borrower.
Agriculture loan rates: what each lender charges
FSA updates its direct loan rates regularly, based on its borrowing costs. From 1 October 2026 they were 5.375% for direct operating loans and microloans (FSA’s loan chart caps the microloan rate at 5% for beginning and veteran farmers), 6.25% for direct farm ownership loans, 4.25% for joint financing and 2.25% for the down payment program. Emergency loans for actual losses were 3.75%.
Chart
USDA FSA direct loan rates
Interest rate, percent, effective 1 October 2026
Banks and Farm Credit lenders set their own rates. Federal Reserve district surveys of commercial banks, summarised by the University of Illinois, put average fixed rates in the first quarter of 2026 at 7.1% for operating loans and 6.7% for farm real estate loans in the Chicago district. In the St. Louis district they were 7.2% and 7.1%. Both were lower than a year earlier. Your own rate will depend on your credit history, collateral, loan size and whether the rate is fixed or variable.
For FSA guaranteed loans, the lender sets the rate, but FSA caps it. Loans with a variable rate or a rate fixed for under five years may not exceed the prior day’s SOFR plus 6.75%. Loans fixed for five years or more may not exceed the five-year Treasury rate plus 5.5%.
Try the numbers for your own farm below.
Calculator
Which of two loan offers costs less in total?
Enter the amount, term and each lender’s rate and up-front fee from your written offers.
- Offer A annual payment: $45,378
- Offer B annual payment: $43,592
- Offer A interest plus fees: $410,064
- Offer B interest plus fees: $379,346
Example values only, not a benchmark or a forecast. The defaults are round example numbers, not quotes from any lender. The calculator assumes a fixed rate and one level payment per year (annual amortisation); monthly payments, variable rates, patronage refunds and other fees will change the result. Nothing in it is a fixed constant. This is not financial advice: confirm current terms with each lender.
USDA FSA loan limits and terms
FSA limits change with new farm bills and with inflation adjustments, so check before you apply. The table shows the limits on FSA program pages in October 2026 and in FSA’s October 2025 loan chart.
| FSA loan | Maximum amount | Term | Rate |
|---|---|---|---|
| Direct operating | $400,000 | 1 to 7 years | Set by FSA (5.375%, Oct 2026) |
| Operating microloan | $50,000 | Up to 7 years | Same as direct operating; capped at 5% for beginning and veteran farmers |
| Direct ownership | $600,000 | Up to 40 years | Set by FSA (6.25%, Oct 2026) |
| Down payment loan | 45% of price, up to $300,150 | 20 years | Ownership rate minus 4%, floor 1.5% |
| Guaranteed loans | $2,558,000 | Up to 7 years (operating) or 40 years (ownership) | Set by the lender, capped by FSA |
The down payment program needs at least 5% down from the buyer. FSA’s October 2025 loan chart lists a 1.5% guarantee fee on guaranteed loans. FSA limits can change with new legislation; check the FSA program pages before you apply.
How to choose the best bank for your farm loan
Use these checks when you compare offers. They apply in any country.
- Match the lender to the loan. For land, ask a Farm Credit association, a bank and, for large loans, a life insurance lender. For an operating line, ask your bank and your Farm Credit association.
- Compare the total cost. Put each offer’s rate, fees and term into the calculator above. A lower rate with higher fees can cost more over a short term.
- Ask about fixed and variable rates. A variable rate may start lower but can rise. Ask how often it resets and what it is tied to.
- Check repayment timing. Annual or semi-annual payments that follow harvest or sale dates are easier to manage than monthly payments for many farms.
- Look at agricultural knowledge. A loan officer who understands your crops, livestock and local land market can structure a better loan. Good farm management records make this conversation easier.
- Ask what happens in a bad year. Find out whether the lender can defer a payment or restructure, and whether it is an approved FSA guaranteed lender.
- Read the collateral terms. Know which land, equipment, livestock or crops secure the loan, and whether the lender will take a blanket lien.
Equipment is a common reason to borrow. Our article on how farm mechanization changed farming in Texas gives background on why machinery loans grew. For lenders outside banks and Farm Credit, see our guide to agriculture lending and private money lenders.
Step by step: applying for an agriculture loan
- Write down what you need. Say what the money is for, how much, and when you need it.
- Prepare your records. Expect to be asked for a balance sheet, income and expense records or tax returns for recent years, a cash flow plan for the coming year, and details of land, equipment and livestock.
- Write a short farm plan. Show your crops or livestock, expected yields and prices, and how the loan will be repaid. FSA asks for a farm business plan with its applications.
- Get at least two quotes. Ask a Farm Credit association and a bank. If you are a beginning farmer or have been turned down, also visit your local FSA office.
- Compare written offers. Check the rate, rate type, fees, term, payment dates, collateral and any covenants.
- Read the documents before you sign. If anything is unclear, ask the lender, and consider asking an accountant or farm financial adviser.
Farm lenders outside the United States
Canada. Farm Credit Canada (FCC) is a federal Crown corporation that reports to Parliament through the Minister of Agriculture and Agri-Food. It says it serves more than 104,000 customers from 99 offices (FCC corporate profile, October 2026). Canada’s chartered banks and credit unions also lend to farms. Under the Canadian Agricultural Loans Act (CALA) Program, the federal government guarantees to the lender 95% of a net loss on an eligible loan. The CALA limit for one farm operation is C$500,000 in total: up to C$500,000 for land and buildings, and up to C$350,000 for other purposes such as equipment.
Australia. Farmers can borrow from banks and agribusiness lenders. Check government farm-finance programs in your state for current terms.
United Kingdom. Farmers can borrow from high-street banks with agricultural teams, specialist agricultural mortgage lenders and machinery finance companies. The same rule applies: compare the total cost of at least two written offers.
Where satellite farm records fit in a loan application
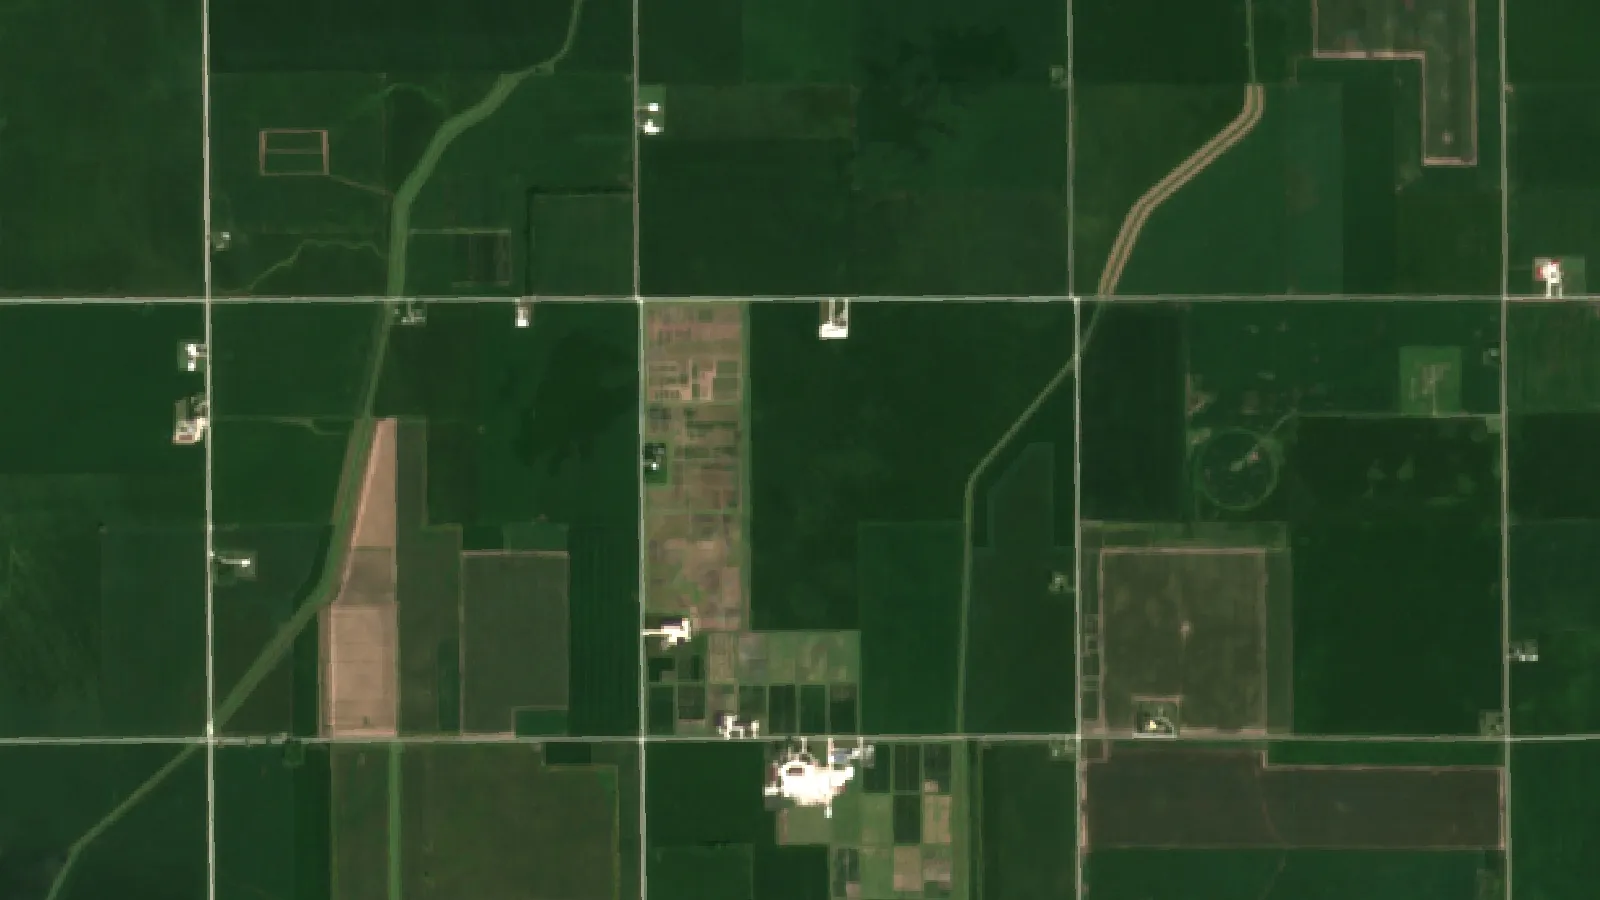
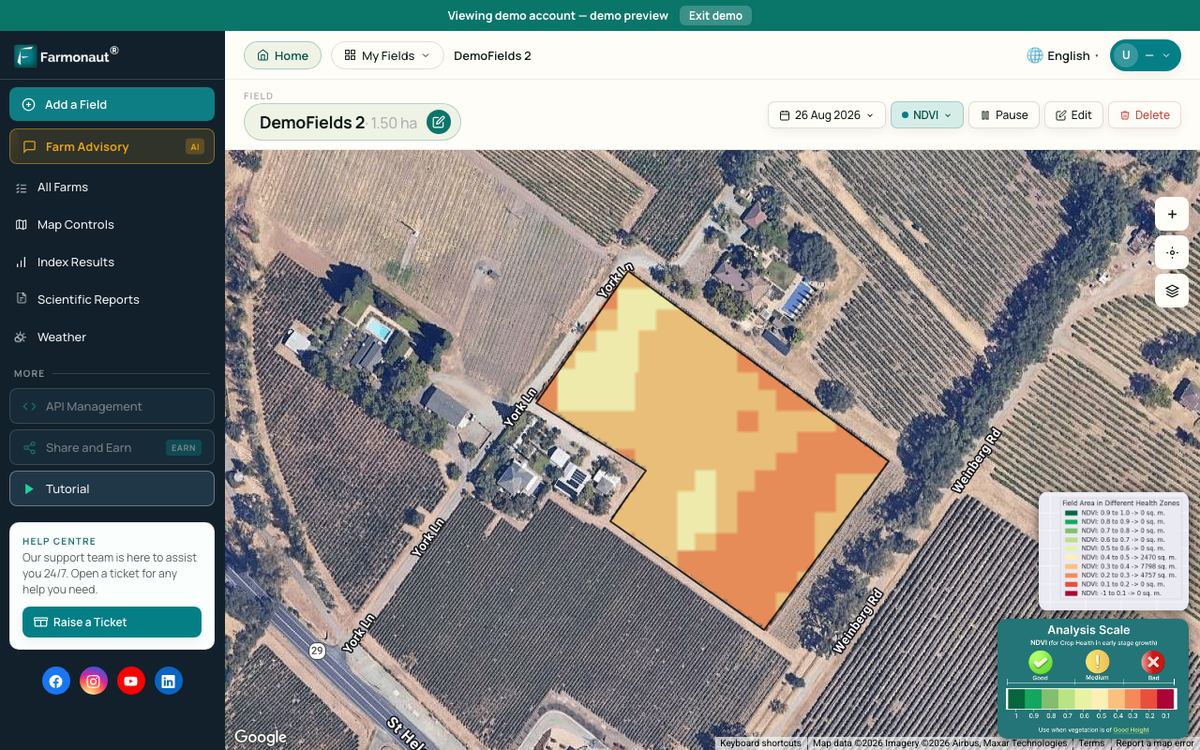
Some lenders ask for records that show how the farm is run. Field maps, planting dates and crop condition records support the farm plan you give your lender. Satellite images can show vegetation change across a field over a season. They do not show the cause of a problem, and they do not replace financial records.
The Farmonaut Satellite + AI Farm Monitoring System gives field-level crop condition maps from satellite data. Farmonaut also has a crop loan and insurance verification page that describes satellite field checks for lenders and insurers. Related tools cover product traceability, carbon footprinting and fleet management. Lenders that want to add satellite data to their own systems can use the Farmonaut API developer docs. Whether a lender accepts these records is up to the lender.
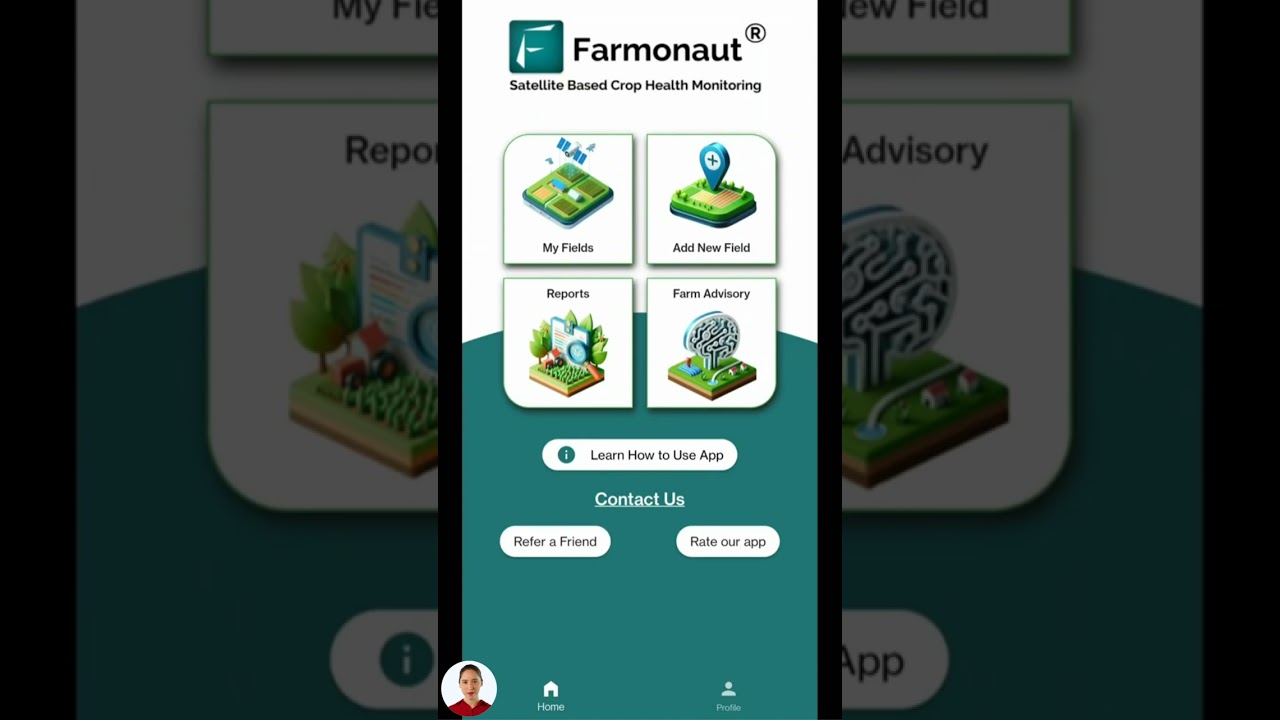
▶ How to open a consolidated satellite report covering all your fields in the Farmonaut mobile app · 1:24
FAQ
Which bank is best for farmers?
No single bank is best for every farm. In the US, the Farm Credit System (48% of farm debt in 2025) and commercial banks (34%) do most farm lending. Get quotes from at least one of each and compare the total cost.
Who has the lowest agriculture loan rates?
FSA’s direct rates from 1 October 2026 (5.375% operating, 6.25% ownership) were below the commercial bank survey averages for early 2026. But FSA lends directly only to farmers who cannot get credit elsewhere on reasonable terms. Commercial bank survey averages were 6.7% to 7.2% in early 2026 in the Chicago and St. Louis districts.
Can a beginning farmer get an agriculture loan?
Yes. FSA has a down payment program (2.25% from 1 October 2026, at least 5% down) and microloans up to $50,000, with the rate capped at 5% for beginning and veteran farmers. Farm Credit associations also report lending to young, beginning and small farmers.
Is Farm Credit a bank?
Not in the usual sense. The Farm Credit System is a network of borrower-owned lending cooperatives regulated by the Farm Credit Administration, not a commercial bank. Its regulator, the Farm Credit Administration, says its mission is to keep the System a safe, sound and dependable source of credit for creditworthy, eligible borrowers in agriculture and rural America.
What do I need to apply for a farm loan?
Expect to be asked for a balance sheet, recent income records or tax returns, a cash flow plan, a description of the loan purpose and details of collateral. FSA also asks for a farm business plan.
Does this guide give financial advice?
No. It gives dated, sourced rates and terms. Your offer will depend on your circumstances. Compare written offers and confirm current terms with each lender.
Farmonaut crop monitoring
Keep field records your lender can read
The Farmonaut Satellite + AI Farm Monitoring System maps crop condition across your fields through the season. It shows vegetation change, not its cause.



Keep reading
Sources
- USDA ERS, U.S. farm sector financial indicators 2019-2026F (data as of 3 September 2026): ers.usda.gov
- USDA ERS, Farm Sector Income and Finances: Assets, Debt, and Wealth (updated 3 September 2026): ers.usda.gov
- USDA ERS, Debt Use by U.S. Farm Businesses, 2012-2021, EIB-273 (June 2024): ers.usda.gov
- USDA FSA, Current FSA Loan Interest Rates (effective 1 October 2026): fsa.usda.gov
- USDA FSA, Farm Operating Loans: fsa.usda.gov
- USDA FSA, Farm Ownership Loans: fsa.usda.gov
- USDA FSA, Guaranteed Farm Loans: fsa.usda.gov
- USDA FSA, Farm Loan Information Chart (October 2025): fsa.usda.gov
- Farm Credit Administration, 2025 annual report on young, beginning and small farmer lending (news release, 13 August 2026): fca.gov
- Farm Credit Administration, About Farmer Mac: fca.gov
- University of Illinois farmdoc daily, Agricultural Credit Conditions in Illinois, First Quarter 2026 (12 June 2026): farmdocdaily.illinois.edu
- Agriculture and Agri-Food Canada, Canadian Agricultural Loans Act Program: agriculture.canada.ca
- Farm Credit Canada, Corporate profile: fcc-fac.ca
- Farm Credit Administration, The Farm Credit System: fca.gov
Discussion
Questions, corrections or field experience? Share them below. First-time comments are reviewed before they appear, and your email is never published.
No comments yet. Be the first to add a question or your experience.

 Etech Consulting Madagascar
 Vestlandsforsking
 Global Launch Base
 Elders
 Agritein
 Delicio
 WB Dev
 Sama Premium
 Prochecker
 Tres Valles
 LACOS Geoinformation
 Magrifly
 LatConnect 60
 WebsEdge
 Blickwinkel
 Agricultural Credit Policy Council
 Marei Nursery
 eKGIS
 Mostas Tech
 Andex

 Exploration consultancy · South Africa · Gold
 Licence holder · Niger · Gold
 Licence holder · Nigeria · Gold + lithium










