

Reviewed September 2026 against USDA NASS Crop Production and Acreage reports and USDA ERS tillage/cover-crop survey data.
Try it: Run your own numbers →
Table of Contents
- What Is Broadacre Farming? Examples From Real Acreage Data
- Farming Is an Example Of: Where Broadacre Fits
- Characteristics of Broadacre Farming
- Corn, Soybean & Wheat: A Broadacre Comparison Table
- Broad Acre Cropping vs. Agricultura Extensiva
- Sustainability Challenges in Broad Acre Cropping
- 7 Sustainable Practices in Broadacre Agriculture
- Cover Crop & No-Till Acreage Calculator
- Technology on the Modern Broadacre Farm
- How Farmonaut Supports Broadacre Operations
- FAQ
- Conclusion
- Try it: Run your own numbers
What Is Broadacre Farming? Examples From Real Acreage Data
Broadacre farming (also spelled broad acre farming, and known outside North America as extensive farming or, in Spanish, agricultura extensiva) is the large-scale, mechanized production of field crops — cereals, oilseeds, and pulses — across expanses of land measured in hundreds or thousands of acres rather than city lots or market gardens. The clearest broadacre farming example in the United States is the Corn Belt itself: USDA’s National Agricultural Statistics Service (NASS) put 2026 US corn planted acreage at 95.3 million acres, soybean planted acreage at 85.4 million acres, and all-wheat planted acreage at 42.7 million acres, according to the June 30, 2026 Acreage report.
That single statistic answers the “farming is an example of” question directly: broadacre farming is an example of extensive, mechanized monoculture or rotation cropping, distinct from intensive horticulture (orchards, vegetables, greenhouse production) where output per acre matters more than acres covered. If you searched “broad acre crops” or “broadacre cropping” looking for a working definition, this is it — one operator, GPS-guided equipment, and a few crop types spread across a landform large enough that field edges barely register in the yield math.

Farming Is an Example Of: Where Broadacre Fits
“Farming” as a category splits into several production systems, and broadacre sits at one end of the scale spectrum:
- Broadacre / extensive farming: low labor and capital input per acre, large contiguous fields — wheat, corn, soybeans, canola, barley, pulses.
- Intensive/horticultural farming: high input and labor per acre on small plots — vegetables, fruit, greenhouse crops.
- Mixed farming: combines broadacre cropping with livestock grazing on the same operation, common across the US Great Plains and Canadian Prairies.
- Subsistence farming: production sized to household or local consumption rather than commercial scale — not the subject of this page.
This is why “farming is an example of” broadacre production specifically when the crop is a cereal, oilseed, or pulse grown on a mechanized, multi-hundred-acre or multi-thousand-acre scale. A backyard vegetable plot is farming, but it is not a broadacre farming example — it lacks the scale, mechanization, and monoculture/rotation structure that define the category.
Characteristics of Broadacre Farming
Five features distinguish a broadacre operation from other farm types:
- Extensive land use: US broadacre row-crop farms commonly run from several hundred to several thousand acres per operation, reflecting the 95.3 million acres of corn and 85.4 million acres of soybeans planted nationwide in 2026 (USDA NASS).
- Mechanization: GPS-guided seeders, sprayers, and combines let a small crew manage thousands of acres — see precision farming innovations for the equipment side of this.
- Cereal and oilseed focus: corn, soybeans, wheat, barley, and canola dominate broadacre acreage; USDA’s 2026 forecast puts corn yield at 180.7 bushels per acre, soybean yield at 52.7 bushels per acre, and wheat yield at 47.8 bushels per acre (August 2026 Crop Production report).
- Low labor input per acre: mechanization is what makes thousand-acre-plus operations viable with a handful of full-time staff.
- Flat-to-rolling terrain: broadacre systems concentrate where large equipment can run unobstructed — the US Midwest, the Canadian Prairies, and Australia’s Wheatbelt are the textbook regions.

Corn, Soybean & Wheat: A Broadacre Comparison Table
Here is what “broad acre crops” actually looks like in numbers for the three biggest US field crops, all drawn from USDA NASS’s 2026 Acreage report (June 30, 2026) and August 2026 Crop Production report:
| Crop | 2026 US Planted Acreage | 2026 Yield Forecast (Aug. 2026) | 2026 US Production Forecast |
|---|---|---|---|
| Corn | 95.3 million acres | 180.7 bushels/acre | 16.0 billion bushels |
| Soybeans | 85.4 million acres | 52.7 bushels/acre | 4.52 billion bushels |
| All Wheat | 42.7 million acres | 47.8 bushels/acre | Not published in the cited release; see NASS Crop Production for the current wheat production total |
Source: USDA NASS Acreage, June 30, 2026 and USDA NASS Crop Production, August 2026. NASS refiles Acreage and Crop Production reports monthly, with the next release due in October 2026 — pull the current figures from nass.usda.gov/Newsroom or from the historical QuickStats database at quickstats.nass.usda.gov, which breaks acreage and yield down to the county level for any crop year.
Broad Acre Cropping vs. Agricultura Extensiva
“Agricultura extensiva” is the Spanish-language term for the same production model described throughout this page: large land area, mechanized input, low labor and capital per acre, cereal and oilseed focus. Ejemplos de agricultura extensiva in North America map directly onto the US figures above — corn and soybean production across the Midwest, and wheat production across the Great Plains, are the same broadacre systems by another name. The terminology differs by region (broadacre in Australia and increasingly in US trade press, extensive farming in UK usage, agricultura extensiva in Spanish-speaking markets), but the underlying system — mechanized, large-scale, low input-per-acre cereal and oilseed production — is identical, and the acreage and yield data in the comparison table above apply to it regardless of what it’s called locally.
Broadacre and Upland Farming Examples
A related upland farming example sits at the edge of the broadacre category: upland wheat and barley operations on rolling terrain that still allow mechanized seeding and harvest, just with more topography to manage than the flat Midwest Corn Belt. These operations follow the same rotation and tillage logic covered in the sustainable practices section below, adjusted for slope-driven erosion risk.
Sustainability Challenges in Broad Acre Cropping
Broadacre systems face a specific, well-documented set of environmental pressures, not a vague “environmental impact” — here is what the data shows and what it doesn’t:
- Soil erosion from repeated tillage and bare fallow periods between crops.
- Low baseline cover crop adoption: USDA’s Economic Research Service found only 8.2% of corn and cotton acres carried a cover crop as of the 2016 survey year — the most recent nationally representative figure ERS has published for this metric.
- Tillage intensity gaps: ERS/NASS Agricultural Resource Management Survey (ARMS) data for 2013–2016 found only 18% of corn acres under continuous no-till or strip-till, while 27% of corn acres alternated no-till/strip-till with conventional full-width tillage in the same period.
- Nutrient depletion and reduced organic matter under continuous monocropping without rotation.
- Rising input costs for fuel, fertilizer, and crop protection products — USDA ERS’s Commodity Costs and Returns database tracks per-acre cost breakdowns by crop and region, though specific current-year cost figures were not available for this article; check ERS’s Commodity Costs and Returns page directly for the latest regional cost tables, updated annually.
On quantified soil health outcomes — nutrient retention, water infiltration rates, organic matter gains from specific practices — USDA does not publish a standardized national metric; the academic literature reports site-specific results that don’t roll up into one number. If you need a figure for a specific farm or region, the source to check is your state’s NRCS soil health office or a university extension trial for your soil type, not a national average.

7 Sustainable Practices in Broadacre Agriculture
These seven practices are what a broadacre operation actually adopts to raise the adoption numbers cited above. Each is described with what it does and where the verified adoption data currently stands.
- Crop Rotation: Alternating cereals (wheat, barley, corn) with legumes (soybeans, peas, lentils) to rebuild soil nitrogen and break pest cycles. NASS does not separately report a national rotation-adoption percentage — rotation data is folded into tillage practice surveys rather than tracked on its own, so use your state extension’s cropping-systems survey for a local figure.
- Conservation Tillage (No-Till/Strip-Till): The most rigorously measured practice on this list. USDA ERS/NASS ARMS data for 2013–2016 shows 18% of corn acres under continuous no-till or strip-till, and another 27% alternating those methods with conventional tillage — meaning close to half of surveyed corn acres used reduced tillage at least part of the rotation.
- Precision Agriculture: Satellite imagery, AI advisory, and GPS-guided equipment applying water, fertilizer, and crop protection only where needed. See the technology section below for how this integrates with monitoring platforms.
- Cover Cropping: Planting clover, vetch, or rye between cash crops. ERS’s 2016 survey found 8.2% of corn and cotton acres carried a cover crop, and of those cover-cropped acres, 41.4% also used no-till — meaning cover crops and reduced tillage are frequently adopted together rather than separately.
- Integrated Pest Management (IPM): Combining scouting, biological controls, and targeted chemical applications to cut blanket pesticide use.
- Agroforestry and Shelterbelts: Tree lines integrated within or alongside fields for wind erosion control and biodiversity — common on Canadian Prairie and US Great Plains operations exposed to high wind erosion risk.
- Reduced Chemical Inputs: Cutting synthetic fertilizer and pesticide reliance through biofertilizers, organic amendments, and precision-targeted application informed by soil and canopy data.
Two of these seven — conservation tillage and cover cropping — are the only practices with a specific, sourced US adoption percentage as of this writing. The other five are widely recommended by USDA ERS and land-grant extension programs but lack a single national adoption statistic; treat any percentage you see quoted for rotation, IPM, agroforestry, or input reduction as a regional or study-specific figure, not a national one, and verify it against the specific source before repeating it.

Reading the Adoption Numbers Together
| Practice | Measured Adoption | Survey Period | Source |
|---|---|---|---|
| Cover crops on corn/cotton acres | 8.2% | 2016 | USDA ERS |
| Cover crop acres also under no-till | 41.4% | 2016 | USDA ERS |
| Corn acres, continuous no-till/strip-till | 18% | 2013–2016 | USDA ERS/NASS ARMS |
| Corn acres, alternating no-till with full tillage | 27% | 2013–2016 | USDA ERS/NASS ARMS |
Full methodology: USDA ERS EIB-197, Tillage Intensity and Conservation Cropping and the USDA ERS cover crop Chart of Note.
Sustainable Rotation Structure: A Working Example
A four-year broadacre rotation built around the practices above typically looks like this:
- Year 1: Corn or wheat (cash cereal)
- Year 2: Soybeans or another legume (restores soil nitrogen)
- Year 3: Wheat or barley
- Year 4: Cover crop (cereal rye or vetch) ahead of the next cash crop, under reduced tillage
This structure is what the 41.4% cover-crop/no-till overlap figure above reflects in practice — operations don’t typically add cover crops as an isolated add-on, they build them into a rotation that already uses reduced tillage. It also builds measurable carbon retention over successive seasons, which is increasingly relevant for carbon-program eligibility.
Cover Crop & No-Till Acreage Calculator
Use your own operation’s total acreage against the 2016 ERS national baseline (8.2% cover crop, 18% continuous no-till) to see how many acres you’d need to convert to match or beat the national adoption rate.
Run your own numbers
Assumptions: benchmarks are the 2016 USDA ERS national average for cover crops on corn/cotton acres (8.2%) and the 2013–2016 ARMS average for continuous no-till/strip-till on corn acres (18%) — both are national, not regional or crop-specific to your operation, and neither has been updated by USDA with a more recent national figure as of this writing. This tool does not account for soil type, climate zone, or crop mix; it is a benchmark comparison, not an agronomic recommendation.

Technology on the Modern Broadacre Farm
Digital tools have become the mechanism by which broadacre operations close the gap between the sustainable-practice targets above and actual field-level execution:
- Satellite imagery: Monitors crop vigor, soil moisture, and disease risk across large fields without physical scouting of every acre.
- AI and data-driven systems: Platforms such as Farmonaut’s large-scale farm and resource management convert imagery and sensor data into field-level action items for planting, spraying, and harvest timing.
- GPS-guided machinery: Precision seeding, fertilization, and spraying reduce overlap and input waste on large, irregular fields.
- Drones and remote sensing: Fast scouting for pest pressure and crop stress across acreage too large to walk each week.
- Traceability records: End-to-end documentation, increasingly required for premium and export grain contracts.
These tools also simplify access to loans or crop insurance by providing verified field data to lenders and insurers, and support the regulatory and carbon-accounting reporting that broadacre operations increasingly face.


Tip: Farmonaut’s fleet management solutions help large broadacre farms optimize tractor, sprayer, and harvester logistics — cutting fuel consumption and reducing idle machine time across multi-thousand-acre operations.
How Farmonaut Supports Broadacre Operations
Farmonaut’s platform is built around the specific data gaps that make broadacre sustainability hard to verify at scale:
- Real-time crop monitoring: Multispectral satellite imagery tracks field health, pest outbreaks, and soil moisture across every field in an operation, not just the ones a scout physically reaches each week.
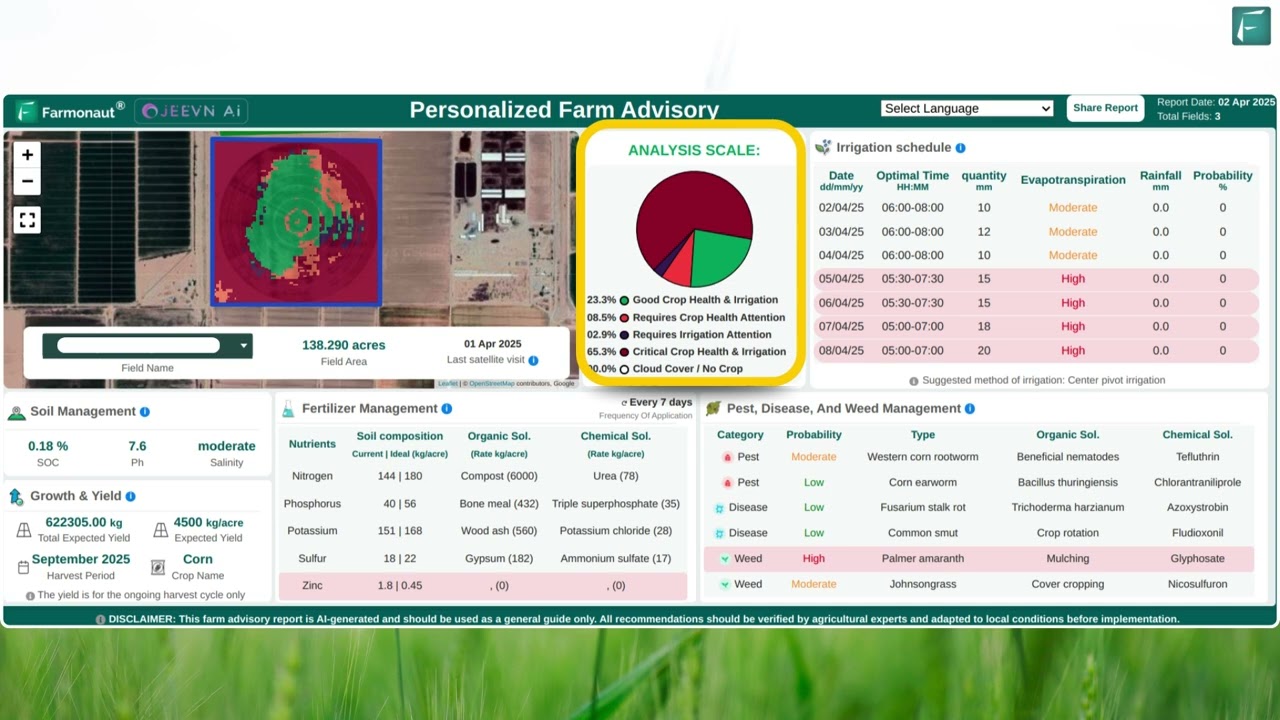
- Jeevn AI Advisory: Climate and agronomy insights that help operators plan rotations and time input applications against real field conditions rather than a fixed calendar.
- Traceability tools: Supports end-to-end product traceability, relevant for premium and certified grain contracts where buyers require documented provenance.
- Environmental impact monitoring: Carbon footprinting tools help operations document practice changes — like the shift toward no-till and cover cropping covered above — for carbon programs and buyer reporting.
- Resource and fleet management: Optimizes machinery deployment across large acreages, reducing fuel use and downtime.
- Developer access: The API and developer docs let agtech companies and enterprises integrate satellite and weather data directly into their own systems, and the same data layer is reachable via the Farmonaut API for automated, farm-scale reporting.
- Flexible access: Available via web app, Android, and iOS — see the download links at the top of this page.
All of this is available through a scalable subscription model built to keep satellite, AI, and traceability data affordable at broadacre scale.
FAQ
What is a broadacre farming example?
US corn, soybean, and wheat production are the clearest broadacre farming examples: USDA NASS reported 95.3 million acres of corn, 85.4 million acres of soybeans, and 42.7 million acres of all wheat planted in the US in 2026. Australia’s Wheatbelt, the Canadian Prairies, and Argentina’s Pampas run the same model on cereals, oilseeds, and pulses.
Farming is an example of what broader category?
Broadacre farming is an example of extensive, mechanized field-crop agriculture — as opposed to intensive horticulture (vegetables, orchards) or subsistence farming. The defining traits are large contiguous acreage, low labor input per acre, and a focus on cereals, oilseeds, and pulses.
What is broadacre farming, in one sentence?
It is large-scale, mechanized crop production — typically wheat, corn, soybeans, barley, or canola — grown across hundreds or thousands of acres with GPS-guided equipment and a small operating crew relative to the land area farmed.
What are examples of broad acre crops?
Corn, soybeans, wheat, barley, canola, and pulses (lentils, chickpeas, field peas) are the standard broad acre crops. In the US, corn and soybeans together covered 180.7 million acres in 2026 (95.3 million corn plus 85.4 million soybean, per USDA NASS).
Ejemplos de agricultura extensiva: what counts?
Agricultura extensiva ejemplos include the same crops and systems described throughout this page under their English name: mechanized corn, soybean, and wheat production across large tracts of land, with low labor and capital input per hectare or acre relative to intensive horticulture.
How much of US cropland uses no-till or cover crops?
USDA ERS/NASS ARMS data for 2013–2016 found 18% of corn acres under continuous no-till or strip-till and another 27% alternating reduced tillage with conventional tillage. A separate 2016 ERS survey found 8.2% of corn and cotton acres carried a cover crop, and 41.4% of those cover-cropped acres also used no-till. These are the most recent nationally representative figures ERS has published for these specific metrics.
What technologies are used on modern broadacre farms?
Satellite monitoring, AI-based agronomic advisory, GPS-guided precision equipment, drone scouting, and digital traceability systems are the core technology stack on broadacre operations moving beyond calendar-based management.
Where can I check current US crop acreage and yield figures?
USDA NASS publishes updated Acreage and Crop Production reports monthly at nass.usda.gov/Newsroom, with the next release due in October 2026. Historical and county-level figures are available anytime at quickstats.nass.usda.gov.
Further reading:
Conclusion
Broadacre farming is best understood through its numbers, not its adjectives: 95.3 million acres of corn, 85.4 million acres of soybeans, and 42.7 million acres of wheat planted in the US in 2026, against a national baseline where only 8.2% of corn and cotton acres carried a cover crop and 18% of corn acres ran continuous no-till as of the most recent USDA surveys. Those two gaps — between total broadacre acreage and the share under sustainable practice — are exactly what the seven practices above are meant to close, and exactly what the calculator lets you check for your own operation.
To track those figures as USDA updates them, bookmark NASS Newsroom for the monthly Acreage and Crop Production releases, and ERS Commodity Costs and Returns for annual per-acre cost data by crop and region.
Ready to put field-level data behind your own broadacre operation? Start with Farmonaut’s platform or connect your systems directly through the Farmonaut API.
Discussion
Questions, corrections or field experience? Share them below. First-time comments are reviewed before they appear, and your email is never published.
No comments yet. Be the first to add a question or your experience.

 Liquify Digital
 Ascentya
 CU Foods
 BeyondTech Global
 Rouge VC
 Yutz Automation
 AgroGreen Dynamics
 AgroRisk
 Oath Inc
 Reddane Farming
 Esri North East Africa
 Cresol
 Atur Kuliner
 MDCV UK
 Zerella Group
 Etech Consulting Madagascar
 Vestlandsforsking
 Delicio
 WB Dev
 Sama Premium
 Prochecker
 Tres Valles
 LACOS Geoinformation
 Magrifly
