

Reviewed August 2026 against the EPA’s Integrated Pest Management framework and USDA data (NASS chemical-use surveys, ARS precision-spraying trials).
Try it: Run your own numbers →
Table of Contents
- AI Pest Control in IPM: The Short Answer
- What Integrated Pest Management Actually Is
- 7 IPM Control Methods, Including AI-Based Monitoring
- Comparative Effectiveness Table for IPM Control Methods
- The 7 Working Principles of an IPM Program
- Pest Control Fleet Management: Calculating the Savings
- How Farmonaut Supports IPM Decision-Making
- Benefits of Integrated Pest Management
- Challenges in IPM Adoption
- Farmonaut Subscriptions
- FAQ: AI Pest Control & IPM
- Conclusion
- Try it: Run your own numbers
AI Pest Control in Integrated Pest Management: What Actually Works
AI pest control inside an IPM program means using satellite imagery, sensors, and threshold data to decide whether and where to intervene — not a robot that sprays on its own. In two published US trials, that shift alone cut pesticide or herbicide volume by 46–90%: a USDA Agricultural Research Service (ARS) laser-guided sprayer trial reported a 46–68% pesticide reduction, and an Iowa State University Extension field trial of John Deere’s See & Spray Ultimate system reported a 76% average herbicide reduction across five 2024 soybean fields. Judiciously applied, that’s the whole point of sustainable pest control: protect crops with the least input that still works, and only after monitoring says it’s needed.
This guide covers what the data actually shows for seven IPM control methods — including where AI and satellite monitoring fit and where they don’t — how to think about pest control fleet management costs, and the seven working principles auditors and extension programs use to judge whether an IPM plan is real or just a label.




What Integrated Pest Management Actually Is
The US EPA defines IPM as a four-step decision framework, not a single technique: set an action threshold (the pest level that justifies acting), monitor and identify pests accurately, apply prevention first (crop rotation, resistant varieties, sanitation), and only then choose a control method — starting with the least-risky option and moving toward broadcast chemical treatment as a last resort, not a first one. AI and satellite tools slot into the first two steps: they make thresholds measurable across a whole field instead of a few scouted spots, and they make monitoring near-continuous instead of a weekly walk.
- Prevention: Reduce the likelihood of infestation before it starts, using crop rotation, resistant varieties, and cultural practices.
- Monitoring: Observe and identify pest populations through routine scouting plus sensor or satellite data.
- Thresholds: Set the economic injury level — the pest density at which treatment cost equals expected crop-loss cost — and act only past that point.
- Control: Combine biological, physical, cultural, and chemical methods, in that order of preference, for long-term management rather than a one-time kill.
How close is US agriculture to actually running that four-step loop, rather than just spraying on a calendar? The USDA National Agricultural Statistics Service’s 2023 Fruit Chemical Use Survey, covering 21 fruit crops and released July 17, 2024, found scouting is nearly universal but threshold-based decision-making lags well behind it — the exact gap AI monitoring is built to close.
Key Terms in IPM
- Sustainable pest control — reducing long-term health and environmental impact of pest management.
- Biological control in integrated pest management — using predators, parasitoids, or pathogens as natural pest suppressors instead of, or alongside, chemistry.
- Economic Injury Level (EIL) — the pest density at which treatment cost equals expected crop-loss cost.
- Crop rotation for pest management — alternating crops to break pest life cycles.
- Environmentally friendly pest control — methods chosen to protect beneficial organisms and limit off-target pollution.
7 IPM Control Methods, Including AI-Based Monitoring
Each of the seven methods below answers the practical question every grower is really asking — how to get rid of them with the least cost, the least risk, and the least collateral damage to beneficial insects. None works alone; IPM is the sequencing of all seven, not a pick-one menu.
1. Crop Rotation for Pest Management
Alternating crops in the same field breaks the life cycle of pests that depend on one host. Following maize with legumes interrupts corn borer cycles and suppresses nematode populations, while also rebuilding soil fertility between seasons. No chemical input is required, and the benefit compounds over multiple seasons rather than one.
2. Biological Pest Control Methods
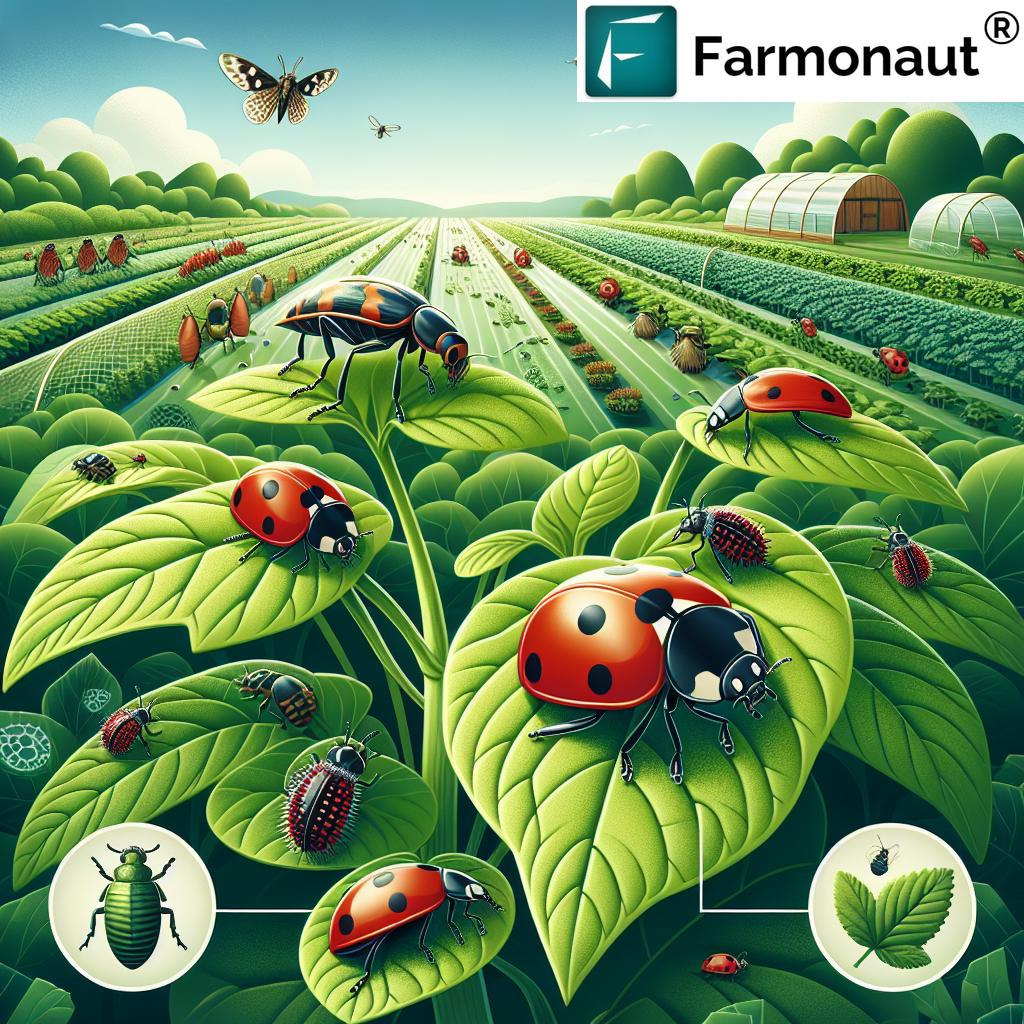
Introducing beneficial organisms — ladybugs, predatory mites, parasitic wasps, Trichoderma fungi — gives season-long, target-specific suppression without off-target chemical exposure. Predatory mites released against spider mites in vegetable crops are a standard example. Biological control and integrated pest management work together specifically because biocontrol agents need the reduced-spray environment IPM creates to survive; heavy broadcast spraying kills the predators along with the pests.
3. Cultural Practices That Prevent Pests
Planting date, row spacing, field sanitation, and irrigation timing all change how favorable a field is to a pest before it ever arrives. Shifting a planting window so the crop’s vulnerable growth stage misses a pest’s peak emergence is a zero-cost, zero-chemical intervention that many growers underuse simply because it requires forecasting, not spraying.
4. Physical & Mechanical Pest Barriers
Traps, pheromone lures, sticky cards, row covers, and manual removal of infested tissue exclude or remove pests directly. These are the fastest first-line defense in greenhouses, nurseries, and high-value horticulture, where a single infested plant can be pulled before a colony establishes.
5. Genetic Resistance — Resistant Varieties
Pest- or disease-resistant cultivars use the plant’s own defenses instead of an applied one. The trade-off is real: resistance genes bred for one region’s dominant pest strain may not hold up against a different local population, so land-grant extension variety trials for the grower’s own state or county are the right way to confirm a cultivar actually resists what’s in that specific field.
6. Chemical Control With Precision & Minimal Impact
In IPM, pesticides are the last method applied, not the first, and they’re applied judiciously — right product, right rate, right timing, based on the threshold data from step two. A selective insecticide for fall armyworm is used only once trap counts cross the established action threshold, and active ingredients are rotated between applications specifically to delay resistance buildup in the pest population.
7. AI Pest Control: Satellite & Predictive Monitoring
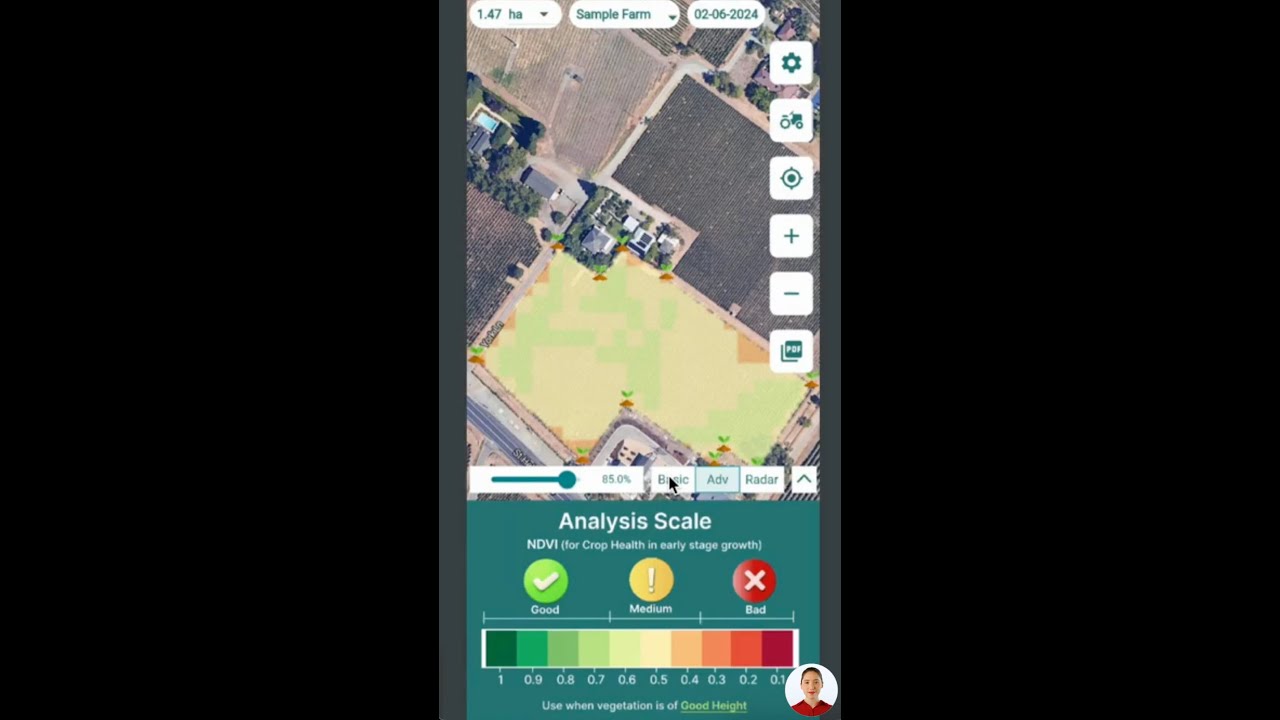
This is where AI pest control actually lives inside IPM: multispectral satellite imagery and NDVI (vegetation-health) analysis flag stressed zones inside a field before visible wilting appears, letting a scout or an automated sprayer go to the exact spot instead of the whole field. Two independently reported US trials quantify what that targeting is worth. USDA ARS’s laser-guided variable-rate sprayer, tested at commercial ornamental nurseries in Ohio, Oregon, and Tennessee, cut pesticide use by 46–68% with average savings of $230 per acre for ornamental nurseries — USDA ARS reports savings can run higher for orchard and fruit production. In August 2024, Iowa State University Extension’s field-scale demonstration of John Deere’s See & Spray Ultimate on five conventionally managed soybean fields totaling 415 acres cut herbicide product use by an average of 76% (individual fields ranged from 43.9% to 90.6%), for a combined economic savings of roughly $6,500, or $15.7 per acre — Iowa State University Extension has the full field-by-field breakdown.
Comparative Effectiveness Table for IPM Control Methods
No AI Overview can hand you this side-by-side: published pest-damage-reduction ranges, relative environmental impact, and relative cost across all seven methods, in one table.
| Method | Description | Method Type | Pest Damage Reduction (Est. Range) | Environmental Impact | Relative Cost | Example |
|---|---|---|---|---|---|---|
| Crop Rotation | Alternating crops to disrupt pest life cycles | Cultural | 40–70% | Low | Low | Maize/legume rotation |
| Biological Control | Natural predators or microbes introduced to curb pests | Biological | 50–85% | Low | Medium | Predatory mites in vegetables |
| Cultural Practices | Planting date, spacing, sanitation, irrigation timing | Cultural | 30–60% | Low | Low | Row crops, orchards |
| Physical/Mechanical | Traps, barriers, manual removal | Physical | 35–80% | Low | Low–Medium | Greenhouse, nursery crops |
| Resistant Varieties | Cultivars bred for pest/disease resistance | Genetic | 60–90% | Low | Medium | Extension-trialed cultivars |
| Chemical (IPM-guided) | Targeted, threshold-triggered pesticide use | Chemical | 60–95% | Medium–High | Medium | Cotton, maize, soybeans |
| AI/Satellite Monitoring | Satellite, sensor, or AI-driven detection and variable-rate spraying | Technological | 46–90.6% reduction in applied volume (measured) | Low | Medium | ARS & Iowa State trials above |
The 7 Working Principles of an IPM Program
Extension programs and auditors judge a real IPM plan against seven working principles, not against a single spray decision. Here’s how each functions in practice:
1. Soil Preparation
Tillage timing, residue management, and soil health directly affect which soil-borne pests and pathogens carry over between seasons. Clean seedbeds and balanced fertility reduce the plant stress that makes crops more attractive to pests in the first place.
2. Planting
Planting date, seed spacing, and cultivar choice (including resistant varieties) are decided before a pest problem exists — the cheapest point in the season to prevent one.
3. Forecasting
Degree-day models, weather data, and pest-lifecycle timing predict when a pest is likely to emerge or peak, so scouting and any intervention are timed to the pest’s biology rather than the calendar.
4. Thresholds
The action threshold — set below the economic injury level, with enough margin to act before damage is irreversible — is the trigger that separates IPM from calendar spraying. NASS’s 2023 fruit-crop data above shows only 58% of surveyed acres actually compared scouting counts to a published threshold before treating; the rest were reacting to sightings, not thresholds.
5. Pest Trapping
Sticky traps, pheromone lures, and light traps generate the population counts that feed both forecasting and threshold decisions — trapping is the data-collection layer the other principles depend on.
6. Recordkeeping
Logging pest counts, treatment dates, products used, and outcomes across seasons is what lets a threshold or a resistant-variety choice actually improve over time, and it’s what regulators and certification programs ask to see as proof an IPM plan is being followed, not just written down.
7. Low-Risk Pesticides
When chemical control is warranted, IPM principle seven calls for the most targeted, lowest-toxicity, shortest-persistence product that still hits the threshold-crossing pest — selected and rotated to protect both non-target organisms and the pesticide’s own future effectiveness.

Pest Control Fleet Management: Calculating the Savings
“Pest control fleet management” is really a cost question: how much does routing sprayers by field-level threshold data, instead of blanket-treating every acre, actually save across a season and across a fleet of machines? The Iowa State trial above gives a real answer for one crop and one system — an average 76% cut in herbicide volume, translating to roughly $15.7 per acre. Turning that into a fleet-wide number means applying it to a grower’s own acreage, current chemical spend, and sprayer count, because those three inputs vary field to field. Farmonaut’s fleet management module is built for that routing layer — combining satellite field data with vehicle and applicator tracking so a fleet spends its spray time on the acres that actually crossed a threshold.
Use the figures above to size the savings for your own fleet before committing budget to precision equipment or a monitoring subscription:
Run your own numbers
Assumes the reduction percentage you enter applies uniformly across all treated acres and does not account for equipment financing, maintenance, or labor retraining costs. It also does not model yield effects — the trials above reported input savings, not yield outcomes.
How Farmonaut Supports IPM Decision-Making
The monitoring and threshold layers of IPM are exactly where satellite platforms add measurable value. Farmonaut provides:
- Satellite-Based Crop Health Monitoring: Multispectral imagery and NDVI analytics surface stress zones and pest/disease hotspots before they're visible on the ground, so scouting and any control action target the actual affected area.
- AI-Driven Advisory: The Jeevn AI Advisory System delivers crop-specific management timelines and weather forecasts that support forecasting and threshold-timing decisions.
- Blockchain-Based Traceability: Farm-to-fork traceability documents input and pest-control-measure use for supply chains and buyers that require it.
- Carbon Footprinting: Carbon footprinting tools track emissions from on-farm activity, including pest-control operations.
- Fleet & Resource Optimization: Fleet management routes application equipment to threshold-flagged acres, cutting fuel use alongside chemical use.
These tools are available on web, Android, and iOS, or by direct API integration: the Farmonaut API and developer docs let a farm's own software pull the same satellite and weather layers directly.
For multi-field or plantation-scale operations, the agro-admin app and the crop, plantation & forest advisory platform extend the same monitoring across many fields at once. And where pest damage or IPM compliance affects financing, crop loan and insurance verification uses the same satellite record as objective, third-party field evidence.

Benefits of Integrated Pest Management
- Economic Efficiency: Threshold-triggered spraying, per the NASS and precision-spraying data above, cuts input cost without waiting for damage to become visible.
- Environmental Protection: Lower off-target chemical volume means less pressure on pollinators, waterways, and soil biology.
- Human Health: Judicious chemical use lowers exposure risk for applicators, farmworkers, and downstream consumers.
- Resistance Management: Rotating modes of action and control types — already at 70% adoption per NASS's fruit-crop data — slows the pest resistance that erodes chemical tools over time.
- Traceability: Digital recordkeeping (principle six) plus blockchain traceability gives export and premium markets an auditable pest-control history.
Challenges in IPM Adoption
IPM adoption faces three recurring obstacles in practice:
- Knowledge & Training: Accurate pest identification and threshold calculation require ongoing training — misidentifying a beneficial insect as a pest is a common, costly error.
- Access to Resources: Resistant seed lines, specialist advisers, or monitoring equipment aren't uniformly available by region; a grower in one county may have extension access another doesn't.
- Upfront Cost: Biological controls and precision-spraying equipment carry a higher initial cost than a broadcast sprayer, even though the data above shows the payback period is typically one to two seasons at reported reduction rates.
Farmonaut Subscriptions
Farmonaut's advisory and monitoring plans scale from a single field to a multi-field operation.
FAQ: AI Pest Control & IPM
What is AI pest control in an IPM program?
It's the use of satellite imagery, sensors, or AI-based image recognition to detect pest pressure or crop stress and decide where thresholds have been crossed — feeding IPM's monitoring and threshold steps, not replacing the decision to act. In cited US trials, pairing that detection with variable-rate sprayers cut pesticide/herbicide volume by 46–90.6%.
Is IPM the same as pest control fleet management?
No — fleet management is the logistics layer (which sprayer goes to which field, when), while IPM is the decision framework (whether that field needs treatment at all). They combine when threshold or satellite data is used to route the fleet only to acres that actually need it.
What is an Economic Injury Level (EIL)?
The pest population density at which the cost of the damage equals the cost of the control measure. The action threshold is set below the EIL, with margin for the time it takes to act.
Does biological control work inside a heavily sprayed field?
Not reliably — broadcast chemical use kills predators and parasitoids along with the target pest. Biological control performs best in IPM programs that have already reduced overall spray frequency through thresholds and prevention.
Can IPM eliminate pesticides entirely?
Full elimination isn't the design goal. IPM's own control hierarchy places chemical treatment last, used only once biological, cultural, and physical controls plus thresholds have been applied — the reduction is large (46–90.6% in the trials cited above) but not necessarily to zero.
How do I get rid of them without over-spraying?
Identify the pest correctly, check its count against a published threshold for that crop and region, and start with the least-disruptive method that will work at that population level — trapping or biological control before chemical control, per the seven-principle order above.
How does Farmonaut support IPM strategies?
Through satellite-based NDVI monitoring, AI-driven advisories, fleet routing, and blockchain traceability — supporting the monitoring, threshold, and recordkeeping principles of an IPM program. Details are in the section above.
Where can I get started with Farmonaut?
The Farmonaut app is available on Android, iOS, and web, or via this link.
Conclusion
IPM's four-step framework hasn't changed — threshold, monitor, prevent, control, in that order — but what's changed is how cheaply the monitoring step can now be done at field scale. USDA's own fruit-crop survey shows scouting is already near-universal (98%); the gap is in acting on thresholds rather than sightings, and that's precisely the gap satellite and AI monitoring close. The published numbers are specific enough to plan against: a 46–68% pesticide cut from ARS's laser-guided sprayer, a 76% average herbicide cut from Iowa State's 2024 field trial, and a real dollar figure — roughly $15.7 per acre — attached to it.
None of the seven methods above works in isolation, and none of them is a substitute for accurate pest identification and honest recordkeeping. Applied together, in the sequence IPM prescribes, they protect crops with less chemical input than calendar spraying ever did — and the data to prove it, cited above, is checkable by anyone.

 Sun Palm Australia
 Grandstream Algérie
 XOS Realty
 Geospatial Lab Africa
 KhetiBuddy
 Agro La Gándara
 HIPSAC
 ZOL Zimbabwe
 Juligerm
 AdBio
AdBio MISE Maroc
 NWNS
NWNS Red August Group
 Farm Inc
 WeMe Global
 Agrotoken
 Blue BearX
 Insignito
 Croptimum
 DnCubed
