

Farm systems · Explainer
12 Types of Agriculture: Examples With US Farm Numbers
The 12 types of agriculture are subsistence, cash-crop, mixed, intensive, organic, agroforestry, conservation, precision, permaculture, livestock, protected and aquaculture. Each has a US example below, with a dated USDA number where one exists.
Key takeaways
- Many farms combine several of the 12 types; USDA counts practices, not labels.
- In 2024, small family farms were 86% of US farms but made 17% of production value (USDA ERS).
- Conservation tillage covered 65% to 70% of corn, wheat and soybean acres in the surveys behind a 2018 ERS chart.
- Only 43% of US farms had positive net cash farm income in 2022 (USDA NASS).
- Use Quick Stats to check any figure; the figures here are dated.
In this article
- The 12 types of agriculture at a glance
- How US farms divide up by size
- 1. Subsistence farming
- 2. Commercial cash-crop farming
- 3. Mixed farming
- 4. Intensive farming
- 5. Organic farming
- 6. Agroforestry and silvopasture
- 7. Conservation agriculture
- 8. Precision agriculture
- 9. Permaculture
- 10. Livestock and grazing systems
- 11. Protected-environment and hydroponic farming
- 12. Aquaculture
The 12 types of agriculture are subsistence, commercial cash-crop, mixed, intensive, organic, agroforestry, conservation, precision, permaculture, livestock and grazing, protected-environment (greenhouse and hydroponic) and aquaculture farming. Farms do not sit in one box. Many farms combine several of these systems, and the US census counts practices rather than labels.
This guide gives each type a plain definition and a US example, with a dated government number wherever USDA publishes one. It also shows how farm size relates to output, and ends with a calculator that sorts your own farm into a USDA size class.
The 12 types of agriculture at a glance
Use this list to find the type you need, then read its section below.
- Subsistence: food grown mainly for the household, not for sale.
- Commercial cash-crop: large areas of corn, soybeans, wheat or cotton grown for sale.
- Mixed: crops and livestock on one holding.
- Intensive: high output per acre from heavy inputs.
- Organic: certified production without synthetic fertilizer or pesticide.
- Agroforestry: trees grown with crops or grazing animals.
- Conservation: less tillage, living cover and varied rotations.
- Precision: sensors, GPS and satellites guide where inputs go.
- Permaculture: a design method built on perennial, layered systems.
- Livestock and grazing: animals raised on pasture and range.
- Protected-environment: greenhouses, tunnels and soilless growing.
- Aquaculture: fish, shellfish and other water animals raised on farms.
Twelve is a teaching convention, not a legal list. USDA does not sort farms by type of farming. It sorts them by gross cash farm income and by main commodity, and it counts practices such as no-till or agroforestry on their own.
How US farms divide up by size
The 2022 Census of Agriculture counted 1.9 million farms and ranches on 880 million acres, an average of 463 acres each. That was down 7% in farm numbers from 2017 (USDA NASS, released 13 February 2024). A farm in this census is any place that sold, or normally would have sold, at least $1,000 of agricultural products in the census year (USDA NASS census FAQ).
Chart
Farm numbers and farm output by size class
Percent of US farms and of value of production, 2024; family-farm classes shown
Farm counts and farm output sit in very different places. USDA’s Economic Research Service sorts farms by gross cash farm income, or GCFI. In 2024, small family farms (GCFI under $350,000) were 86% of US farms, worked 40% of agricultural land and produced 17% of the value of production. Large-scale family farms (GCFI of $1 million or more) were 5% of farms, worked 33% of the land and produced 50% of the value (USDA ERS, 2024 data).
Other markets look different. The EU had 8.8 million farms in 2023, and 62.8% of them were under 5 hectares (Eurostat, 2023). Canada’s 2021 census counted 189,874 farms on 153.7 million acres (Statistics Canada, 2021 Census of Agriculture).
1. Subsistence farming
Subsistence farming produces food mainly for the farm household, with a mix of crops, a few animals and few bought inputs. The United States does not report it as a category. The closest US match is likely the small, part-time or retirement farm, but USDA does not report subsistence farming as a category.
Only 43% of the 1.9 million farms counted in 2022 had positive net cash farm income. The other 57% broke even or lost money on the farm itself. Average farm income was $79,790, a mean pulled up by the largest farms (USDA NASS, 2022 Census). Many farm households rely mainly on off-farm income (USDA ERS, 2026 forecast).
2. Commercial cash-crop farming
Cash-crop farms grow large areas of a few marketable crops, such as corn, soybeans, wheat, cotton and rice, for processors, exporters and grain buyers. US farms sold $543 billion of agricultural products in 2022, up from $389 billion in 2017, against production expenses of $424 billion (USDA NASS, 2022 Census).
Sales are concentrated. The 105,384 farms with sales of $1 million or more were 6% of US farms and held 31% of farmland. Looking ahead, USDA ERS forecast net farm income of $158.4 billion for calendar year 2026, down $4.3 billion (2.6%) from 2025 in nominal dollars, and net cash farm income of $176.4 billion (USDA ERS forecast, updated 3 September 2026). The forecast is revised several times a year, so check it before you quote it.
3. Mixed farming
Mixed farms grow crops and keep livestock on the same holding. Manure goes back to the fields, and crop residue or by-products can feed the animals. The classic US example is the Upper Midwest farm that grows corn and raises hogs or dairy cows.
The case for mixing is steadier income when the two enterprises have different price cycles. The challenge is timing. Manure supply and residue supply have to line up with planting dates. The US census has no “mixed” class, so you find these farms by their practices in the data.
▶ Six benefits of mixing crops and animals on one farm, explained simply. · 2:55
4. Intensive farming
Intensive farming aims for high output per acre through fertilizer, crop protection, irrigation and machines. The cost side shows the trade-off: in 2022, US production expenses of $424 billion equalled about 78% of the $543 billion value of products sold (USDA NASS, 2022 Census). Production expenses cover all costs (feed, labor, rent, interest and more), not only fertilizer and crop protection, so this ratio is a rough guide to how much of each sales dollar is spent, not a measure of intensity.
Fertilizer and crop-protection products are regulated. Follow the product label and local rules, and ask your state extension service or a certified adviser before changing rates.
5. Organic farming
Organic farms are certified to grow without synthetic fertilizers or most synthetic pesticides. They rely on rotation, compost, cover crops and biological pest control. In the 2011 to 2021 period, certified organic cropland rose 79% to 3.6 million acres, pasture and rangeland fell 22% to 1.3 million acres, and certified operations reached 17,445 in 2021 (USDA ERS, Organic Agriculture).
Later numbers come from a market tracker, not USDA. Argus data cited by ERS put total certified organic acreage at 7.2 million acres in 2025 (a broader total than the NASS cropland and pasture figures above, so the two are not a like-for-like trend), down about 9% from 2024, with roughly 17,181 certified operations. USDA says it has no official organic retail sales statistics. Trade-group figures cited by ERS estimate US organic food sales at $70.1 billion in 2025 (Organic Trade Association, 2026), compared with $39.6 billion in 2012 in 2025 dollars.
6. Agroforestry and silvopasture
Agroforestry puts trees on purpose into crop or grazing systems. USDA counts five practices: windbreaks, silvopasture, riparian forest buffers, alley cropping, and forest farming with multi-story cropping (USDA NASS Agroforestry Survey).
US use is small and rising slowly. A USDA Forest Service analysis of the census found 32,717 farm operations with agroforestry in 2022, up 6% from 30,853 in 2017. Vermont led at 7.8% of farms, then Maine at 6.0% and New Hampshire at 5.6%. Arizona was lowest at 0.3% (USDA Forest Service, Agroforestry Systems, 2025).
7. Conservation agriculture
Conservation agriculture means minimum tillage, soil that stays covered and a varied rotation. USDA ERS reports conservation tillage on 70% of soybean acres, 67% of wheat, 65% of corn and 40% of cotton, based on the most recent surveys when the chart was published in September 2018 (USDA ERS, conservation tillage). No-till alone covered 45% of wheat acres and 40% of soybean acres.
Chart
Share of acres in conservation tillage by crop
Percent of planted acres, most recent surveys as of the September 2018 chart
Staying with it is harder than starting. Almost 50% of corn, soybean, wheat and cotton acres were in no-till or strip-till at some point in a four-year window, but only about 20% stayed in no-till or strip-till in all four years.
Cover crops are still a small share of cropland. Cover-crop acres rose 17%, from 15,390,674 in 2017 to 17,985,831 in 2022, which was 4.7% of US cropland. Texas added the most acres, while some eastern states, including Maryland and Georgia, fell (USDA ERS census analysis).
▶ Seven simple ways to protect soil and water, from cover crops onward. · 4:34
8. Precision agriculture
Precision agriculture uses GPS, sensors, satellites and variable-rate machines so inputs go where the field needs them. Use rises with farm size. In 2023, guidance autosteering was used on 52% of midsize farms and 70% of large-scale crop farms, and yield monitors, yield maps or soil maps were used on 68% of large-scale crop farms. Small family farms had the lowest adoption in every technology group (USDA ERS, published December 2024).
Chart
Precision tools rise with farm size
Percent of farms using each tool, 2023
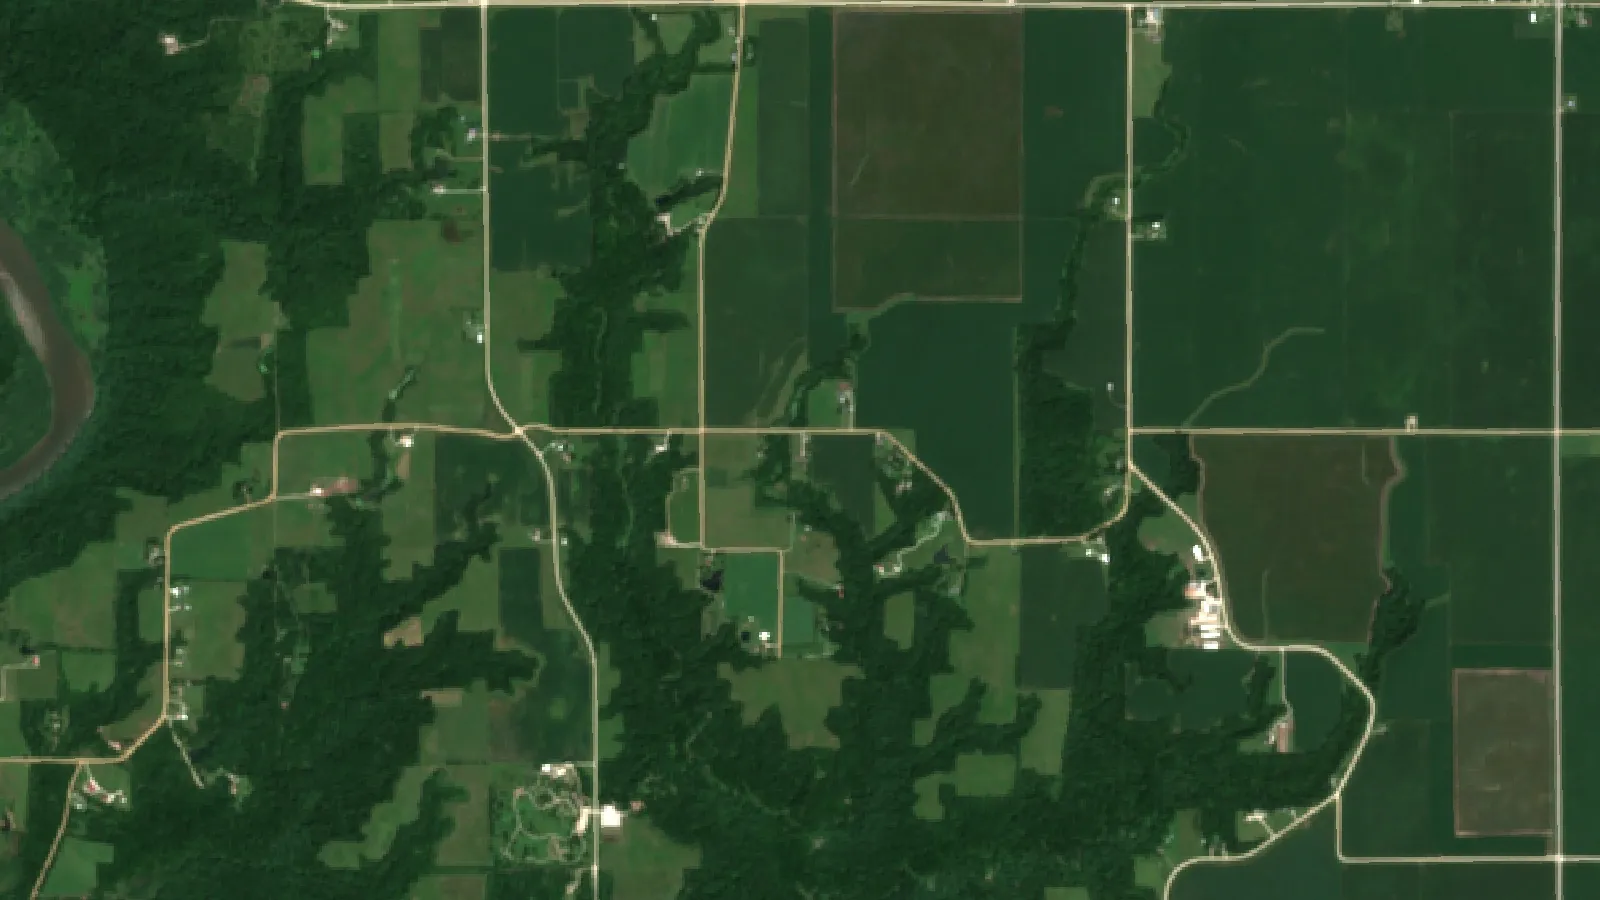
The reasons farmers gave for adopting these tools were mainly to raise yields, save labor, cut input costs, reduce fatigue and improve soils. Satellite monitoring is one way in that needs no machine purchase. A service such as Farmonaut’s Satellite + AI Farm Monitoring System shows how vegetation changes across a field over time. It shows where to look, but not the cause, so you still need to scout.

▶ Six plain steps to start precision agriculture without buying a robot. · 4:18
9. Permaculture
Permaculture is a design method: zoned layouts, perennial plants grown together, water caught in swales and ponds, and parts of the farm that feed each other. USDA has no permaculture category, so there is no national acreage. That is a real gap, and we do not fill it with a guess.
Direct selling is a loose proxy at best, because permaculture farms are only a small, unknown part of it. In 2022, 116,617 US farms sold directly to consumers, with sales of $3.3 billion, up 16% from 2017 (USDA NASS, 2022 Census). That works out at about $28,300 per farm. It covers all direct-selling farms, not only permaculture ones.
10. Livestock and grazing systems
Livestock farms raise ruminants on pasture and range, plus poultry and hogs. The 2022 census put the average US beef cow herd at about 47 head. Operations with 100 or more beef cows were 10.5% of beef operations and held 60.5% of the beef cow inventory (USDA ERS, Cattle and Beef).
Chart
US cattle and calf inventory
Million head, selected years
The national herd moves in cycles. It stood at 88.2 million head in 2014, peaked at 94.7 million in 2019 and was 86.2 million on 1 January 2026 (USDA NASS), 9% below the peak. NASS publishes cattle inventory twice a year, so look up the newest figure in Quick Stats before you use it.
11. Protected-environment and hydroponic farming
Greenhouses, high tunnels and soilless systems grow tomatoes, leafy greens, berries and herbs for much of the year. NASS runs a separate Census of Horticultural Specialties, with a 2024 edition, which is the place to look for greenhouse and nursery sales by state (USDA NASS, 2024 Census of Horticultural Specialties).
Pull your own state’s table there rather than relying on a summary. Check the horticulture census tables for the numbers; this page does not give a sourced figure for these farms.
12. Aquaculture
Aquaculture raises fish, shellfish and other water animals in ponds, raceways, tanks or coastal leases. US sales reached $1.9 billion in 2023, up 26% from 2018, across 3,453 farms with sales, up 18%. Average sales were $552,569 per farm. Mississippi, Washington, Louisiana, Florida and Alabama together made 55% of sales. Catfish sales of $480.0 million were 59% of food fish sales, and oyster sales of $327.0 million were 57% of mollusk sales (USDA NASS, 2023 Census of Aquaculture, released 16 December 2024).
Comparison table: all 12 types with their US numbers
Each row has the figure, the year it describes and where a newer one will appear.
| Type | US number and year | Typical setting (general, not from the sources) | Source |
|---|---|---|---|
| Subsistence | No US category; 43% of farms had positive net cash income (2022) | Small and part-time farms | NASS Census |
| Cash-crop | $543bn sales; 6% of farms hold 31% of land (2022) | Corn Belt, Plains, Delta | NASS Census |
| Mixed | Counted by practice, not by type | Upper Midwest | Quick Stats |
| Intensive | $424bn production expenses (2022) | Irrigated West, Corn Belt | NASS Census |
| Organic | 17,445 operations (2021); about 7.2m acres (2025, Argus) | Spread across states | ERS Organic |
| Agroforestry | 32,717 operations, up 6% on 2017 (2022) | Vermont 7.8%; Arizona 0.3% | Forest Service |
| Conservation | 70% soy, 67% wheat, 65% corn acres in conservation tillage (2018 chart) | Row-crop regions | ERS tillage |
| Precision | Autosteer on 70% of large-scale crop farms (2023) | Rises with farm size | ERS precision |
| Permaculture | Not counted; 116,617 direct-selling farms (2022) | Near city markets | NASS Census |
| Livestock | 86.2m cattle (1 Jan 2026); average herd 47 cows (2022) | Plains, Southeast, West | ERS Cattle |
| Protected | Reported in a separate horticulture census (2024) | Near urban markets | NASS Horticulture |
| Aquaculture | 3,453 farms, $1.9bn sales (2023) | MS, WA, LA, FL, AL: 55% of sales | NASS Aquaculture |
Where would your farm sit?
Enter your acres and your gross cash farm income to see which USDA size class you fall into and how your income per acre compares with the national reference. The values below are examples only.
Try the numbers for your own farm below.
Calculator
Which USDA size class would my farm fall into?
Enter your own acres, sales and other farm income; the values shown are examples.
- Size class (0 small, 1 midsize, 2 large): 1
- National reference per acre: $617
- Your income vs reference: 162.1%
- Income still needed for large-scale class: $600,000
Example values only, not a benchmark or forecast. Size-class cut-offs are USDA ERS gross cash farm income (GCFI) thresholds of US$350,000 and US$1,000,000 (ERS, 2024). The US$617 per acre reference is 2022 value of products sold (US$543bn) divided by 880 million acres of farmland (USDA NASS 2022 Census); it mixes cropland with pasture and excludes costs, so it measures scale, not profit. GCFI also includes government payments and other farm-related income.
How to check any of these numbers yourself
Every figure above will be replaced by a newer one. This five-step method will still work.
- Open Quick Stats. USDA NASS Quick Stats lets you query by commodity, place and year, down to county level for many series.
- Match the vintage. The Census of Agriculture runs once every five years, cattle reports come twice a year and the farm income forecast is revised several times a year. Do not compare a census figure with a survey estimate.
- Check the threshold. A census “farm” sold, or normally would sell, at least $1,000 of products. A different cut-off gives a different share.
- Separate government data from trade data. Organic retail sales come from a trade group, not USDA. Label them that way.
- Check your own fields. National averages say little about one field. Satellite images over several seasons show how your own block behaved.
FAQ
How many types of agriculture are there?
Twelve is the standard teaching set used on this page, but it is a convention. USDA sorts farms by gross cash farm income and main commodity, and it counts practices such as no-till, cover crops and agroforestry separately.
Which type of farming is most common in the United States?
USDA does not rank the 12 types by farm count. By size class, small family farms are the largest group at 86% of farms in 2024 (USDA ERS). Among practices, conservation tillage was used on a majority of corn, wheat and soybean acres (65% to 70%) in the surveys behind a 2018 ERS chart.
Can these farming types be combined?
Yes, and they usually are. A Corn Belt farm can be cash-crop, conservation and precision at the same time. A New England farm can be organic, agroforestry and direct-selling together. Agroforestry operations are counted by practice (windbreaks, silvopasture and others), and USDA reports them alongside ordinary crop and livestock farms.
Which type is most profitable?
USDA does not publish a profit ranking by type of farming. It does show that only 43% of farms had positive net cash farm income in 2022, and that the 5% of farms that are large-scale family farms produced 50% of the value in 2024. USDA publishes income by size class, not by type of farming, so this page cannot compare systems. For tax or loan decisions, get professional advice.
Where can I find the definitions for school or college work?
Use the USDA page named in each section above. The NASS Agroforestry Survey and the ERS tillage and precision-agriculture pages are the definitions the statistics are built on, which makes them stronger citations than a general encyclopedia entry.
Related pages on our site
More reading on the topics above: fleet management, large-scale farm management tools, product traceability, crop loan and insurance checks, carbon footprint tracking, satellite and weather API documentation, field monitoring apps, satellite field monitoring and a satellite data API.
Farmonaut crop monitoring
See your own fields from space
Check how your own fields change from season to season with satellite images.




Keep reading
Sources
- USDA NASS, 2022 Census of Agriculture data release (13 Feb 2024): nass.usda.gov
- USDA NASS, Census of Agriculture FAQ: nass.usda.gov
- USDA NASS, 2023 Census of Aquaculture release (16 Dec 2024): nass.usda.gov
- USDA ERS, Small family farms chart of note (2024): ers.usda.gov
- USDA ERS, Conservation tillage chart of note: ers.usda.gov
- USDA ERS, Cover crops census analysis (2024): ers.usda.gov
- USDA ERS, Precision agriculture use (Dec 2024): ers.usda.gov
- USDA ERS, Organic Agriculture: ers.usda.gov
- USDA ERS, Cattle and Beef sector at a glance: ers.usda.gov
- USDA ERS, Highlights from the farm income forecast (updated 3 Sep 2026): ers.usda.gov
- USDA Forest Service, Agroforestry across the United States (2025): research.fs.usda.gov
- USDA NASS, Agroforestry Survey: nass.usda.gov
- USDA NASS, 2024 Census of Horticultural Specialties: nass.usda.gov
- USDA NASS, Quick Stats: quickstats.nass.usda.gov
- Eurostat, Farms and farmland in the European Union (2023): ec.europa.eu
- Statistics Canada, 2021 Census of Agriculture: www150.statcan.gc.ca
Discussion
Questions, corrections or field experience? Share them below. First-time comments are reviewed before they appear, and your email is never published.
No comments yet. Be the first to add a question or your experience.

 Sayaji Group
 eKGIS
 Mostas Tech
 Native Seeds
 Andex
 FCF India
 Unifrutti Gulf
 Deluxe Conseil
 TVS Electronics
 BW Pipelines
 WICO
 Chimera Innovation
 SkyHarvest
 Polaris Digitech

 Licence holder · Niger · Gold










