Introduction
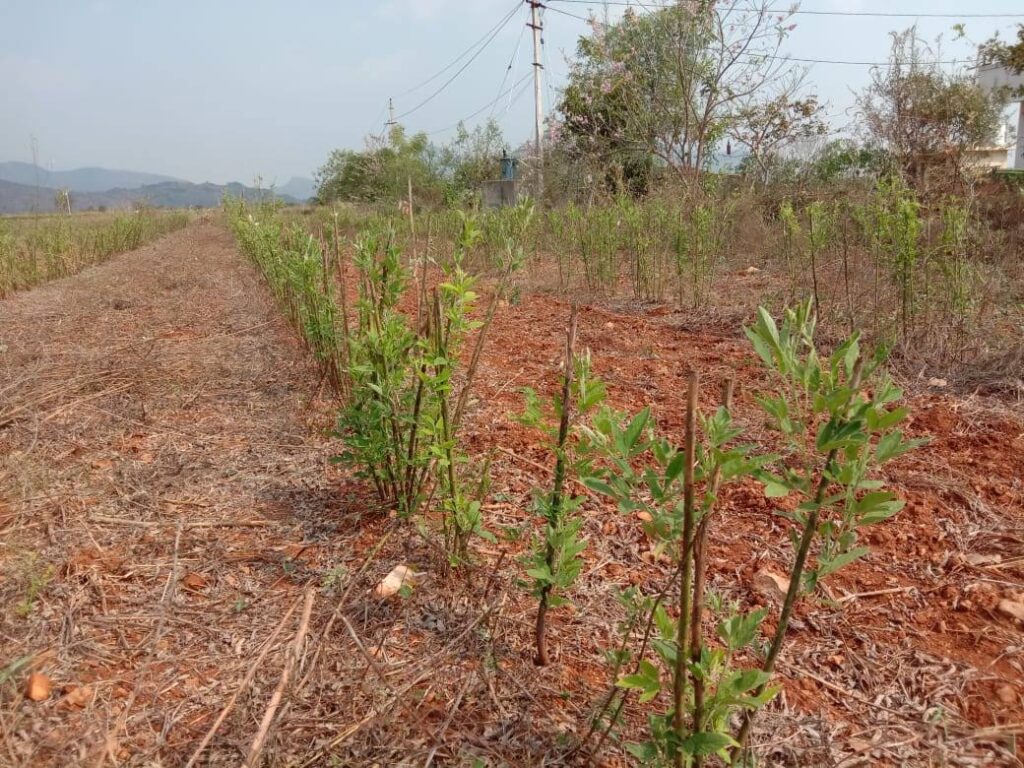
Soybean, a high value oilseed crop, is predominantly grown in the rainfed agro-ecosystem of central and peninsular India. Accurate and up-to-date assessment of the spatial distribution of soybean cultivated area is a key information required to understand the crop under sown.
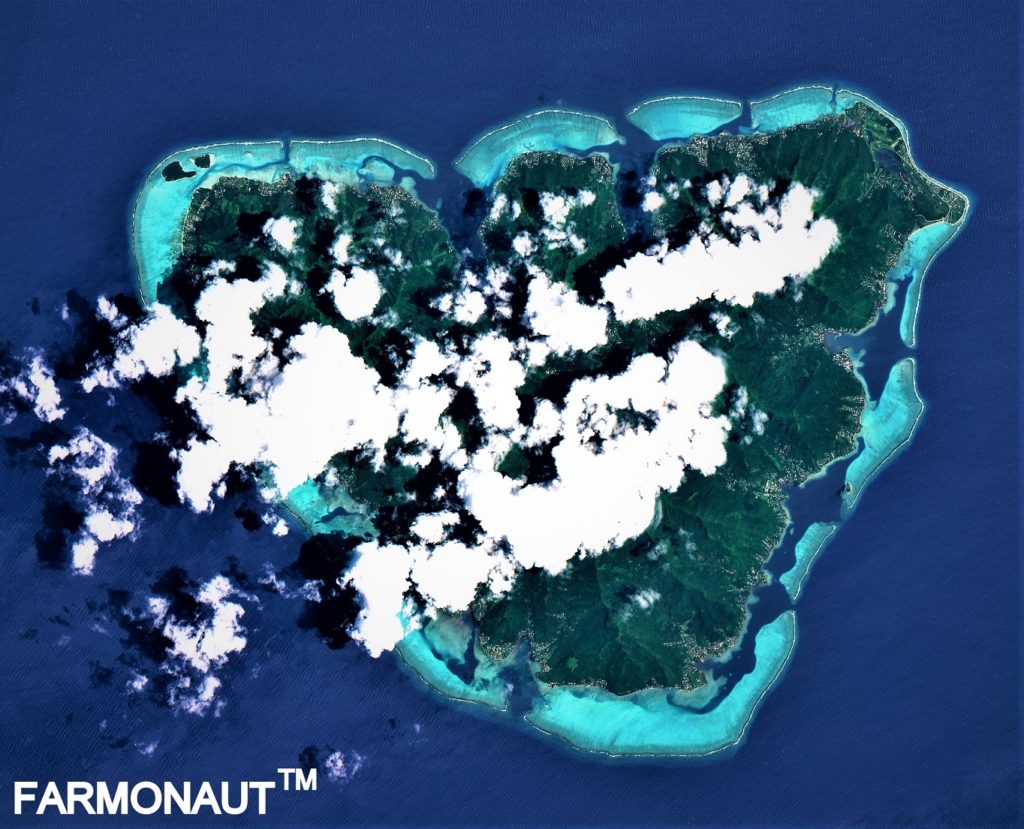
Optical remote sensing is one of the most commonly used data source for deriving crop information such as crop type map, biophysical parameters, crop growth stages, yield etc. Crop leaves are very sensitive to visible and infrared regions. However, persistent cloud cover during the monsoon season makes the availability of optical data difficult. This is almost impossible to obtain a cloud-free optical image during this period in a subtropical country like India.
In this scenario, Synthetic Aperture Radar (SAR) is the only option to map the kharif season crops along with the Optical satellite images. The Sentinel-1 microwave image with the advantage of free distribution provides more opportunities to derive crop type map. Being the high spatial and temporal resolution data, it allows not only to discriminate different crop types but also to assess their growth status.
Sentinel-1A is a synthetic aperture radar (SAR) mission that provides continuous all-weather, day-and-night images at C-band in four imaging modes (EW, IW, SM, WV) with various spatial resolutions (10, 20, 60 m) and coverages.
⦁ Sentinel -1 is the first of the Copernicus Programme satellite constellation established by the European Space Agency. Sentinel-1 with a resolution of 20m.
⦁ It is an imaging radar mission providing continuous all-weather, day-and-night imagery at C-band (in the microwave frequency), using Synthetic Aperture Radar (SAR) active sensor. SAR has the advantage of operating at wavelengths not impeded by cloud cover or lack of illumination.
⦁ The microwave portion of the spectrum covers the range from approximately 1cm to 1m in wavelength. Because of their long wavelengths, compared to the visible and infrared, microwaves have special properties that are important for remote sensing. Longer wavelength microwave radiation can penetrate through cloud cover, haze, dust etc. This property allows detection of microwave energy under all weather and environmental conditions so that data can be collected at any time.
⦁ SAR actively transmits microwave signals towards the Earth and receives a portion of transmitted energy as backscatter from the ground. The returned backscatter echo of the scene is received by the satellite’s antenna. The brightness amplitude of the returned signal, along with its phase information, is recorded to construct an image of the scene.
⦁ Based on reported studies Backscatter plays a significant role in identification of
⦁ Crop Area Sown and Crop Identification
⦁ Tracking of Sowing and harvesting patterns
⦁ Sentinel 1 has a swath width of 300 km. (As a satellite revolves around the Earth, the sensor “sees” a certain portion of the Earth’s surface. The area imaged on the surface, is referred to as the swath.)
⦁ Sentinel 1 has a Temporal resolution of 12 days. Temporal resolution is a measure of the repeat cycle or frequency with which a sensor revisits the same part or for that matter the same pixel of the Earth’s surface. Thus, the satellite data is available once in 12 days during the season and thus for a crop season of 120 days, around 10 images are available.
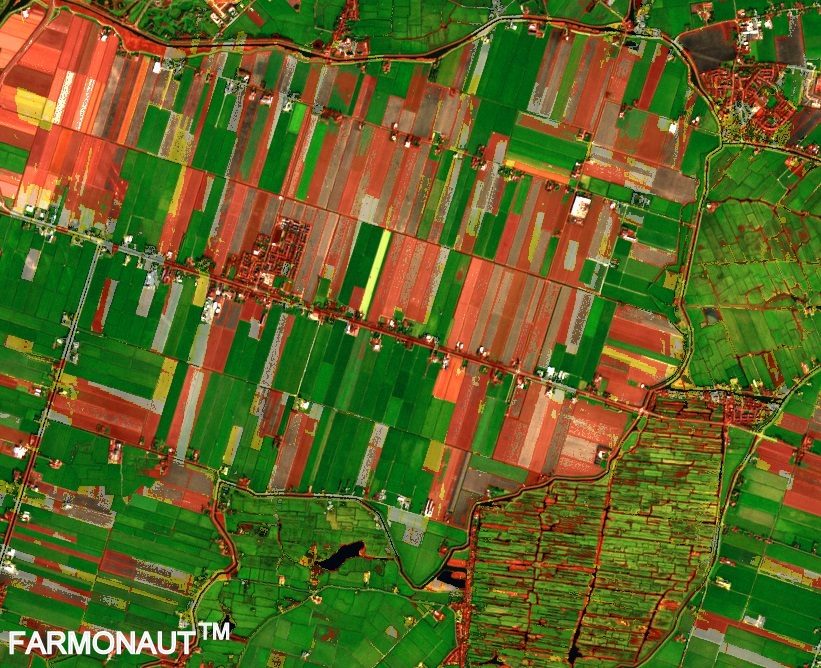
Sentinel-2 is an Earth observation mission from the Copernicus Program that systematically acquires optical imagery at high spatial resolution.
⦁ Sentinel 2 has a swath width of 10000 km with the spatial resolution of 10 m and temporal resolution of 5 to 7 days
⦁ During the kharif season the image availability of Sentinel 2A is less due to cloudy condition, around September 2nd fortnight image will be available from this satellite for exploration.
In Situ Data
⦁ Field data is used to extract profiles & understand the ground signatures of the soyabean crop, calibrate or train classification algorithms, and validate the results.
⦁ The field data is very crucial input for crop classification, the dynamic nature is captured through the field information.
We will keep posting about any such informative information on to our blogs, to help as many people as possible. Farmonaut is built upon a vision to bridge the technological gap between farmers and strives to bring state-of-the-art technologies in the hands of each and every farmer. For any queries/suggestions, please contact us at [email protected].
We have some more interesting articles coming up soon. Stay tuned!
Wait!!
Before that…
Follow us at:
Facebook: https://facebook.com/farmonaut
Instagram: https://instagram.com/farmonaut
Twitter: https://twitter.com/farmonaut
LinkedIn: https://www.linkedin.com/company/farmonaut/
Pinterest: https://in.pinterest.com/farmonaut/
Tumblr: https://farmonaut.tumblr.com/
Youtube: https://www.youtube.com/channel/UCYWOOPPKATLgh4L6YRlYFOQ
AppLink: https://play.google.com/store/apps/details?id=com.farmonaut.android
Website: https://farmonaut.com
Satellite Imagery: https://farmonaut.com/satellite-imagery
Satellite Imagery Samples: https://farmonaut.com/satellite-imagery-samples


