

Precision farming · AI agents guide
AI Agents in Precision Agriculture: What Works on Farms
AI agents watch farm data, flag what needs attention and draft actions for a person to approve. USDA data shows guidance on 58% of US corn acres in 2016 but imagery on only 7%. Satellite scouting needs no new machinery, so it is an easy place to start.
Key takeaways
- An AI agent runs in a loop: it collects data, checks it against your goals and acts or suggests an action, with a person approving.
- USDA ERS found guidance on 58% of planted corn acres in 2016, yield maps on 43.7%, VRT on 37.4%, soil maps on 21.5% and drones, aircraft or satellite imagery on 7.0%.
- In 2025, 85% of US farms had internet access and 82% had a smartphone (USDA NASS), enough to receive agent alerts.
- Satellites show where the canopy changed, not why; every alert still needs a ground check.
- Drone spraying in the US needs FAA Part 137 approvals, and all rates must follow the product label and local rules.
In this article
- What an AI agent does on a farm
- How AI agents differ from older precision agriculture tools
- Where US farms already use the building blocks
- Six jobs for AI agents in precision agriculture
- 1. Crop scouting from satellite images
- 2. Irrigation scheduling
- 3. Variable-rate prescriptions
- 4. Drone imaging and spraying
- 5. Records and compliance
- 6. Labor and machinery planning
- How to choose an AI agent tool for your farm
- Does it pay? A simple time-savings check
- How to start: five steps
- Limits and risks to plan for
AI agents in precision agriculture are software tools that watch farm data, decide what needs attention and then act or recommend an action, such as flagging a stressed zone or drafting a variable-rate map. They build on tools many US farms already use: the USDA Economic Research Service found that auto-steer guidance was used on 58 percent of planted corn acres in 2016, up from 5.3 percent in 2001. This guide shows where agents help, what the adoption data says, how to choose a tool and how to test the payback with your own numbers.
Below you will find six farm jobs that AI agents can take on, three charts built from USDA survey data, a buyer checklist and a calculator that compares scouting time saved with the cost of a monitoring service.
What an AI agent does on a farm
A plain AI model answers one question when you ask it. An AI agent runs in a loop. It collects data, checks it against a goal, picks the next step and either acts or asks a person to approve. On a farm, the data can be satellite images, soil maps, weather forecasts, yield monitor files or machine logs.
A simple example: an agent checks new satellite images of each field after every clear pass. If a zone’s vegetation index drops faster than the rest of the field, it marks the zone, adds a weather note and sends a scouting task to the agronomist’s phone. The person still walks the field and decides what to do. The agent saves the time it takes to look at every map.
Most farm agents today are “human in the loop” tools. They suggest; people approve. Fully automatic actions are most common in closed systems such as guidance and section control on a sprayer, where the machine follows a map that a person has set up.
The building blocks an agent uses
- Sensing: satellites, drones, soil probes, weather stations and yield monitors.
- Models: image models that score crop vigor, crop growth models, and language models that turn data into plain notes.
- Rules and goals: thresholds you set, such as “alert me if a zone falls 15 percent below the field average”.
- Actions: alerts, scouting tasks, prescription maps, irrigation schedules or reports.
How AI agents differ from older precision agriculture tools
Precision agriculture is not new. A University of Illinois farmdoc daily article describes it as a mix of GPS guidance, sensors, yield monitors and variable-rate applicators that collect and act on data about soils and crops. What changes with agents is who does the analysis.
| Task | Older precision tools | With an AI agent |
|---|---|---|
| Field checks | You open each map and look | Agent ranks fields by change and flags zones |
| Prescriptions | Consultant draws zones by hand | Agent drafts zones from yield, soil and image layers for review |
| Irrigation | Fixed schedule or manual probe reads | Agent combines probe, weather and crop stage into a suggested schedule |
| Records | Typed up after the season | Agent logs passes, inputs and notes as they happen |
| Who decides | Farmer or agronomist | Still the farmer or agronomist |
The last row matters. An agent does not remove the need for local knowledge. It speeds up the routine part of the work so people can spend time on the calls that need judgment.
Where US farms already use the building blocks
Agents need digital data to work with, so adoption of older precision tools is a good guide to where they can start. The USDA ERS report Precision Agriculture in the Digital Era (February 2023) uses the Agricultural Resource Management Survey. For corn in 2016, it found guidance on 58 percent of planted acres, yield maps on 43.7 percent, variable-rate technology on 37.4 percent and soil maps on 21.5 percent. Drones, aircraft or satellite imagery were used on 7.0 percent of corn acres that year.
Chart
Precision tools on US corn acres
Percent of planted corn acres using each technology, 2016 (ARMS survey)
So the data layers an agent needs exist on many large row-crop farms, but imagery and soil maps are far less common than guidance. The same report found that, except for cotton, fewer than 25 percent of the smallest row-crop farms used yield maps, soil maps, VRT or guidance. That gap is where low-cost satellite tools can help, because they need no new machinery.
Basic connectivity is less of a barrier than it was. The USDA National Agricultural Statistics Service reported in August 2025 that 85 percent of US farms had internet access and 82 percent had a smartphone in 2025. A phone is enough to receive an agent’s alerts and scouting tasks.
Six jobs for AI agents in precision agriculture
Each job below says what the agent does, what data it needs and who it suits best. The order follows how easy each job is to start, not a ranking of value.
1. Crop scouting from satellite images
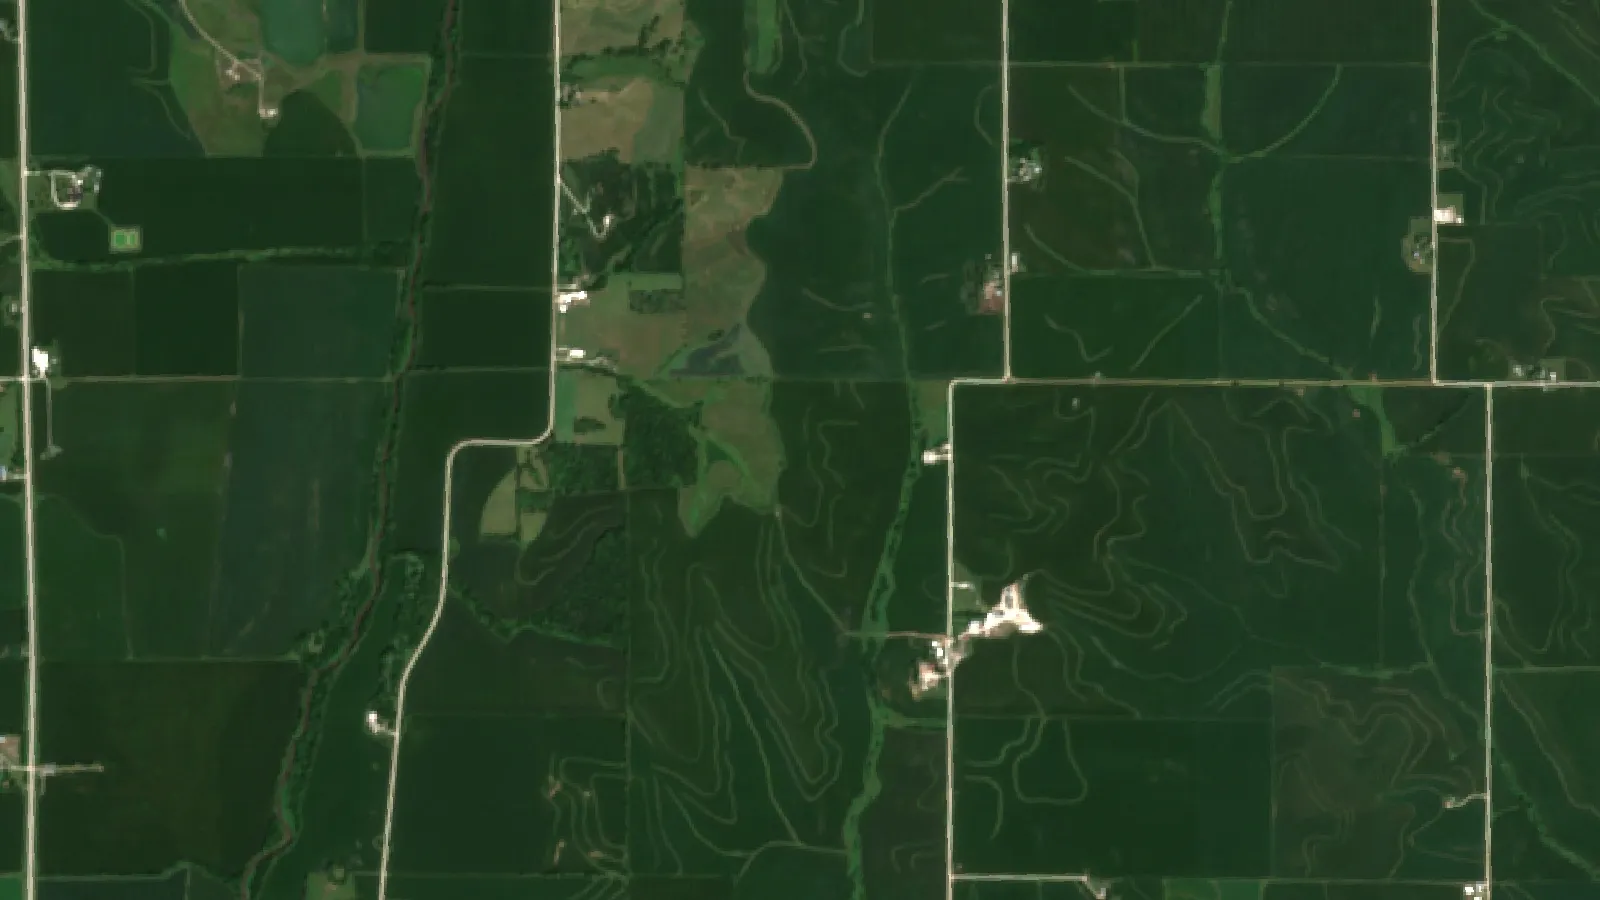
Healthy leaves absorb red light and reflect near-infrared light strongly. NASA explains that comparing the two gives the Normalized Difference Vegetation Index (NDVI), a measure of green vegetation. The European Sentinel-2 mission collects 13 spectral bands, with four at 10 m resolution, and its two satellites give a revisit time of 5 days at the Equator.
An agent watches each new image, compares zones, filters out cloudy passes and sends a short list of places to check. Satellites show that something changed in the canopy. They do not tell you the cause. A dip can be water stress, nitrogen, disease, hail or a planter skip, so someone still needs to walk to the spot.
Best for: farms of any size, agronomists covering many clients, and crops where problems spread across zones before they are visible from the road.
▶ How satellite NDVI maps show crop stress across a large farm before it is visible on foot. · 4:09
2. Irrigation scheduling
Irrigation agents mix soil moisture probe data, weather forecasts, crop stage and sometimes satellite-based water-use estimates to suggest when and how much to water. University of Nebraska-Lincoln researchers tested a model that used Landsat imagery to manage variable-rate irrigation on a center pivot in west-central Nebraska, with maize in 2017 and soybean in 2018. It was one field over two seasons, so treat it as a research proof of concept, not a guaranteed result.
Best for: pivot and drip systems where water is costly or limited, such as in the western US, southern Europe and Australia.
3. Variable-rate prescriptions
A prescription agent drafts seed, fertilizer or lime rates by zone from yield maps, soil maps and imagery. The agronomist reviews and edits the map before it goes to the controller. Variable-rate technology lags well behind guidance on every crop in the ERS data, which suggests many farms have the steering hardware but not yet the zone maps to feed a variable-rate controller.
Chart
Variable-rate tech lags guidance on every crop shown
Percent of planted acres; corn 2016, soybeans 2018, cotton and sorghum 2019 (ARMS)
ERS also cites earlier ARMS work by Schimmelpfennig (2016) showing labor hours per bushel of corn 28 percent lower for VRT adopters than for nonadopters in a 2010 sample. That is a survey comparison of farms, not a controlled trial, so larger farms with other advantages may explain part of the gap.
Best for: row-crop farms that already have yield monitor data and a controller that reads prescription files. Fertilizer and pesticide rates must still follow the product label and local rules; ask a certified agronomist when in doubt.
4. Drone imaging and spraying
Drones add high-resolution images on demand and, on some farms, spot spraying. In the ERS survey, adoption of drones, aircraft or satellite imagery ranged from 2.8 percent of cotton acres to 9.8 percent of soybean acres across the crops surveyed. An agent can plan flight paths over the zones a satellite has flagged, which cuts flight time.
Chart
Drone, aircraft or satellite imagery by crop
Percent of planted acres; corn 2016, wheat 2017, soybeans 2018, cotton and sorghum 2019 (ARMS)
In the US, the FAA says 14 CFR Part 137 governs the use of drones to dispense or spray substances, and operators who fall under it need a Part 137 certificate along with other drone approvals. Not every substance is covered, so check with the FAA first. Other countries have their own aviation and pesticide rules, so check with your national regulator and follow the product label.
Best for: high-value crops, fields with patchy weed or pest pressure, and service providers who fly for many farms.
5. Records and compliance
Record agents gather machine logs, input purchases and field notes into one timeline. They can draft spray records, nutrient plans and buyer reports for checking by a person. This job has the lowest risk, because the agent only organizes data that already exists.
Best for: farms that sell into supply chains with traceability or sustainability reporting, and anyone who spends evenings typing up records.
6. Labor and machinery planning
Farm labor keeps getting harder to find. USDA ERS notes that self-employed and family farmworkers fell from 7.60 million in 1950 to 2.06 million in 2000. Repair skills are also tight: the farmdoc daily article cites BLS estimates of about 36,830 farm equipment mechanics and service technicians employed in the US in 2023. Planning agents can match field priorities, weather windows and crew time, and flag machines that are due for service.
Best for: larger operations with several crews or machines, and contractors who serve many farms.
How to choose an AI agent tool for your farm
Many products now carry an “AI” label. Use these questions to sort the useful ones from the rest.
- What data does it need? Satellite-only tools need just a field boundary. Prescription and irrigation agents may need yield files, soil tests or probe data.
- What does it actually do? Ask for a sample alert, report or map from a field like yours.
- Who approves actions? Look for clear approval steps before anything goes to a machine.
- Does it work with your equipment? Check file formats for your display and controller brand.
- Who owns the data? Read the data-sharing terms. ERS found that only a small share of crop acres are managed by farmers who download public data for decisions (2.8 percent of corn acres in 2016), so check what the tool adds beyond public data you can already download.
- What does it cost per acre per year? Compare that with the time it saves, using the calculator below.
- Is there local support? Ask about agronomy help and training in your region and time zone.
Does it pay? A simple time-savings check
The quickest gain from a scouting agent is time. If you know how many hours you spend checking fields, you can compare the value of hours saved with what the service costs. Enter your own numbers below. The default values are examples set near break-even, not a forecast.
Time is only one part of the value. An earlier warning can also protect yield, but that depends on the crop, the problem and how fast you act, so it is left out of the calculator on purpose.
Try the numbers for your own farm below.
Calculator
Does a scouting agent save more than it costs?
Enter your own acres, scouting hours, labor rate and service price.
- Scouting hours per season now: 400 hours
- Hours saved: 100 hours
- Value of hours saved: $2,500
- Service cost per season: $2,500
Example values only, set near break-even; they are not benchmarks or forecasts. Every number is your input. The calculator counts only time saved, not any yield protected by earlier warnings. Check the service price per acre with the provider.
How to start: five steps
- Pick one or two fields. Choose fields with known problem zones so you can judge the alerts.
- Map field boundaries. Draw them once in your monitoring tool.
- Set simple alert rules. Start with a drop in vegetation index compared with the field average.
- Walk every alert for one season. Note whether each flag was real and what caused it.
- Expand or stop. If most alerts were useful, add more fields and layers such as yield maps. If not, change the rules or try another tool.
Satellite monitoring is an easy first step because it needs no new hardware. Farmonaut Satellite + AI Farm Monitoring System is one option: you draw the field once and receive vegetation maps after each usable satellite pass on web, Android or iOS.
▶ Six plain steps to start precision farming without buying a robot. · 4:18
Limits and risks to plan for
- Clouds: optical satellites cannot see through clouds, so alerts may pause during long wet spells.
- False alarms: edges, shadows and mixed crops can trigger alerts. Expect to tune your rules.
- Cause is unknown: an agent can say where, not why. Ground checks and lab tests are still needed.
- Skills: the farmdoc daily analysis links precision adoption with demand for farm service technicians, and support may be thin in some regions.
- Data rights: read who can use your field data and for what.
- Scale: ERS found higher adoption on larger farms, which points to scale benefits. Smaller farms should start with low-cost tools.
Public research behind farm AI
Public research is also building agents for farms. USDA’s National Institute of Food and Agriculture and the National Science Foundation funded AI research institutes, with $20 million for each of the first institutes in 2020. Oregon State University is part of the AgAID Institute, a $20 million federal effort on AI for water and labor challenges in farming. Results from these groups are worth following because they are published openly.
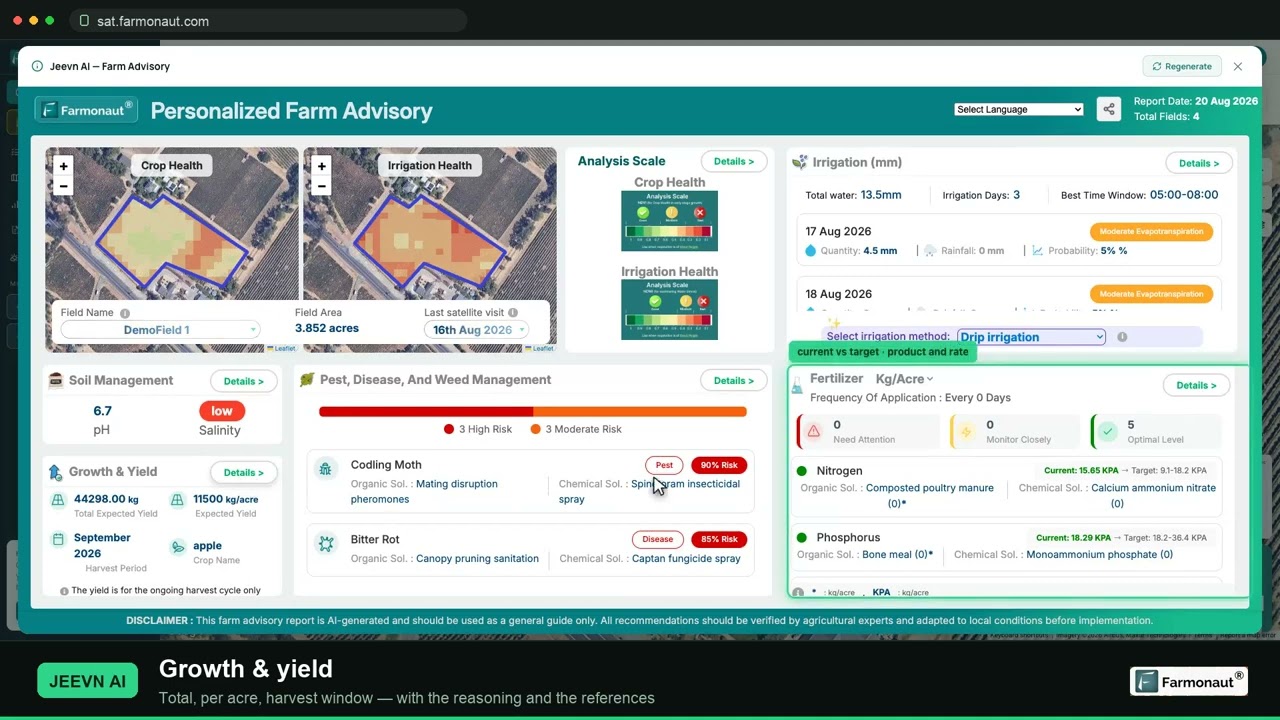
▶ A full walkthrough of reading NDVI, running an AI farm advisory and pulling a field report. · 19:36
How we checked the numbers
All adoption figures come from the USDA ERS report EIB-248 (February 2023), which uses ARMS data for corn (2016), winter wheat (2017), soybeans (2018), cotton and sorghum (2019). Each crop was surveyed in a different year, so the charts compare crops, not years. Internet and smartphone figures come from the NASS Technology Use report (August 2025). Satellite details come from NASA and the Copernicus Sentinel-2 mission pages. We did not use vendor claims for any number.
FAQ
What are AI agents in agriculture?
They are software tools that collect farm data, compare it with goals you set and then act or suggest an action. Examples include scouting alerts from satellite images, draft variable-rate maps and irrigation schedules. A person usually approves the action.
Do I need a drone or new machinery to use an AI agent?
No. Satellite-based monitoring needs only a field boundary and a phone or computer. Drones and variable-rate controllers add more options but are not required to start.
How accurate are satellite crop alerts?
They show where the canopy changed, not why. Sentinel-2 has 10 m pixels in four bands, so small spots can be missed, and clouds can delay images. Check every alert on the ground before you treat a field.
Are AI agents only for large farms?
USDA ERS found higher precision adoption on larger farms. Satellite tools that charge per acre have no hardware cost, so smaller farms can test them on a few fields first.
Can an AI agent decide fertilizer or spray rates for me?
It can draft a rate map, but you or a certified agronomist should check it. Always follow the product label and local rules for any fertilizer or pesticide.
Related pages on our site: drone use in California precision farming, agro admin app, fleet management, product traceability, carbon footprinting, crop loan and insurance tools, web app, satellite API, API developer docs, mobile apps.
Farmonaut crop monitoring
See your own fields from space
Draw your fields once and Farmonaut shows satellite vegetation maps for them through the season, on web, Android or iOS.




Keep reading
Sources
- USDA ERS, Precision Agriculture in the Digital Era: Recent Adoption on U.S. Farms, EIB-248 (February 2023): ers.usda.gov
- USDA NASS, Technology Use (Farm Computer Usage and Ownership) (August 2025): esmis.nal.usda.gov
- Kalva and Janzen, The People Behind the Machines, farmdoc daily, University of Illinois (January 2026): farmdocdaily.illinois.edu
- NASA Earth Observatory, Measuring Vegetation (NDVI and EVI): science.nasa.gov
- Copernicus SentiWiki, Sentinel-2 mission overview: sentiwiki.copernicus.eu
- Bhatti et al., Variable rate irrigation of maize and soybean in west-central Nebraska, Frontiers / PMC (2021): ncbi.nlm.nih.gov
- Federal Aviation Administration, Dispensing Chemicals and Agricultural Products (Part 137) with UAS: faa.gov
- USDA ERS, Farm Labor topic page: ers.usda.gov
- Seed World, USDA NIFA and NSF establish network of AI research institutes (August 2020): seedworld.com
- Oregon State University, OSU part of $20M effort to develop artificial intelligence for agriculture (July 2021): news.oregonstate.edu
- European Space Agency, Sentinel-2 overview: esa.int
Discussion
Questions, corrections or field experience? Share them below. First-time comments are reviewed before they appear, and your email is never published.
No comments yet. Be the first to add a question or your experience.

 Farmo
 Kubota
 FFBS
 Jontra
 Kalustyan
 Tucor
 Geno
 Hayleys Agriculture
 Linx Agritech
 Adinet
 Save Your Soils
 Grandstream Algérie
 XOS Realty
 Geospatial Lab Africa
 Agro La Gándara
 HIPSAC

 Licence holder · Niger · Gold










