

Reviewed August 2026 against USDA Agricultural Research Service, the Crop Protection Network, and peer-reviewed field-accuracy data published on PMC/NIH.
Try it: Estimated value of catching disease earlier: $0 →
- Quick Answer: What a Plant Disease Detection App Actually Does
- The Cost of Not Catching Disease Early: US Crop Loss Data
- How AI Plant Disease Detection Works, Step by Step
- Lab Accuracy vs. Field Accuracy: The Number Most Apps Won’t Show You
- Plant Disease Identifier App: Android, iOS & Web Comparison
- Calculator: What Early Detection Is Worth on Your Acres
- Video: AI, Drones & Satellite Crop Monitoring in Practice
- Farmonaut’s Approach: Satellite Data Behind the Diagnosis
- A Durable Checklist: How to Vet Any Plant Disease App
- Frequently Asked Questions
- Subscriptions & API Access
Quick Answer: What a Plant Disease Detection App Actually Does
A plant disease detection app uses a smartphone camera and a trained computer-vision model to identify crop diseases from a leaf, stem, or fruit photo, typically returning a diagnosis in under a minute. The best models score above 99% accuracy on laboratory image sets but that number drops sharply in real fields — peer-reviewed testing found a convolutional neural network trained on the laboratory PlantVillage dataset lost 31 percentage points of accuracy when tested on field-collected photos, while a model trained specifically on field images (PlantDiseaseNet) held at 93.67% accuracy under the same real-world conditions, according to a 2025 review published on PMC/NIH (PMC/NIH). That gap — lab number vs. field number — is the single most important thing to check before trusting any AI plant disease diagnosis tool with a real decision on your farm.
Below, we break down what these apps cost you if you skip them, how the underlying AI actually works, what to look for in an Android, iOS, or web-based plant disease identifier, and a calculator that turns your own acreage and crop into a dollar estimate of what earlier detection is worth.
The Cost of Not Catching Disease Early: US Crop Loss Data
Plant diseases cost United States agriculture an estimated $43 billion a year in yield, quality, and marketability losses, according to the USDA Agricultural Research Service (USDA ARS). A further $21 billion a year comes specifically from plant pathogens that did not originate in the United States and arrived through trade, travel, or contaminated planting material, per USDA-supported research cited by the Department of Homeland Security’s Science & Technology Directorate (DHS S&T, March 2025). Together that is roughly $64 billion a year sitting on the table for detection tools — human or AI — to claw back.
Crop-by-crop, the Crop Protection Network’s annual disease loss surveys (compiled from university Extension specialists and USDA state cooperators) put real numbers behind that total. Wheat disease losses across the United States and Ontario, Canada combined reached $1.8 billion in 2024, with US wheat yield reduced 8.3% by disease that year (Crop Protection Network, 2024 wheat report). For corn, the 2025 survey estimated a 7.0% yield reduction from disease nationally, equivalent to roughly 1.3 billion bushels lost (Crop Protection Network, 2025 corn report). Cotton growers lost 5.4% of yield to disease in 2024 (Crop Protection Network, 2024 cotton report). Soybean disease losses have averaged $4.55 billion a year across a 20-year historical window tracked in a peer-reviewed economic analysis (NCBI/PubMed soybean loss study).
Citrus growers have their own cautionary case study. Huanglongbing (citrus greening) cost Florida growers an estimated $9 billion between 2006 and 2016, and drove a 40% reduction in the state’s bearing citrus acreage over that same decade, per USDA ARS (USDA ARS). HLB is a slow, symptomless-at-first bacterial disease — exactly the kind of threat where a few weeks of earlier detection compounds into a very different outcome a decade later.
These figures move every year as new Extension surveys close out a growing season. For current-year wheat, corn, soybean, and cotton loss estimates, go directly to the Crop Protection Network’s publications page and filter by crop — new annual reports are published after each season’s disease survey closes. For the broader $43 billion baseline, USDA NASS QuickStats (quickstats.nass.usda.gov) republishes pest and disease loss data annually after harvest reporting.
How AI Plant Disease Detection Works, Step by Step
Every AI plant disease detection app, regardless of brand, runs the same basic pipeline. Understanding it tells you where accuracy can break down — and where to check a vendor’s claims before you rely on the diagnosis.
- Image capture. You photograph a leaf, stem, or fruit — usually with guidance on framing, lighting, and background to reduce noise the model wasn’t trained on.
- Preprocessing. The app crops, normalizes color and lighting, and sometimes segments the diseased tissue from healthy tissue and background clutter.
- Classification. A convolutional neural network (or a newer architecture like EfficientNet) compares the processed image against patterns learned from a training dataset, then outputs a disease label with a confidence score.
- Decision support. The app returns a diagnosis and, in more complete platforms, links it to weather data, soil conditions, or regional outbreak reports to suggest whether and how to act.
- Feedback loop. Verified diagnoses — confirmed by a lab, an agronomist, or an Extension office — are fed back to retrain and improve the model over time.
Step 3 is where lab-vs-field accuracy diverges, and it is directly tied to what dataset the model trained on. A 2025 peer-reviewed review on PMC/NIH found an EfficientNet-B5 model achieved 99.97% accuracy when tested on the PlantVillage dataset — a library of clean, single-leaf, uniform-background laboratory photographs (PMC/NIH, 2025). That same review documented a separate CNN losing 31 percentage points of accuracy when the test images shifted from PlantVillage’s lab conditions to photos taken in actual fields — with variable lighting, overlapping leaves, dirt, insects, and multiple disease stages in frame. A model trained on PlantDiseaseNet, a dataset built from field-condition images rather than lab images, held 93.67% accuracy under the same real-world test.
The practical takeaway: ask any app vendor which dataset trained the model you’re about to rely on. A headline “99% accurate” claim tells you almost nothing if it was measured on lab photos.
Lab Accuracy vs. Field Accuracy: The Number Most Apps Won’t Show You
This is the comparison an AI Overview snippet cannot replace, because it depends on reading past the top-line accuracy number vendors advertise.
| Model / Dataset | Test Condition | Accuracy | What Changed |
|---|---|---|---|
| EfficientNet-B5 on PlantVillage | Laboratory images, uniform background, single leaf | 99.97% | Baseline — clean conditions only |
| CNN trained on PlantVillage, tested in field | Field-collected images, natural lighting and clutter | Drops 31 percentage points from lab baseline | Model never learned field noise patterns |
| Model trained on PlantDiseaseNet | Field-condition images (real-world dataset) | 93.67% | Trained on the noise it’s tested against |
Source: peer-reviewed review of AI plant disease detection accuracy, PMC/NIH, 2025 (full study). No equivalent field-validation study of commercial, consumer-facing plant disease apps (as opposed to research models) has been published — most peer-reviewed accuracy work still tests on research datasets like PlantVillage and PlantDiseaseNet rather than on apps people actually download. If you need proof a specific commercial app performs well on your crop and region, ask the vendor for their own field-validation numbers and the dataset behind them; if they can’t produce either, treat the advertised accuracy as a lab number until proven otherwise.
Plant Disease Identifier App: Android, iOS & Web Comparison
“Plant disease identifier app android” and “app for plant disease” searches are usually looking for the same thing: something installable today that works on the phone already in your pocket. Farmonaut ships the same underlying diagnostic and satellite-monitoring engine across three surfaces — a native Android app, a native iOS app, and a browser-based web app — so the platform choice comes down to your workflow, not a feature trade-off.



| Platform | Best For | Access Point |
|---|---|---|
| Android app | Field scouting on the go, offline photo queueing | Google Play |
| iOS app | iPhone/iPad users, integration with Apple Photos workflow | App Store |
| Web app | Desktop review, farm managers checking multiple fields at once | Launch web app |
The full diagnostic workflow — combining AI-powered plant disease diagnosis with satellite field data — is also reachable through Farmonaut’s large-scale farm management platform, which is built for teams managing more than one field or one crop and need disease alerts alongside irrigation, NDVI, and weather layers in one dashboard.
Calculator: What Early Detection Is Worth on Your Acres
Enter your crop, acreage, expected yield, and price to estimate the dollar value of catching disease early, using the Crop Protection Network’s measured disease-related yield reduction rates as the starting benchmark.
Estimated value of catching disease earlier: $0
Assumptions: the crop dropdown uses disease-related yield-reduction percentages reported by the Crop Protection Network for wheat (2024), corn (2025), and cotton (2024) as the baseline loss rate before any intervention. It does not account for input costs of scouting or the app itself, disease severity variation within a field, or crop insurance indemnities. Treat the output as a planning estimate, not a guarantee — swap in your own yield and price figures for your operation.
Video: AI, Drones & Satellite Crop Monitoring in Practice
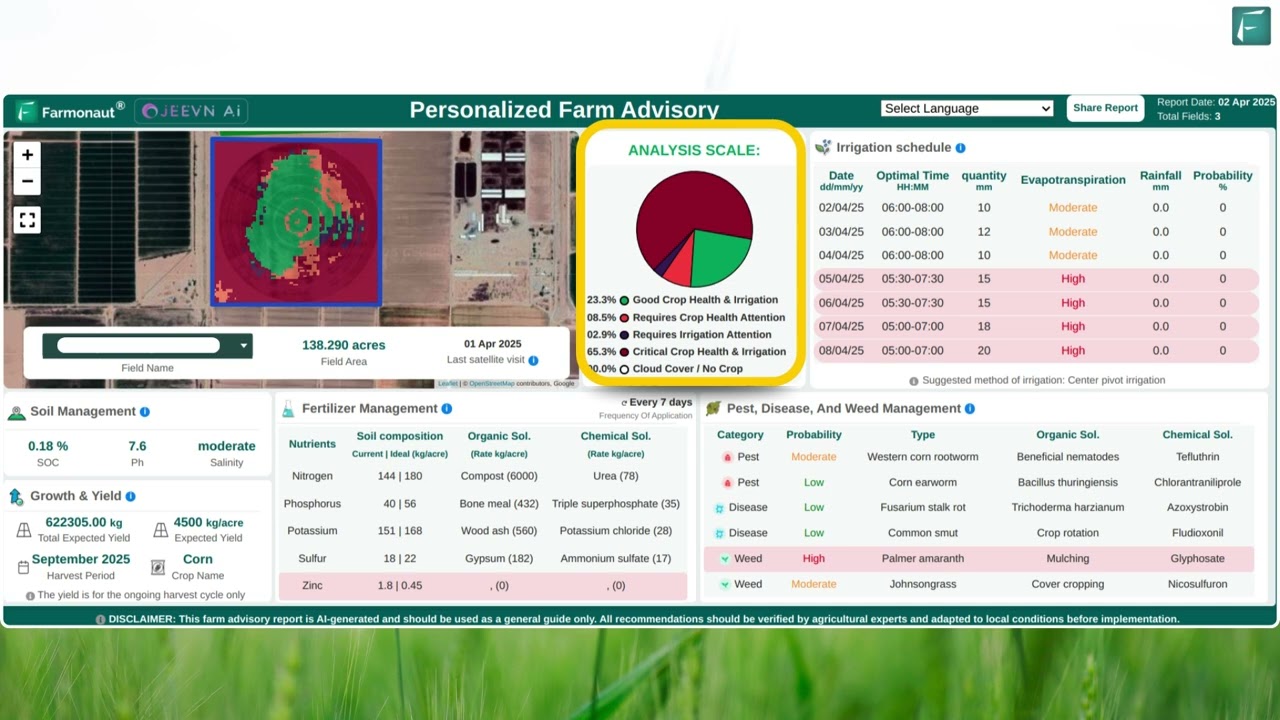
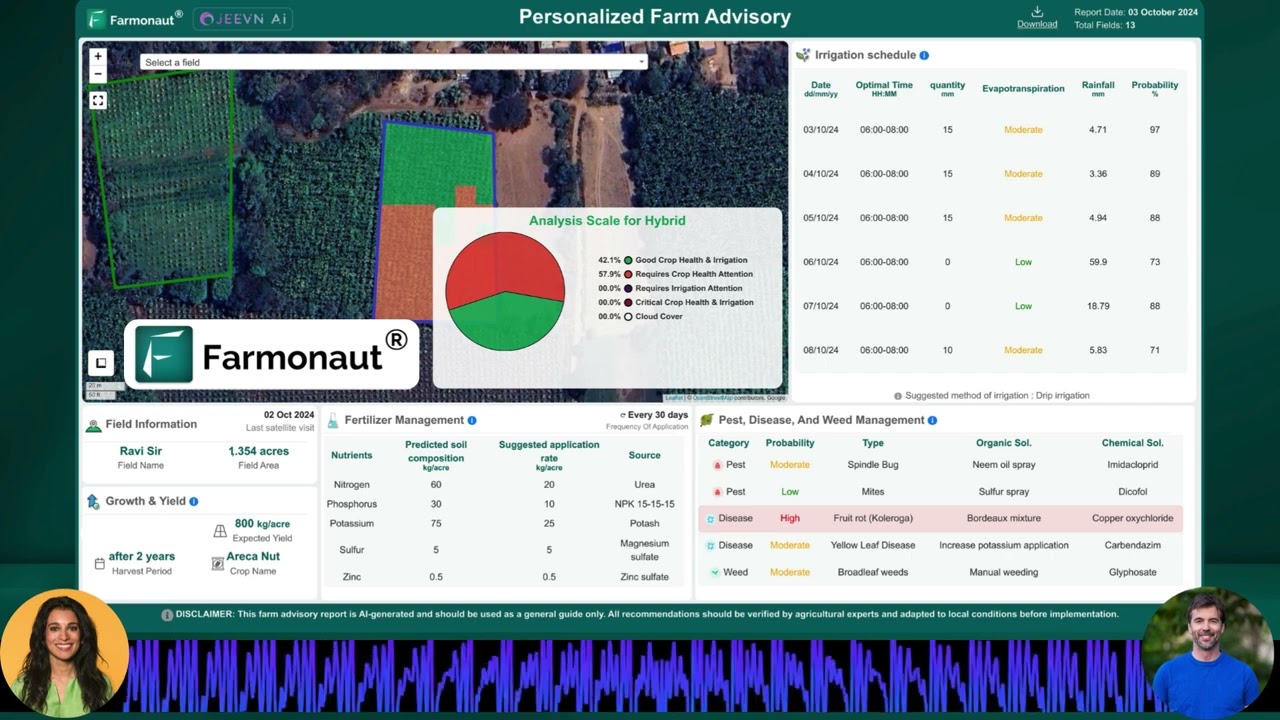
These walkthroughs show the diagnostic and satellite-monitoring workflow in action, from drone-assisted scouting to the mobile app interface farmers use to check crop health day to day.





Farmonaut’s Approach: Satellite Data Behind the Diagnosis
A leaf photo tells you what is already wrong. Satellite data can flag stress before it shows up as a visible lesion — which is why Farmonaut pairs its AI plant disease diagnosis tool with continuous field monitoring rather than shipping disease detection as a standalone photo-in, label-out feature.
- Satellite-based monitoring: NDVI vegetation health and soil condition mapping flag stressed zones in a field before disease symptoms are visible to the eye, narrowing down where to point the camera.
- AI-based advisory (JEEVN AI): combines satellite data, weather, and crop stage to suggest management actions once a disease is identified, rather than leaving you with a label and nothing else.
- Fleet and resource management: for larger operations, disease alerts tie into equipment and labor scheduling through Farmonaut’s fleet management platform, so a spray pass gets routed to the affected block, not the whole farm.
- Traceability: disease treatment records feed into blockchain-based product traceability, useful for buyers or certifiers asking for a documented intervention history.
- Carbon and sustainability tracking: reduced, targeted pesticide use from earlier and more precise diagnosis feeds directly into carbon footprint monitoring.
- Loan and insurance verification: documented crop health status supports crop loan and insurance applications where lenders or insurers want field-condition evidence.
Developers and agtech teams can build directly on the same satellite and diagnostic data through Farmonaut’s API, with setup details in the API developer documentation.
A Durable Checklist: How to Vet Any Plant Disease App
Accuracy numbers, dataset names, and pricing all change. This checklist doesn’t — use it on any plant disease detection app, including this one, whenever you’re deciding whether to trust its output on a real field decision.
- Ask what dataset trained the model. A lab-only dataset (like PlantVillage) can score above 99% and still lose over 30 percentage points of accuracy on your actual field photos. A field-trained dataset (like PlantDiseaseNet) is the more honest comparison point.
- Ask for a confidence score, not just a label. A diagnosis returned with 55% confidence should trigger a second photo or a human second opinion, not a spray decision.
- Cross-check against your regional Extension office. Land-grant university Extension services and USDA state specialists publish disease alerts and identification guides specific to your crop and county — use these to sanity-check an app’s output, especially for a first-time or unusual diagnosis.
- Check whether the app links to current loss data. The economic case for early detection depends on current disease-loss rates for your crop; the Crop Protection Network republishes wheat, corn, cotton, and other crop-specific loss surveys annually, so re-verify the percentage you’re using is from the latest completed season.
- Verify the app actually improves over time. Ask whether verified diagnoses are fed back into retraining, and how often. A static model trained once and never updated will drift as new disease strains and resistant pathogen variants emerge.
- Test it on a known case first. Before trusting a new disease flag, run the app on a plant with a diagnosis you or your agronomist have already confirmed, to calibrate how much to trust its output on your specific crop and region.
This is the spine of the article that won’t go stale: the loss percentages and accuracy figures above will be superseded by next season’s Crop Protection Network survey and the next peer-reviewed field-accuracy study, but the method for vetting any app — dataset origin, confidence scoring, Extension cross-check, feedback-loop verification — holds regardless of which numbers currently sit behind it.
Frequently Asked Questions
1. What is the best plant disease detection app?
There is no single published, peer-reviewed ranking of commercial plant disease apps under real field conditions — most rigorous accuracy testing to date has been done on research models against datasets like PlantVillage and PlantDiseaseNet, not on branded consumer apps. Use the verification checklist above (dataset origin, confidence scoring, Extension cross-check) to evaluate any specific app, including Farmonaut’s, against your own crop and region before relying on it.
2. How accurate is AI plant disease detection?
It depends entirely on what the model was tested against. Under laboratory image conditions, an EfficientNet-B5 model reached 99.97% accuracy on the PlantVillage dataset. Under field conditions — natural lighting, cluttered backgrounds, multiple disease stages — a comparable CNN’s accuracy fell by 31 percentage points from its lab baseline, while a model trained specifically on field images (PlantDiseaseNet) held 93.67% accuracy, per a 2025 peer-reviewed review on PMC/NIH.
3. Is there a free plant disease identifier app?
Farmonaut’s plant disease diagnosis is accessible through free-tier access on web, Android, and iOS; full satellite monitoring and advisory features sit in the paid subscription tiers listed below. Check current tier limits before assuming a specific feature is included at no cost.
4. How much do plant diseases actually cost US farmers?
USDA’s Agricultural Research Service estimates $43 billion a year in total plant disease losses across US agriculture, plus another $21 billion a year specifically from pathogens introduced from outside the United States. Crop-specific losses include $1.8 billion in combined US/Ontario wheat disease losses in 2024, an average $4.55 billion a year in soybean disease losses over a 20-year historical window, and $9 billion in citrus greening losses in Florida alone between 2006 and 2016.
5. Can a plant disease app replace lab testing or an agronomist?
Not for a high-stakes or unusual case. Given the documented accuracy drop between lab and field conditions, treat an app diagnosis as a fast first screen — confirm anything that would trigger a significant spray decision, replant decision, or insurance claim with your local Extension office or a certified agronomist.
6. Does a plant disease detection app work without internet access in the field?
This varies by app and by whether the classification model runs on-device or in the cloud. Check the specific app’s listing on the Google Play Store or Apple App Store for offline capability before relying on it in low-signal fields.
7. Can I integrate plant disease and crop health data into my own software?
Yes. Farmonaut offers API access to its satellite and diagnostic data, with setup instructions in the developer documentation, so agtech teams, insurers, and lenders can embed the same data into their own dashboards.
Farmonaut Subscriptions & API Access
Subscription tiers scale from a single field to enterprise and government-scale deployments. Pricing and feature limits are shown live below — check this table directly rather than a cached screenshot, since tiers are revised periodically.
Integrate these capabilities directly into your own application or dashboard with Farmonaut APIs, documented at the API developer documentation page.
Conclusion
The gap between a plant disease app’s advertised accuracy and its accuracy on your actual field is the single most consequential fact in this category, and it is measurable: a 31-percentage-point drop for a lab-trained model versus 93.67% held accuracy for a field-trained one, per the 2025 PMC/NIH review cited above. Combined with the documented $43 billion in annual US plant disease losses from USDA ARS, and crop-specific loss rates from the Crop Protection Network that update every season, the case for earlier and better-validated detection is not a matter of opinion — it is in the loss surveys.
Use the checklist above on any app you’re evaluating, run the calculator against your own acres and price, and re-check the cited sources each season, since the Crop Protection Network, USDA ARS, and peer-reviewed accuracy studies are all refreshed on their own schedules independent of this page.

 Godrej Agrovet
 Hayleys Agriculture
 Linx Agritech
 Adinet
 Save Your Soils
 GalaxEye Space
 Grandstream Algérie
 XOS Realty
 Geospatial Lab Africa
 Agro La Gándara
 HIPSAC
 ZOL Zimbabwe
 Juligerm
 AdBio
AdBio MISE Maroc
 NWNS
NWNS Red August Group
 Farm Inc
 WeMe Global
 Agrotoken
 Blue BearX
 Insignito
 DnCubed
 Indosistim Teknologi
 Liquify Digital
 CU Foods
 BeyondTech Global
 Rouge VC
 AgroRisk
 Oath Inc
 Esri North East Africa
 MDCV UK
 Etech Consulting Madagascar
 Vestlandsforsking
 WB Dev
 Sama Premium
 Tres Valles
 Blickwinkel
 Agricultural Credit Policy Council
 eKGIS
eKGIS Mostas Tech
 Andex
Andex Deluxe Conseil
 WICO
WICO Chimera Innovation
 SkyHarvest
 Teledarbas
 Exurbia Geospatial
 FieldZero
