

Reviewed September 2026 against USDA NASS, USDA ERS, and the Association of Equipment Manufacturers (AEM).
Try it: Soybean Precision-Ag ROI Estimator →
US farmers planted 85.4 million acres of soybeans and harvested 80.4 million acres in 2025, producing 4.26 billion bushels, according to USDA NASS’s June 30, 2026 report. Precision agriculture technology on that acreage returns an average of $118 per acre in annual economic value, per USDA ERS and AEM’s joint analysis — but the equipment and cultivation choices behind that number vary widely by farm size, tillage system, and what’s already in the shed. This article breaks down what the cultivation technology actually costs, what it returns, and where the current adoption gaps are.

Where Soybean Cultivation Technology Actually Stands
The most recent USDA ERS census of precision technology adoption on soybean farms is from 2012, and no updated census exists until the next Census of Agriculture in 2027 — so figures below are the latest published numbers, not current-year estimates. Herbicide-resistant soybean seed, by contrast, is tracked annually: NASS put adoption at 95% of planted acres in 2025. That gap between a near-universal seed technology and a decade-old equipment census is the single biggest reason “soybean technology” searches don’t get a clean answer — the two move on completely different reporting cycles, and conflating them is what makes most guides on this topic vague.
On the equipment side, the 2012 ERS data (the most recent breakdown by adoption rate) found 51% of US soybean farms using yield monitors and 34% using GPS guidance systems. Conservation tillage — no-till plus mulch-till combined — covered 70% of soybean acres, with no-till alone accounting for 40%. If you want a current read on any of these rates for your own operation or region, USDA NASS QuickStats (the interactive database behind the NASS newsroom releases) lets you pull state-level acreage and practice data directly; it isn’t a static report you can link to, so check it live rather than trusting a cached number.
Cultivation Equipment: What It Costs and What It Covers
tillage and cultivation equipment pricing scales with width, and width determines how many acres a single unit can cover in a planting window. FarmDoc at the University of Illinois priced a 20-foot grain drill at $25,500, covering roughly 600 acres per season, and a 30-foot drill at $46,000, covering roughly 1,200 acres. That’s a rough $42-per-acre-of-capacity cost for the 20-foot unit versus $38 per acre for the 30-foot — the wider drill is cheaper per acre of coverage but requires the acreage to justify the larger upfront outlay. These are 2012 figures from FarmDoc’s field operations cost sheet; current dealer pricing for new and used drills will run higher and should be checked against local equipment dealer quotes before budgeting.
| Equipment | Purchase Cost (FarmDoc, 2012) | Acreage Covered | Cost per Acre of Capacity |
|---|---|---|---|
| 20-foot grain drill | $25,500 | ~600 acres | ~$42.50 |
| 30-foot grain drill | $46,000 | ~1,200 acres | ~$38.33 |
Those numbers are for the drill alone — they don’t include GPS guidance, variable-rate controllers, or the sensors that turn a mechanical cultivator into a precision one. FarmDoc’s full field operations cost sheet breaks out labor, fuel, and repair costs per pass for a wider range of equipment classes, and is the better reference if you’re comparing a cultivator purchase against custom-hire rates.
Satellite Crop Monitoring: The Layer That Sits on Top of Your Equipment
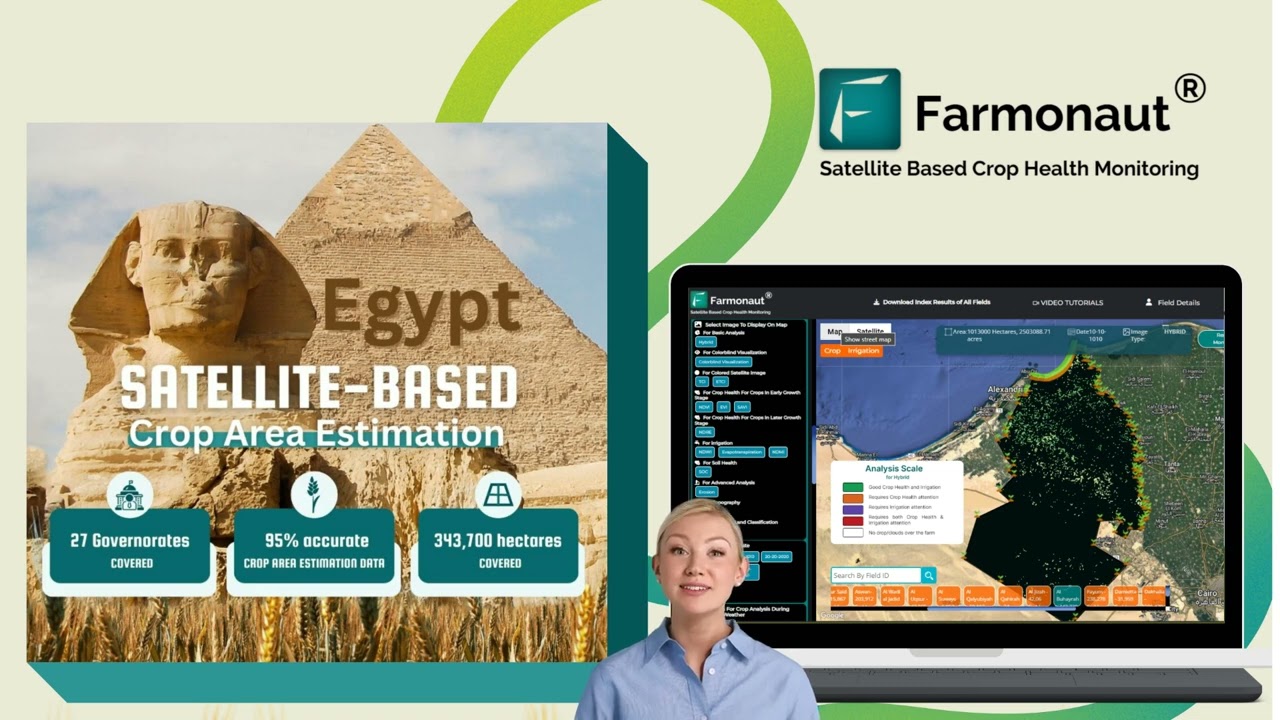
Cultivation equipment tells you what you can plant and how precisely you can place inputs. It doesn’t tell you what’s happening in the field between passes. That’s where satellite crop monitoring fits into a soybean cultivation technology stack: it’s the continuous-observation layer that complements — not replaces — GPS guidance and variable-rate hardware.
Farmonaut’s satellite-based monitoring platform tracks, across a growing season:
- Vegetation health indices (NDVI), updated on each satellite revisit
- Soil moisture levels across field zones
- Early detection of pest infestations and disease pressure
- Nutrient deficiency mapping
This is the kind of field-specific, continuously updated data an AI-generated summary can’t hand you, because it depends on the actual imagery of your actual field on a given date. General guidance on “how satellite monitoring works” is the informational half of this topic; applying it to your acreage is the operational half, and that’s the half that requires a live feed.


Soybean Precision Irrigation and Water Management
Soybean precision irrigation combines soil moisture sensing with variable-rate delivery, and the data-driven benefits of precision agriculture compound most visibly on water-limited acres. The building blocks are:
- Soil moisture sensors providing field-zone-level readings, not a single farm average
- Weather forecast integration to time irrigation against rainfall probability
- Drip or variable-rate pivot systems that deliver water by zone rather than uniformly
- Satellite-derived stress indices that flag drought-affected zones before visible wilting
These water management strategies pair directly with the $118-per-acre precision-ag value figure from USDA ERS and AEM — irrigation timing and placement is one of the line items that figure aggregates, alongside input savings and yield gains. The AEM/ERS report doesn’t break that $118 into per-practice components, so if you need the water-management share specifically, the full AEM whitepaper is the primary source to consult for methodology.
Sustainable Soybean Farming: What “Sustainable” Means in Measured Terms
Sustainable soybean farming has a specific, auditable definition in the US export market, not just a marketing label. The U.S. Soy Sustainability Assurance Protocol (SSAP) verified that 71% of US soybean production carried a Sustainable Soybean (SES) record for export in 2024, according to USSEC’s 2025 protocol overview. Separately, the American Soybean Association’s growers group has set a sector target of reducing land-use impact 10% by 2030, as published in its sustainability initiatives page.
| Metric | Figure | Period | Source |
|---|---|---|---|
| US soybean production with SSAP export verification | 71% | 2024 crop year | USSEC SSAP Overview, 2025 |
| Land-use impact reduction target | 10% | By 2030 | American Soybean Association growers group, 2025 |
| Conservation tillage acreage | 70% | 2012 (latest ERS breakdown) | USDA ERS |
These figures move on different clocks: the SSAP export share is reported by crop year, the 2030 target is a fixed horizon, and the tillage figure is over a decade stale pending the 2027 Census of Agriculture. Reading them as one blended “sustainability score” is the mistake — each answers a different question, and knowing which one you actually need is the durable skill here, independent of what the numbers say next year.
Precision agriculture tools support these sustainability targets directly: satellite-detected plant stress lets growers act roughly two weeks earlier than visual scouting alone, and variable-rate input placement is the mechanical means by which the land-use and input-efficiency targets above get hit. See the climate-smart farming practices guide for the broader practice list this feeds into.
Precision Ag ROI: What a 1,000-Acre Farm Actually Spends and Recovers
USDA ERS modeled a full digital precision technology investment — guidance, variable-rate controllers, and monitoring — at $122,000 for a 1,000-acre farm, with a 95% first-year return on investment. Combined with the $118-per-acre average annual value from the AEM/ERS analysis, a 1,000-acre operation earning the average value would see roughly $118,000 in annual precision-ag value against that $122,000 upfront cost — consistent with a return that clears in year one for farms hitting the average.
That 95% ROI and $118 per-acre figure are both averages across the row-crop farms studied; your farm’s return depends on baseline yield variability, current tillage practice, and how much of the $122,000 technology stack you already own. Use the calculator below to scale these two published figures to your own acreage.
Soybean Precision-Ag ROI Estimator
Assumptions: uses the USDA ERS/AEM $118-per-acre average annual precision-ag value and the ERS $122,000 reference investment for a 1,000-acre farm as defaults — both are averages across studied row-crop farms, not guarantees. Excludes financing costs, equipment depreciation schedules, and crop-specific price risk. Replace the defaults with your own quotes for a farm-specific estimate.
Soil Quality Analysis and Nutrient Management
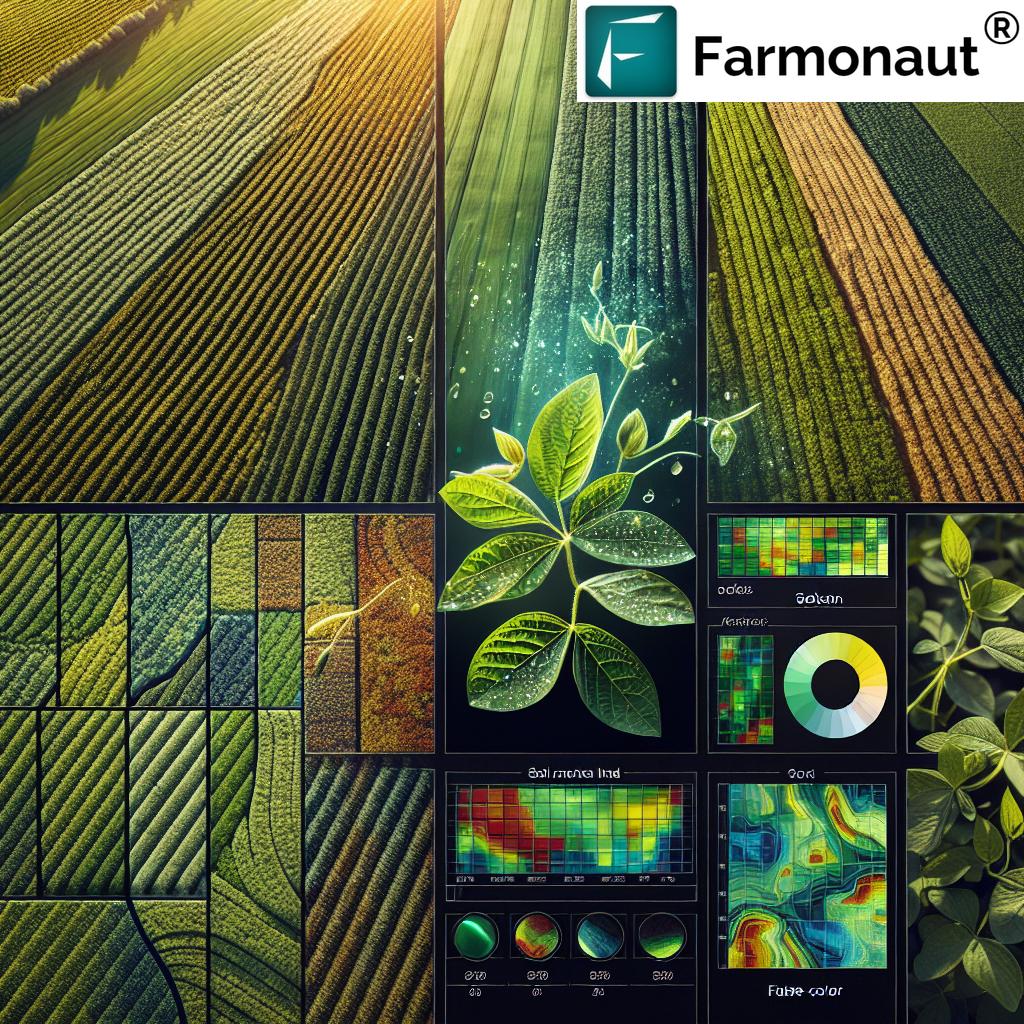
Precision sensors and AI-driven analysis tools let growers move from uniform annual soil tests to continuous, zone-level monitoring. The Farmonaut platform layers this soil data over satellite imagery so growers can see field conditions and nutrient status together rather than as separate reports. Explore the underlying data feed directly: Farmonaut’s API for soil and satellite data integration.
What continuous monitoring changes in practice:
- Nutrient deficiencies get flagged by zone rather than discovered at harvest
- pH and structure data inform amendment timing instead of a blanket annual application
- Water retention issues surface early enough to adjust the following season’s tillage plan
Drone Mapping: The Layer Between Satellite and Field Scouting
Agricultural drone mapping fills the resolution gap between satellite revisit imagery and boots-on-the-ground scouting. For soybean fields specifically, drone passes are used for:
- Stand counts and plant population assessment after emergence
- Weed patch mapping for targeted, rather than blanket, herbicide application
- Drainage and erosion detection between tillage passes
- Maturity monitoring to time harvest within the optimal moisture window
Farmonaut integrates drone mapping data alongside satellite imagery so growers get both the wide-area trend and the plant-level detail from a single dashboard rather than two disconnected tools.
Conventional and Organic Soybean Systems: Where Precision Tech Applies to Both
Precision agriculture technology isn’t exclusive to large conventional operations. In conventional farming systems, it drives variable-rate herbicide and fertilizer placement — relevant given that herbicide-resistant seed already covers 95% of US soybean acres per the 2025 NASS figures cited above. In organic systems, the same soil and pest data feeds different decisions: timing for biological pest control, cover crop management, and compost or green manure application, without changing the sensing technology itself.

A Practical Path to Adopting Cultivation Technology
The 2012 ERS adoption figures above show a clear gap: 51% of farms had yield monitors but only 34% had GPS guidance, meaning a meaningful share of farms were collecting yield data without the positioning system to act on it spatially. Closing that gap, on your own operation, follows roughly this sequence regardless of what year you’re reading this:
- Audit your current stack: List what you already have — yield monitor, guidance, variable-rate controllers — against the categories in the ERS adoption data above.
- Start with satellite monitoring: Lowest upfront cost, no new hardware required, establishes a baseline NDVI record for the field.
- Add soil sensors where satellite data flags variability: Target the zones the imagery shows are inconsistent, not the whole farm uniformly.
- Evaluate variable-rate equipment against the FarmDoc cost sheet: Compare purchase cost per acre of capacity (as in the drill table above) against custom-hire rates before buying.
- Recheck NASS QuickStats and the ERS chart series annually: Adoption rates and per-acre values are republished on different schedules — treat every figure in this article as dated to the citation, not to today.
That audit-then-layer sequence is the part of this article that doesn’t expire. The dollar figures will move; the order in which a farm should add sensing, then guidance, then variable-rate control does not.

How Farmonaut Fits This Stack
Farmonaut’s platform is built to sit on top of the equipment and practices covered above rather than replace them:
- Satellite NDVI and soil moisture monitoring, accessible from a web or mobile dashboard
- Customizable field-zone alerts for stress, moisture, and pest risk
- API integration with existing farm equipment and sensor networks
- Support for both conventional and organic soybean certification workflows
FAQs
- Q: How many acres of soybeans did US farmers plant?
A: USDA NASS reported 85.4 million acres planted and 80.4 million acres harvested for the 2025 crop year, with total production of 4.26 billion bushels, published June 30, 2026. Check the NASS Newsroom release for the current crop year’s figures, since this is updated annually. - Q: What percentage of soybean seed is herbicide-resistant?
A: 95% of US soybean planted acres used herbicide-resistant seed varieties in 2025, per USDA NASS. This is reported annually, so the current-year figure may differ from this one. - Q: How much does precision cultivation equipment cost?
A: FarmDoc Illinois priced a 20-foot grain drill at $25,500 (covering ~600 acres) and a 30-foot drill at $46,000 (covering ~1,200 acres) as of 2012 — current dealer pricing will be higher. A full digital precision technology package for a 1,000-acre farm was modeled by USDA ERS at $122,000 with a 95% first-year ROI. - Q: What’s the return on precision agriculture investment for soybeans?
A: USDA ERS and AEM found an average annual value of $118 per acre from precision agriculture on row crops. Use the calculator above to apply that figure, or your own updated number, to your acreage. - Q: Is soybean production tracked for sustainability?
A: Yes — 71% of US soybean production carried SSAP export sustainability verification in the 2024 crop year, and the sector has a published goal of a 10% land-use impact reduction by 2030, per the U.S. Soybean Growers Association. - Q: Can precision agriculture tools work with organic soybean farming?
A: Yes. The same soil, pest, and stress data used in conventional operations informs organic-specific decisions like biological pest control timing and cover crop management, without requiring different sensing hardware.

 IRE Soil
 Blickwinkel
 Agricultural Credit Policy Council
 BayWa
BayWa MCSOD
MCSOD Marei Nursery
 eKGIS
eKGIS Mostas Tech
 Native Seeds
 Andex
Andex FCF India
 Unifrutti Gulf
 Deluxe Conseil
 TVS Electronics
 WICO
WICO Chimera Innovation
