

Vineyard operations · Buyer guide
Vineyard Management Software vs Manual Pest Tracking
US rules give 14 days to record restricted-use sprays, and EU records must be electronic from 1 January 2026. Software with integrated pest monitoring keeps scouting, risk alerts and spray logs on one block map; paper still works for one small block.
Key takeaways
- US restricted-use pesticide records are due within 14 days and kept for 2 years (7 CFR 110.3).
- EU Implementing Regulation 2023/564 requires electronic spray records from 1 January 2026, with 30 days to convert paper entries (Member States may allow longer until 2030).
- The UC Davis powdery mildew risk index moves sulfur intervals from 14-21 days at low pressure to 7 days at high pressure (UC IPM).
- World vineyard area fell 0.8% to 7.0 million hectares in 2025, the sixth yearly decline (OIV, May 2026).
- Manual tracking stays reasonable for a single owner-run block with no buyer audits.
In this article
- Software vs manual tracking: the short comparison
- What the rules require you to record
- How integrated pest monitoring changes spray timing
- Where the world's vineyards are
- How vineyard area is changing
- 10 ways software saves time over manual tracking
- Does software pay for your vineyard
- Wine grape output in Australia by state
- How to choose vineyard management software
- Who should stay with manual tracking
- How we checked the numbers
- FAQ
Vineyard management software with integrated pest monitoring beats manual tracking systems on one thing above all: every scouting note, spray entry and risk alert sits on the same block map, so spray records are complete and audit-ready the day they are made. Paper logs and spreadsheets still work for a few small blocks, but US rules give you only 14 days to record restricted-use applications, and from 1 January 2026 the EU requires spray records in a machine-readable electronic format.
This guide compares the two approaches step by step. It covers what the law asks you to record, how disease-risk models change spray timing, ten ways software saves time, and how to choose a system. Three charts show where vineyards are and how fast they are changing, and a calculator tests whether software pays for your own crew hours.
Software vs manual tracking: the short comparison
Manual tracking means paper scouting sheets, a spray book in the shed, a whiteboard for crew tasks and a spreadsheet filled in at night. Software means the same records entered on a phone in the row, tied to a block, a date and a person, and stored in one place.
| Task | Manual tracking | Software with pest monitoring |
|---|---|---|
| Scouting notes | Paper sheets, often typed up later | Entered in the row, pinned to the block map |
| Disease risk | Grower reads weather and decides | Risk model runs daily from station data |
| Spray records | Spray book, easy to miss a field | Required fields enforced at entry |
| Re-entry and PHI | Worked out by hand | Calculated from the product and date |
| Crew tasks | Whiteboard, phone calls | Task list on each worker’s phone |
| Audit report | Hours of copying and checking | Exported by block and date range |
| Upfront cost | Low | Subscription plus setup time |
The gap is smallest for a single block run by its owner. It grows with each extra block, each extra worker and each market that asks for records in a set format.
What the rules require you to record
Spray records are the part of any vineyard system that an inspector will actually check, so start your comparison here.
United States
The federal floor for restricted use pesticides is set by USDA rules at 7 CFR 110.3. A certified applicator must record, within 14 days of the application:
- Brand or product name and EPA registration number
- Total amount applied
- Location, size of area treated, and the crop or site
- Month, day and year of the application
- Name and certification number of the applicator or supervisor
Those records must be kept for 2 years. Under the EPA Worker Protection Standard, agricultural employers must also show pesticide application details and safety data sheets to workers at a central location during normal work hours. Some states ask for more. California, for example, collects pesticide use reports on all agricultural pesticide use, not only restricted products.
European Union
EU Implementing Regulation 2023/564 sets the content and format of plant protection product records: product name, time, dose, area and crop. It has applied since 1 January 2026. Records must be made without undue delay, and any record not first made in the prescribed electronic format must be moved into it within 30 days of use. Member States can set shorter periods, and for uses before 1 January 2030 they may allow longer ones, as long as every record is in the electronic format by 31 January of the following year.
For an EU vineyard, this means a paper spray book is now only a first draft. Software that writes the record in the right format at entry removes the 30-day copying job.
What to check in a system
When comparing vineyard compliance software, check that each spray entry captures every field above, locks after entry with an edit history, and exports a per-block report by date range. A platform that ties the spray log to the block map and the task sheet the crew used will save the most time at audit. Rules differ by state and country, so check the label and your local rules, and ask your regulator or adviser if you are unsure what applies to you.
How integrated pest monitoring changes spray timing
The biggest difference between software and manual tracking is not storage. It is timing. Disease models turn weather data into a daily risk score, so the spray interval follows the risk instead of the calendar.
A widely used example in grapes is the powdery mildew risk index from UC Davis. The UC IPM grape guidelines explain how it works:
- After the first infections are found, start at 0 and add 20 points for each day with 6 or more continuous hours between 70 and 85°F in the canopy. Until the index reaches 60, a day with fewer such hours resets it to 0, so it takes 3 such days in a row.
- When the index reaches 60, an epidemic is under way.
- Each day after that, add 20 points for a day with 6 or more such hours, and subtract 10 for a day with fewer hours or with 95°F for more than 15 minutes.
- The index stays between 0 and 100.
The index then sets the spray interval. With sulfur, UC IPM suggests 14 to 21 days at low pressure (index 0 to 30), 10 to 17 days at moderate pressure (40 to 50) and 7 days at high pressure (60 or above).
Done by hand, this means reading canopy temperatures every day and keeping a running tally. Many weather stations and vineyard platforms run the model for you. In the eastern US, Cornell’s NEWA grape diseases model gives infection risk and management guidance for black rot, Phomopsis cane and leaf spot, and powdery mildew from local weather stations. UC IPM also advises that you keep checking vines in the field while using the index; a model does not replace scouting.
Scouting still matters
UC IPM describes a simple check: 7 to 10 days after the first infection period, collect 10 to 15 basal leaves from about 20 vines at random and look at the undersides for mildew. In an app, each of those checks is a dated, mapped record. On paper, it is a note that may never reach the spray plan.
Satellite crop monitoring adds a third layer. Vegetation index maps show which parts of a block are growing weaker than the rest, so scouts can walk those rows first. Our vineyard monitoring case study from Victoria follows 781 satellite advisories over 21 months across six small blocks; in the 2025-26 season, 49.5% of planned block-days needed no irrigation.
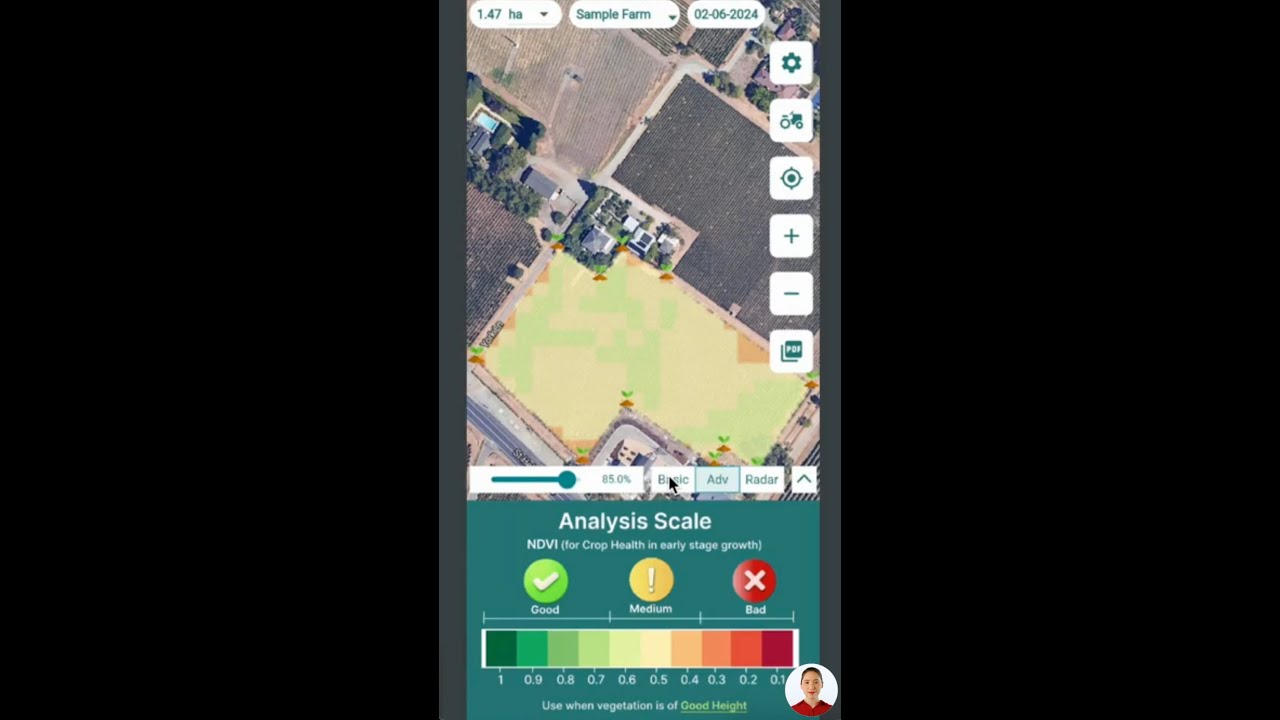
▶ How to read satellite crop maps to decide which rows to scout first. · 4:01
Where the world’s vineyards are
Software choice depends partly on where you farm, because rules, languages and data sources differ. The International Organisation of Vine and Wine (OIV) puts the world vineyard at 7.0 million hectares in 2025, down 0.8% on 2024 and the sixth year of decline in a row (OIV, May 2026). Its area figures cover wine, table and drying grapes, including young vines not yet in production.
Spain, France and Italy each have more than 700,000 hectares. The USA has 415,000 hectares, about 5.9% of the world total. A smaller area does not mean less record-keeping. Each block still needs its own spray and scouting history.
Chart
Vineyard area by country, 2025
Thousand hectares, all grape uses, selected countries (preliminary)
How vineyard area is changing
US vineyard area fell from 446,000 hectares in 2020 to 415,000 in 2025, according to the same OIV table. Chile fell by 27% since 2019, the report says, to 154,000 hectares. Fewer hectares can mean larger operations taking over blocks, and larger operations feel the limits of paper first.
When a grower takes over a neighbour’s block, the old spray history matters. Records held in a shared system move with the block. Records in a spray book often do not.
Chart
Vineyard area, USA and Chile
Thousand hectares, 2020-2025 (2024 provisional, 2025 preliminary)
10 ways software saves time over manual tracking
1. Real-time data collection and analysis
Weather stations, soil moisture probes and satellite maps feed data into one dashboard. Instead of driving every block, managers see which rows need a visit. Early signs of pest pressure or nutrient stress are flagged before they spread.
2. Vineyard inventory management
Software tracks stock of sprays, fertilizer, posts and wire against purchase orders. Each spray entry draws product out of stock automatically, so the shed count and the records match. Low-stock alerts arrive before a spray window, not during it.
3. Automated compliance and reporting
Required fields cannot be skipped, so a record is complete when it is saved. Reports for auditors, buyers and certification schemes come out by block and date range. Alerts flag expiring licences or missing entries.
4. Work order management and scheduling
Each task carries a block, a date, a crew and the materials needed. Mobile access means field crews see changes at once. If rain moves a spray, the manager changes the plan on a phone and the crew sees it.
5. Smart irrigation and spray timing
Systems combine forecasts, evapotranspiration estimates and soil readings into irrigation advice: when, where and how much. For disease, they use risk models such as the index above to set spray intervals. Calibration still matters. Ohio State University Extension notes that how a sprayer is calibrated and operated is as important as which sprayer you choose.
6. Labor and material costing
Hours, materials and machine time are logged per task and per block. That shows the true cost of each operation, and which blocks cost more to farm than they return.
7. Health and safety management
Incident reports, hazard maps, check-ins and emergency plans sit in the same app the crew already uses. Re-entry intervals after a spray show on the block map, which helps keep workers out of treated rows.
8. Contractor management
Contractors can be inducted digitally, their qualifications checked and their time on site logged. This matters for spray contractors, whose records must match yours.
9. Biosecurity measures
Risk areas can be mapped, and visitors and machinery can answer entry questions at the gate. All activity is logged, which makes tracebacks quick if a pest or disease turns up. Export buyers often ask for this history.
10. Data and financial analytics
Operational, crop and financial data come together in dashboards: yield per hectare, cost per tonne, forecast against actual. Season-on-season comparisons show which changes paid off.

▶ Task management and crop health for large farms in one admin app. · 7:27
Does software pay for your vineyard
The main saving is time. Count the hours your team spends each week copying scouting notes, filling in spray books, chasing crew tasks and preparing for audits. Then estimate how much of that time software would remove, and compare the value with the yearly cost of the system. The calculator below does the sum with your own numbers. The defaults are examples set near break-even, not benchmarks.
Two savings are left out of the sum: fewer sprays when a risk model says pressure is low, and lower risk of failing an audit. Both can be larger than the time saved, but they vary too much between vineyards to give one figure.
Try the numbers for your own farm below.
Calculator
Does vineyard software pay for itself?
Enter your own record-keeping hours, wage, expected time saved and software cost.
- Hours saved per season: 60.0 h
- Value of time saved (US$): $1,200
- Break-even share of time saved: 25.0 %
Example values only, set near break-even; they are not benchmarks. Every number is your input. The result counts time saved only, not fewer sprays or lower audit risk.
Wine grape output in Australia by state
In Australia, the Australian Bureau of Statistics puts the 2024-25 wine grape crush at 1.6 million tonnes, up 156,000 tonnes on the year, with a local value of A$1.1 billion (ABS, June 2026, experimental estimates). South Australia crushed 748,000 tonnes, 47.8% of the national total, followed by New South Wales and Victoria.
Large regions like these often have growers selling to several wineries, each with its own spray-diary rules. One digital record that can be exported in each buyer’s format saves the most time here.
Chart
Australian wine grape crush by state, 2024-25
Thousand tonnes, experimental estimates
How to choose vineyard management software
- List your records first. Write down every record you must keep: spray, scouting, labour, irrigation, harvest. Check that the system captures each field.
- Check pest monitoring. Ask which disease models it runs, which weather stations it reads, and whether scouting notes appear on the map.
- Test it in the row. Field staff should be able to enter a spray or a scouting note in under a minute, on a phone, with gloves on and weak signal. Offline entry matters.
- Check integration. Can it read your weather station, irrigation controller and accounting system? An open API helps here.
- Check exports. Make sure you can export your full history in a common format if you change systems later.
- Ask about scale. Will it handle more blocks, more users and more sites as you grow?
- Compare total cost. Add subscription, setup, training and any hardware. Ask vendors for reference customers of a similar size.

▶ A walkthrough of satellite crop monitoring in the web app. · 8:43
Who should stay with manual tracking
Paper and spreadsheets are still reasonable for a single small block run by the owner, with few sprays and no outside buyers asking for records. Keep a bound spray book, fill it in the same day, and copy it into a spreadsheet each month. In the EU, check how your country expects you to meet the electronic format rule.
Once you have hired crews, several blocks, contract spraying or buyers who audit, the hours spent on paper usually grow faster than the vineyard.
How we checked the numbers
Record-keeping rules come from the primary legal texts: 7 CFR 110.3, the EPA Worker Protection Standard page and EU Implementing Regulation 2023/564. Spray-timing rules come from the UC IPM grape guidelines and Cornell NEWA. Vineyard area figures come from the OIV State of the World Wine Sector report (May 2026), and Australian crush figures from the ABS (June 2026). The USDA Economic Research Service report on precision agriculture gives background on technology adoption on US farms. We did not rank named software brands, because features and prices change often.
Related pages on our site: large farm management · carbon footprint tracking · product traceability · supply chain traceability · farm fleet management · crop loan and insurance checks · satellite and weather API docs · API access · web app · Android app · iOS app · grape leaf blister pests
FAQ
What is vineyard management software?
It is a set of digital tools that records and plans vineyard work: scouting, spraying, irrigation, crew tasks, stock, costs and harvest. Versions with integrated pest monitoring add disease-risk models and map-based scouting notes.
Is software better than manual tracking for pest monitoring?
For more than a few blocks, usually yes. Software ties each scouting note and spray to a block and date, runs risk models daily and enforces required record fields. Manual tracking can work for one small block if records are filled in the same day.
How long must spray records be kept in the US?
Federal rules for restricted use pesticides require records within 14 days of application, kept for 2 years. States can require more, so check your state’s rules.
Do EU vineyards have to keep spray records electronically?
Yes. EU Implementing Regulation 2023/564 has applied since 1 January 2026. Records not first made electronically must be moved into the prescribed electronic format within 30 days, or sooner if a Member State says so. Until 2030 a Member State may allow longer, up to 31 January of the following year.
What is the powdery mildew risk index?
A UC Davis model that scores daily temperature conditions in the canopy from 0 to 100. Higher scores mean higher disease pressure and shorter spray intervals. Many weather stations and vineyard platforms calculate it automatically.
Can software automatically work out pre-harvest intervals?
Many systems calculate re-entry and pre-harvest intervals from the product and spray date. Always check the result against the product label, which is the legal reference.
Farmonaut crop monitoring
See which vineyard rows to scout first
Draw your blocks once and Farmonaut shows satellite vegetation and stress maps for them through the season, on web, Android or iOS.




Keep reading
Sources
- Cornell Legal Information Institute, 7 CFR 110.3 Recordkeeping requirements for restricted use pesticides: law.cornell.edu
- US EPA, Agricultural Worker Protection Standard (WPS): epa.gov
- California Department of Pesticide Regulation, Pesticide Use in California: cdpr.ca.gov
- Commission Implementing Regulation (EU) 2023/564 on records of plant protection product use, EUR-Lex: eur-lex.europa.eu
- UC IPM, Grape Pest Management Guidelines: Powdery Mildew: ipm.ucanr.edu
- Cornell NEWA, Grape Diseases Model: newa.cornell.edu
- OIV, State of the World Wine Sector in 2025 (May 2026): oiv.int
- Australian Bureau of Statistics, Australian Agriculture: Horticulture 2024-25 (June 2026): abs.gov.au
- Ohio State University Extension, Sprayers for Effective Pesticide Application in Orchards and Vineyards (FABE-533): ohioline.osu.edu
- USDA Economic Research Service, Precision Agriculture in the Digital Era (EIB-248): ers.usda.gov
- Android app: play.google.com
- iOS app: apps.apple.com
Discussion
Questions, corrections or field experience? Share them below. First-time comments are reviewed before they appear, and your email is never published.
No comments yet. Be the first to add a question or your experience.

 BW Pipelines
 WICO
 Gen Chayat
 Chimera Innovation
 Hiteshi Infotech
 SkyHarvest
 Polaris Digitech
 Teledarbas
 Wild Oak Farm
 SFX
 BACF Africa
 Doodlakine
 Exurbia Geospatial
 FieldZero
 Indico Company

 Licence holder · Niger · Gold
 Client · Tanzania · Gold
 Client · Somalia · Gold
 Client & affiliate partner · Ghana · Gold










