

Reviewed September 2026 against USDA Economic Research Service and USDA NASS survey data.
Try it: Run your own numbers →
The technology used in farming today splits into four working categories: GPS/autosteer guidance, IoT sensors for soil and livestock, satellite-based crop monitoring, and connectivity infrastructure that makes the other three usable. USDA’s Economic Research Service found 27% of US farms had adopted precision agriculture practices as of 2023, but adoption is uneven — 70% of large-scale crop farms use autosteer guidance versus 52% of mid-size operations, and the gap matters more than the headline number. This article walks through what’s actually deployed on US farms, what it costs, and how to check whether a given technology is worth adding to yours.
Unlike a quick AI summary, this page includes farm-size adoption breakdowns, a market-size comparison table, and a calculator you can run with your own field numbers. Every figure below carries its source and the year it was measured, plus a link to where the number gets refreshed.
How Many US Farms Actually Use This Technology
Start with the number that matters most: 27% of US farms reported using at least one precision agriculture practice in 2023, according to USDA’s Economic Research Service Chart of Note series (ERS, 2023). That figure hides a sharp split by farm size. Among mid-size crop farms, 52% use guidance autosteer systems — the GPS technology that keeps tractors on a straight, non-overlapping pass. Among large-scale crop farms, autosteer adoption reaches 70%, and 68% of large-scale farms use yield monitors or yield mapping to track output variability across a field.
The pattern is consistent across every precision technology USDA tracks: bigger operations adopt sooner and more completely, because the fixed cost of a GPS receiver, a monitor upgrade, or a subscription data plan gets spread across more acres. A 200-acre operation and a 5,000-acre operation pay close to the same amount for an autosteer kit, but the per-acre cost is 25 times higher for the smaller farm. That’s the economic logic behind almost every adoption gap in this article, and it’s why the technology used in farming looks different depending on which size class you’re standing in.

These numbers come from USDA’s Agricultural Resource Management Survey data as compiled by ERS, which is refreshed roughly every two years — the next full precision-agriculture adoption dataset is expected in mid-2026. If you’re reading this after that release, go to the ERS chart page directly rather than trusting the percentages above; farm-size adoption gaps have been narrowing year over year as hardware costs fall, so the current split may already be tighter than 52%/70%.
IoT Technology in Agriculture: What It Monitors
“IoT technology in agriculture” specifically means networked sensors and devices that report data without a person walking the field to collect it — soil probes, weather stations, livestock ear tags, and machinery telematics that all push readings to a dashboard or app. This is a subset of precision agriculture, not a synonym for it: autosteer guidance and yield mapping (covered above) are precision ag technologies, but they’re not IoT unless the equipment is networked and reporting continuously.
What US IoT Deployments Actually Track
- Soil sensors: Moisture, temperature, and in some systems nutrient/EC readings, reported at intervals (typically hourly) to trigger irrigation decisions.
- Weather stations: On-farm microclimate data — rainfall, wind, humidity, growing degree days — used to time spraying and frost protection.
- Machinery telematics: GPS location, fuel use, and diagnostic data streamed from tractors and combines to a fleet dashboard.
- Livestock tags and collars: Movement, temperature, and activity data used for herd health and heat detection.
There is no USDA figure yet that isolates “IoT sensor adoption” as its own category separate from precision agriculture broadly — the ERS chart cited above groups autosteer, yield mapping, soil mapping, and variable-rate technology together under precision practices. That’s a genuine gap in the published data (noted in USDA’s own survey scope), and if your business decision hinges on sensor-specific adoption numbers, the method to get closer is: pull USDA NASS’s Technology Use Survey directly (link below), which breaks out connectivity and device categories separately from ERS’s practice-level adoption figures.
IoT Applications: Field-by-Field Breakdown
For readers searching “IoT applications” specifically, here is where the connected-device layer sits inside a working farm, mapped to the four places it actually earns its cost back.
1. Soil and Crop Monitoring
Networked soil probes report moisture and temperature continuously, feeding into irrigation controllers that apply water on a schedule set by real field conditions rather than a calendar. Farmonaut’s satellite layer complements ground sensors here — multispectral imagery flags moisture stress and vegetation health across whole fields between sensor placements, and pairs with large-scale farm management tools for operations running multiple fields under one dashboard.
2. Livestock Tracking and Management
Ear tags, collars, and connected feeding stations report location, feeding pattern, and activity level continuously. This is the application area with the clearest US adoption trail — see the sow and herd monitoring section below.
3. Machinery Automation
GPS-guided tractors, sprayers, and combines report position and performance data to reduce overlap and input waste. This is the same technology behind the 52%–70% autosteer adoption figures cited above from USDA ERS.
4. Data Analytics Layered on Top
Raw sensor readings only become useful once software turns them into a decision — irrigate today or wait, spray this block or skip it. This is where dashboards, advisory systems, and satellite-derived indices sit in the stack, translating device data into an action a farmer or farm manager can execute the same day.

The Connectivity Problem Behind the Adoption Gap
None of the sensor or guidance technology above works without a data connection, and this is the piece most articles on farm technology skip. USDA NASS’s Technology Use Survey, released in August 2025, found that 55% of US farms have broadband internet access, while 74% of US farms reach the internet through a cellular data plan (USDA NASS, August 2025). That gap — cellular coverage running well ahead of fixed broadband — explains why a lot of IoT hardware marketed to US farms is built around cellular or LPWAN radios rather than assuming a home broadband connection will reach the barn or the back forty.
If you’re evaluating an IoT sensor system and the vendor’s spec sheet assumes Wi-Fi range from a farmhouse router, check your cellular signal strength at the actual sensor placement site before buying — the 19-point gap between broadband and cellular access nationally means a meaningful share of US farmland is cellular-only, and coverage varies field to field in ways no national statistic can tell you. USDA NASS’s Technology Use Survey is conducted biennially, with the next release expected in 2027; check the survey guide link above directly for updated figures once that cycle publishes.
Precision Ag Market Size and Where the Money Goes
The dollar figures around this technology vary by which market boundary the analyst draws, and it’s worth being specific rather than citing a single number as if it were settled. Precedence Research put the US precision farming market at $4.37 billion in 2025 (Precedence Research, 2025). A separate market analysis sized the narrower “US precision agriculture technologies” segment at $2.1 billion in 2024, projected to reach $4.3 billion by 2032 (P&S Market Research). The difference between the two isn’t a contradiction — it reflects different scope definitions (equipment-only versus equipment-plus-software-plus-services), which is common in ag-tech market sizing and worth checking before you cite either number in a business plan.
Within North America’s precision farming market, GPS and GNSS guidance systems hold the largest single technology share at 37.5% as of 2025, according to MarketsandMarkets (MarketsandMarkets, 2025) — consistent with the ERS adoption data showing autosteer as the most widely used precision technology on US farms.

Market-size forecasts for this sector update quarterly as new analyst reports publish. If you’re citing a figure for planning purposes, pull the most recent version directly from Precedence Research or the vendor named above rather than reusing the numbers here past their publication year.
Top Agricultural Technologies Ranked by Adoption
Ranking “top agricultural technologies” by actual US farm adoption — not by press coverage — the order looks like this, based on the USDA ERS 2023 figures cited throughout this article:
- GPS/autosteer guidance — 70% of large-scale crop farms, 52% of mid-size farms (USDA ERS, 2023)
- Yield monitors and yield mapping — 68% of large-scale crop farms (USDA ERS, 2023)
- Cellular connectivity for farm operations — 74% of US farms (USDA NASS, August 2025)
- Broadband internet access — 55% of US farms (USDA NASS, August 2025)
- Any precision agriculture practice — 27% of all US farms regardless of size (USDA ERS, 2023)
Notice that connectivity infrastructure (broadband, cellular) shows higher adoption than the farm-management practices built on top of it. That’s the correct order for a technology stack to mature in — the network has to exist before the sensor network built on it makes sense — and it’s a useful signal for where adoption is headed next: as rural cellular coverage improves, expect the precision-practice adoption gap between mid-size and large farms to narrow, since connectivity rather than practice complexity is often the binding constraint for smaller operations.
Livestock IoT: Sow and Herd Monitoring Systems
Sow farming technology — the automation and sensor layer applied to breeding-herd pig operations — follows the same IoT pattern described above, applied to livestock instead of fields. Three components make up most commercial deployments:
- Automated feeding systems: Feeders that dispense measured, individualized rations based on a sow’s stage of gestation or lactation, reducing feed waste compared to uniform group feeding.
- Wearable health monitors: Ear tags or collars tracking temperature, movement, and activity level to flag illness or stress before visible symptoms appear.
- Climate-controlled housing: Networked sensors managing barn temperature, humidity, and ventilation automatically, which reduces piglet mortality linked to environmental stress.
There isn’t a USDA-published national adoption percentage specific to sow-barn IoT the way there is for row-crop autosteer — livestock technology adoption isn’t broken out at that granularity in the ERS precision-agriculture series. If sow-specific adoption data matters for your decision, the National Pork Board and USDA’s Livestock, Dairy, and Poultry outlook reports are the right places to check for sector-specific figures, since this article’s brief doesn’t carry a citable number for that segment.



Rice Farming Technology: A Specialized Case
Rice production uses a distinct technology set because of standing-water field management, and it’s worth a dedicated look rather than folding it into row-crop figures above. Direct seeding replaces manual transplanting to cut labor and shorten planting cycles. The System of Rice Intensification (SRI) combines optimized plant spacing with precise water management, increasingly guided by soil-moisture sensor data rather than fixed schedules. Multispectral drone surveillance flags pest and nutrient issues across paddies too large to walk. For a deeper breakdown of these methods, see our dedicated piece on rice farming innovations.

Calculator: Is Autosteer Guidance Worth It on Your Acreage?
Since GPS/autosteer guidance is the single most-adopted precision technology in the USDA figures above (52%–70% depending on farm size), use your own acreage and overlap rate to see where the input savings from reduced overlap cross the cost of the equipment.
Run your own numbers
Assumes overlap reduction is the only saving counted (excludes labor time, fuel efficiency, or yield-map benefits, which are additional). Uses your own input cost per acre — replace the default $180/acre with your actual combined seed, fertilizer, and fuel spend for an accurate result. Does not account for financing costs on the system purchase.
Satellite Monitoring: The Layer Above the Sensors
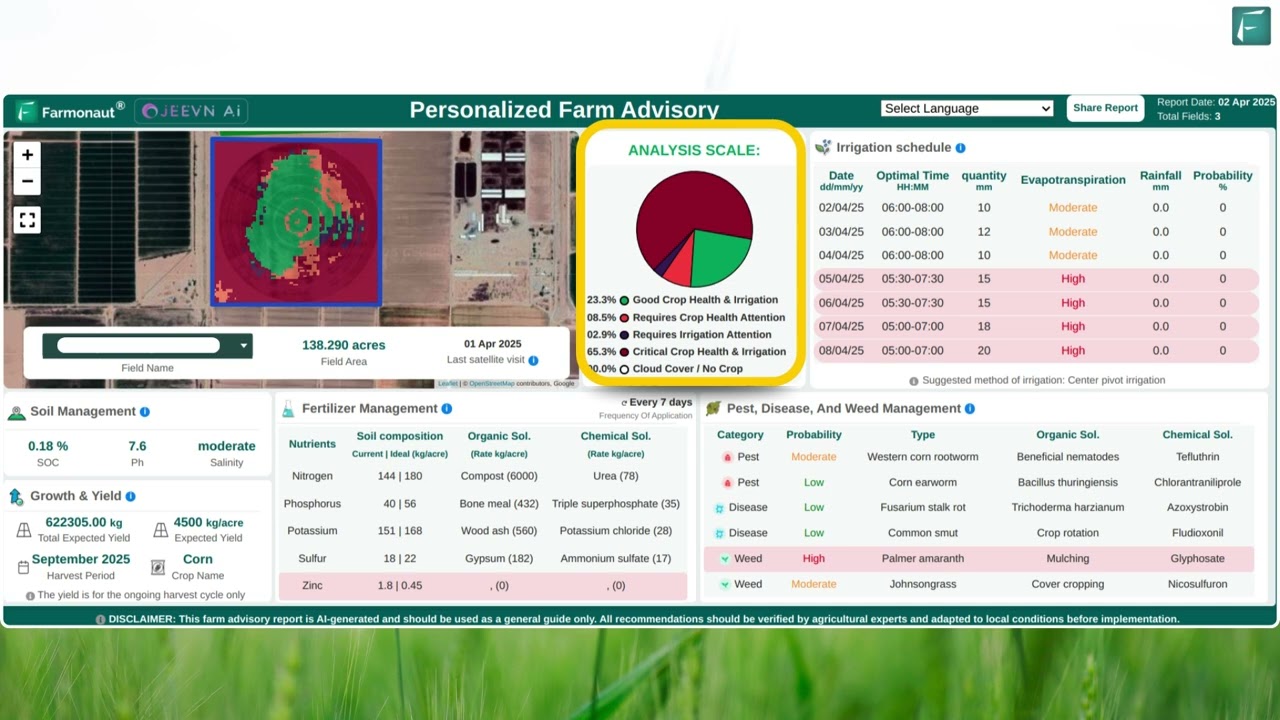
Ground sensors and guidance systems solve a field-by-field or barn-by-barn problem. Satellite monitoring solves a whole-operation problem — checking vegetation health, moisture stress, and growth patterns across every field without a truck or drone trip. Farmonaut’s platform uses multispectral satellite imagery for real-time crop health monitoring, paired with the web/mobile app and API access for teams that want to pull the data into their own systems. Integration details are in the developer documentation.

Beyond Crop Health: The Rest of the Stack
- Jeevn AI advisory: Combines satellite data, weather, and field history into a specific recommendation rather than a raw index number.
- Blockchain traceability: Farmonaut’s traceability solution tracks agricultural products from field to buyer for supply-chain verification.
- Fleet and resource management: A single dashboard for machinery, irrigation systems, and logistics — see the fleet management platform.
- Carbon footprinting: Field-level emissions tracking through the carbon footprinting product, relevant for operations reporting into voluntary or buyer-required sustainability programs.
- Financial access: Satellite-verified data supporting crop loan and insurance applications.

This layer also extends to controlled-environment production — see our coverage of indoor farming innovations for how satellite and sensor data intersect with vertical farming operations that don’t depend on field conditions at all.

Want scalable, multi-field oversight? The Large Scale Farm Management platform is built for agribusinesses and cooperatives managing acreage across multiple regions from one dashboard.

Farmonaut Subscription Options
Explore real-time monitoring plans below and choose the tier that fits your operation’s size:
Technology Comparison Table: Adoption, Cost Driver, and Source
| Technology | US Adoption Figure | Farm Segment | Year Measured | Source |
|---|---|---|---|---|
| Any precision agriculture practice | 27% | All US farms | 2023 | USDA ERS |
| Autosteer/guidance systems | 52% | Mid-size crop farms | 2023 | USDA ERS |
| Autosteer/guidance systems | 70% | Large-scale crop farms | 2023 | USDA ERS |
| Yield monitors/maps | 68% | Large-scale crop farms | 2023 | USDA ERS |
| Cellular internet access | 74% | All US farms | August 2025 | USDA NASS |
| Broadband internet access | 55% | All US farms | August 2025 | USDA NASS |
| GPS/GNSS guidance market share | 37.5% of PA market | North America | 2025 | MarketsandMarkets |
Every row above lists the year the figure was measured because these numbers move: ERS’s precision-agriculture practice data is tied to USDA’s Agricultural Resource Management Survey cycle (next full release expected mid-2026), and NASS’s connectivity figures come from a biennial Technology Use Survey (next expected 2027). Bookmark the source links, not this table, if you need the current number a year from now.
Frequently Asked Questions
-
What technology is most used in US farming today?
- GPS/autosteer guidance is the most widely adopted precision technology, used on 70% of large-scale US crop farms and 52% of mid-size crop farms as of 2023 (USDA ERS). Overall, 27% of all US farms report using at least one precision agriculture practice.
-
What is IoT technology in agriculture?
- It refers to networked sensors and devices — soil probes, weather stations, livestock tags, machinery telematics — that report data continuously to a dashboard or app, enabling decisions based on real-time field or barn conditions rather than fixed schedules.
-
What are the main IoT applications in farming?
- Four core areas: soil and crop monitoring (moisture/nutrient sensors feeding irrigation systems), livestock tracking (tags and collars for health and location), machinery automation (GPS-guided equipment), and data analytics that turn sensor readings into actionable recommendations.
-
Why does technology adoption differ so much between small and large farms?
- Fixed equipment and subscription costs spread across more acres on larger operations, lowering the per-acre cost. USDA figures show this directly: 70% adoption of autosteer on large-scale farms versus 52% on mid-size farms, with connectivity (55% broadband access nationally) as an additional constraint for smaller or more remote operations.
-
How big is the US precision agriculture market?
- Estimates vary by scope: Precedence Research put the US precision farming market at $4.37 billion in 2025, while P&S Market Research sized the narrower precision agriculture technologies segment at $2.1 billion in 2024, projected to reach $4.3 billion by 2032. Check both sources directly for revised figures, since ag-tech market sizing updates quarterly.
-
Where can I try Farmonaut’s satellite and IoT-complementary tools?
- Explore the Web App, Android App, or iOS App. For API/data integration, see the API and developer docs.







Conclusion: Match the Technology to Your Farm Size, Not the Headline
The technology used in farming isn’t one adoption curve — it’s several, moving at different speeds depending on farm size and connectivity. GPS/autosteer guidance leads at 52%–70% depending on scale (USDA ERS, 2023). Cellular connectivity, at 74% of US farms, runs ahead of broadband access at 55% (USDA NASS, August 2025), which explains why so much current IoT hardware is built around cellular rather than fixed internet. Precision agriculture as a whole still sits at 27% of all US farms, meaning most of the country’s farmland has room to adopt technology already proven on the operations that have.
Use the source links throughout this article — USDA ERS, USDA NASS, and the market research citations — to pull updated figures as new survey cycles publish, and use the calculator above to check whether autosteer specifically pencils out on your own acreage rather than relying on a national average that may not match your overlap rate or input costs.

 Godrej Agrovet
 Hayleys Agriculture
 Linx Agritech
 Adinet
 Save Your Soils
 GalaxEye Space
 Grandstream Algérie
 XOS Realty
 Geospatial Lab Africa
 Agro La Gándara
 HIPSAC
 ZOL Zimbabwe
 Juligerm
 AdBio
AdBio MISE Maroc
 NWNS
NWNS Red August Group
 Farm Inc
 WeMe Global
 Agrotoken
 Blue BearX
 Insignito
 DnCubed
 Indosistim Teknologi
 Liquify Digital
 CU Foods
 BeyondTech Global
 Rouge VC
 AgroRisk
 Oath Inc
 Esri North East Africa
 MDCV UK
 Etech Consulting Madagascar
 Vestlandsforsking
 WB Dev
 Sama Premium
 Tres Valles
 Blickwinkel
 Agricultural Credit Policy Council
 eKGIS
eKGIS Mostas Tech
 Andex
Andex Deluxe Conseil
 WICO
WICO Chimera Innovation
 SkyHarvest
 Teledarbas
 Exurbia Geospatial
 FieldZero
