

Reviewed August 2026 against North Dakota Agricultural Weather Network (NDAWN), Ohio State University Extension, and Nature Scientific Reports.
Try it: Run your own numbers →
Table of Contents
- What Is a GDU in Farming? Quick Answer
- GDU Full Form and What “GDUs” Means
- GDU Formula: How to Calculate a GDU
- Wheat GDU: Base Temperature, Stages, and the 32°F Threshold
- Wheat GDU Estimator (Interactive Calculator)
- Corn GDU: The 86/50 Method and Maturity Targets
- GDU Thresholds by Crop: Comparison Table
- GDU and Weather: Why Warming Trends Change the Count
- GDU vs GDD: Is There a Difference?
- Using GDUs: Planting, Pest Timing, and Harvest Windows
- Farmonaut: Automated GDU and Weather Tracking
- Limitations: What GDUs Don’t Tell You
- Farmonaut Subscription Plans
- Frequently Asked Questions
- Next Steps
- Try it: Run your own numbers
What Is a GDU in Farming? Meaning, Formula & Calculator
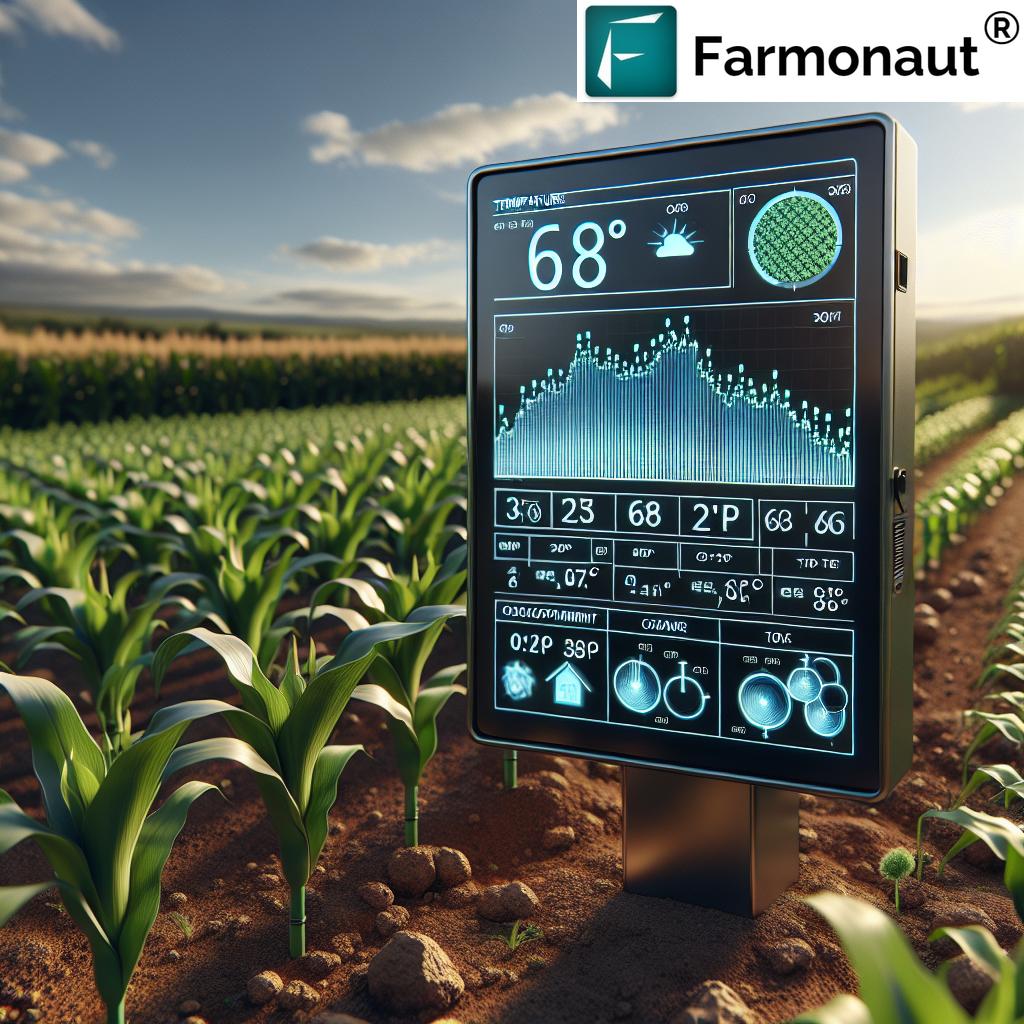
A GDU (Growing Degree Unit) is a daily measure of accumulated heat above a crop’s minimum growth temperature — for corn that floor is 50°F, for wheat it is 32°F. Farmers add up daily GDUs from planting or spring greenup to track exactly where a crop sits between emergence and maturity, instead of guessing from the calendar. A 110-day corn hybrid needs about 2,670 GDUs to reach physiological maturity, per Kansas State University; wheat reaches kernel watery ripe at about 1,825 GDD from emergence, per the North Dakota Agricultural Weather Network (NDAWN).
GDU and GDD (Growing Degree Days) are the same measurement under two names — both describe heat units, not calendar days. Below, we break down the exact formula, the base temperatures agronomists actually use, a wheat-specific stage table, and a calculator you can run with your own field’s temperatures.




GDU Full Form and What “GDUs” Means
The GDU full form is Growing Degree Unit — sometimes written in the plural as GDUs when referring to an accumulated total (“this field has 1,400 GDUs since planting”). It is the same underlying concept as a GDD (Growing Degree Day); both terms describe one day’s worth of heat above a crop’s base temperature, summed across the season. Corn agronomy in the US Corn Belt tends to say “GDU,” while wheat and small-grain literature more often says “GDD”.
- GDU = Growing Degree Unit (singular measure or accumulated total)
- GDD = Growing Degree Day (identical calculation, more common in wheat/small-grain contexts)
- Both track heat accumulated above a species-specific base temperature — never total temperature
GDU Formula: How to Calculate a GDU
The standard GDU formula, used by NDAWN and Ohio State University Extension (OSU), is:
GDU = [(Tmax + Tmin)/2] – Tbase
Where Tmax and Tmin are the day’s high and low temperature, and Tbase is the crop’s minimum growth threshold. If the result is negative — the day’s average fell below the base — it is set to zero; a plant does not “owe” GDUs for a cold day, it simply banks none. Two adjustments matter for accuracy:
- Corn caps Tmax at 86°F before averaging (the “86/50” method) — temperatures above 86°F don’t accelerate corn development further, per NDAWN’s corn GDD guidance (NDAWN).
- Wheat caps Tmax at 70°F prior to Haun stage 2.0 — a separate, lower ceiling than corn’s, reflecting wheat’s cooler-season physiology (NDAWN wheat GDD reference).
Worked Example — Corn (Tbase = 50°F)
Suppose today’s high was 82°F and the low was 54°F. Average = (82 + 54) / 2 = 68°F. GDU = 68 – 50 = 18 GDUs for the day. Do this every day from planting and add the running total; OSU Extension’s corn GDD factsheet documents this exact 50°F base and the accuracy case for using it over calendar-day counting (Ohio State University Extension).
Worked Example — Cold Day (Below Base)
High 52°F, low 38°F, base 50°F. Average = 45°F. GDU = 45 – 50 = -5, set to 0 GDUs. No growth is credited for that day regardless of how close the average came to the threshold.
A 2018 study in Nature Scientific Reports found that a nonlinear GDD calculation reduces phenological (growth-stage) prediction error by about 1 day compared with the standard linear method above — useful context if you’re comparing GDU tools that use slightly different math (Nature Scientific Reports, 2018).
Pro Tip: For programmatic, automated GDU and weather tracking, use the
Farmonaut Satellite & Weather API and
Developer Docs for integration.

Wheat GDU: Base Temperature, Stages, and the 32°F Threshold
Wheat’s base temperature is 32°F (0°C) in the model used by North Dakota State University’s NDAWN network, and notably colder than corn’s 50°F base, reflecting wheat’s tolerance for cool-season growth (NDAWN wheat GDD help page). NDAWN’s wheat model tracks accumulation against named growth stages (the “Haun stage” scale), not just a single maturity number:
| Growth Stage | Haun Stage | Accumulated GDD from Emergence/Greenup |
|---|---|---|
| Emergence | 0.5 | 180 GDD |
| 8-leaf stage increment | — | +143 GDD per stage after emergence |
| Heading begins | 10.2 | 1,567 GDD |
| Kernel watery ripe | 12.0 | 1,825 GDD |
NDAWN does not publish totals past kernel watery ripe (Haun 12.0), because requirements for later stages vary considerably (NDAWN). One more wheat-specific rule: before Haun stage 2.0, daily T max is capped at 70°F in the calculation, and at 95°F after that stage (NDAWN), which is why a wheat GDU total and a corn GDU total from the same weather station are never directly comparable.
Wheat GDU Estimator (Interactive Calculator)
Enter your accumulated wheat GDD since emergence or greenup, and this estimator tells you the nearest named growth stage using the NDAWN thresholds above.
Run your own numbers
Assumptions: uses the standard GDD formula (Tbase = 32°F), the 70°F pre-Haun-2.0 cap when selected, and NDAWN’s published stage thresholds (emergence 180, heading 1,567, kernel watery ripe 1,825 GDD). It does not account for variety-specific vernalization needs, frost damage, or moisture stress — confirm against your local NDAWN station or extension office before making input decisions.
Corn GDU: The 86/50 Method and Maturity Targets
Corn’s base temperature is 50°F, with a daily high cap of 86°F — together called the “86/50 method,” the current standard documented by both OSU Extension and NDAWN. NDAWN does not estimate corn growth stages; Kansas State University puts a 110-day hybrid at about 1,500 GDUs to silking and 2,670 GDUs to black layer (K-State). Seed company maturity ratings (e.g., “108-day corn”) are themselves calibrated against GDU accumulation, not calendar days — which is why the same hybrid planted in a cool spring can take noticeably longer in actual days to reach the same growth stage.
OSU Extension’s corn factsheet also makes the accuracy case directly: GDU-based maturity tracking outperforms simple calendar-day counting because it responds to the actual heat the crop experienced, not an assumed average season (OSU Extension AGF-101).

GDU Thresholds by Crop: Comparison Table
The two crops with the most reliable published thresholds are corn and wheat; use the table below as your reference, and treat any other crop’s numbers as ones to confirm against your regional extension office before relying on them for input timing.
| Parameter | Corn | Wheat |
|---|---|---|
| Base temperature (Tbase) | 50°F | 32°F |
| Daily high-temperature cap | 86°F (“86/50 method”) | 70°F (before Haun stage 2.0) |
| Emergence threshold | 90–120 GDU (K-State) | 180 GDD (Haun stage 0.5) |
| Mid-season milestone | About 1,500 GDU to silking (110-day hybrid, K-State) | Heading begins at 1,567 GDD (Haun stage 10.2) |
| Full maturity target | About 2,670 GDU to black layer (110-day hybrid, K-State) | Not published by NDAWN past kernel watery ripe (1,825 GDD) |
| Source | K-State corn maturity; NDAWN corn GDD | NDAWN wheat GDD |
Note: These figures are the standard NDAWN/OSU thresholds as documented in the sources linked above. Hybrid- and variety-specific maturity ratings will shift the exact numbers for your seed choice — check your seed tag or local extension office for variety-level GDU-to-maturity conversions.
GDUs in Celsius, and Stage Totals for Corn and Wheat
Outside the US, growing degree days are usually counted in °C. The formula is the same, only the thresholds change. One °C degree day equals 1.8 °F degree days, so a total of 1,000 GDD in °C is 1,800 GDD in °F.
- Corn: base 10 °C (50 °F), daily high capped at 30 °C (86 °F) (NDAWN).
- Wheat: base 0 °C (32 °F), daily high capped at 21 °C (70 °F) before Haun stage 2.0 and at 35 °C (95 °F) after it (NDAWN).
| Crop and stage | Accumulated GDD (°F) | Source |
|---|---|---|
| Wheat: emergence (Haun 0.5) | 180 | NDAWN |
| Wheat: leaf 2 fully extended (Haun 2.0) | 395 | NDAWN |
| Wheat: flag leaf emerged (Haun 8.0) | 1,255 | NDAWN |
| Wheat: heading begins (Haun 10.2) | 1,567 | NDAWN |
| Wheat: flowering begins (Haun 11.4) | 1,739 | NDAWN |
| Wheat: kernel watery ripe (Haun 12.0) | 1,825 | NDAWN |
| Corn: emergence | 90–120 | Kansas State University |
| Corn: silking (110-day hybrid) | about 1,500 | Kansas State University |
| Corn: black layer, physiological maturity (110-day hybrid) | about 2,670 | Kansas State University |
NDAWN counts wheat from emergence and does not publish totals past kernel watery ripe, because later stages vary too much between years and varieties. Corn figures shift with hybrid maturity and planting date, so check the GDU rating on your seed tag.
GDU and Weather: Why Warming Trends Change the Count
GDU totals are entirely a function of the weather a field actually experiences, which is why “gdu weather” is its own common search — growers want to know how a warming or cooling season shifts their accumulation. Climate Central’s analysis of 246 US weather stations found that 97% showed an increase in growing degree days between 1970 and 2021 (Climate Central), meaning most of the country now accumulates heat units faster across a season than it did five decades ago (Climate Central). Practically, that means:
- Hybrid and variety maturity ratings calibrated on older climate data may now mature faster than their label suggests, in station-level terms.
- A warm spring can pull a corn crop through its early GDU milestones several days ahead of a “normal” year at the same station.
- Because Climate Central’s dataset refreshes annually as each growing season finalizes, check the current seasonal maps directly on climatecentral.org rather than relying on a fixed percentage indefinitely — search “growing degree days” on their site for the latest station-level update.
For live daily accumulation rather than a historical trend, NDAWN itself updates its wheat and corn GDD figures every day during the growing season at ndawn.ndsu.nodak.edu, driven by that day’s temperature observations.
GDU vs GDD: Is There a Difference?
No — GDU and GDD describe the identical calculation. The distinction is dialect, not method: seed companies and many Corn Belt agronomists say “GDU,” while wheat, small-grain, and pest-modeling literature (and much of the academic literature, including the Nature study cited above) says “GDD.” If a tool or article claims GDUs and GDDs are computed differently, check its formula against the NDAWN pages linked in this article — both use Tbase-subtracted daily averages with a crop-specific high-temperature cap.
Using GDUs: Planting, Pest Timing, and Harvest Windows
Tracking accumulated GDUs turns three recurring farm decisions from guesswork into a heat-based schedule:
- Hybrid/variety selection and planting date: Match a hybrid’s GDU-to-maturity rating against your region’s typical seasonal accumulation before the first fall frost risk, rather than against a fixed calendar date.
- Input timing: Fertilizer, fungicide, and growth-regulator applications are frequently keyed to a growth stage (e.g., wheat heading at 1,567 GDD) rather than a day count, because the stage — not the date — is when the plant is physiologically ready to respond.
- Pest life-cycle timing: Many insect pests progress through temperature-linked life stages (egg–larva–pupa–adult) in the same way crops do. Tracking regional GDU accumulation alongside crop stage lets growers time scouting and control measures to when a pest is actually vulnerable, rather than spraying on a fixed calendar.
Want more efficiency for plantations and forestry? Farmonaut’s crop plantation & forest advisory solutions can help manage these tasks at scale!
Cross-reference your own accumulation against USDA NASS Crop Progress reports, which publish weekly phenology data during the growing season (corn planted, emerged, silking, dough, dented, mature and harvested; winter wheat headed and harvested; USDA NASS) — comparing your field’s GDU-predicted stage against the regional NASS-reported stage is a fast sanity check on whether your local weather station is representative.
Farmonaut: Automated GDU and Weather Tracking
Farmonaut removes the manual step of pulling daily highs and lows and running the formula yourself.
- AI-based Satellite Crop Health Monitoring: Multi-spectral imagery and remote sensing let you monitor crop health, vegetation indices (NDVI), soil moisture, and GDU accumulation together in one view, so a stage prediction can be checked against what the field is actually doing.
- Jeevn AI Advisory System: Combines GDU accumulation, weather models, and crop-stage data into input, harvest, and pest-timing recommendations.
- Blockchain Traceability: Traceability tools track agricultural products from farm to shelf, useful where buyers require stage- and input-verified records.
- Resource & Fleet Management: Fleet management tools schedule machinery and logistics around predicted GDU milestones like emergence and maturity, cutting idle equipment time.
- Carbon Footprinting: The Carbon Footprinting module tracks environmental impact alongside GDU-based production data.
- Crop Loan and Insurance Verification: Satellite-based verification for crop loans and insurance uses real-time crop monitoring, including GDU-derived stage data, to support underwriting decisions.
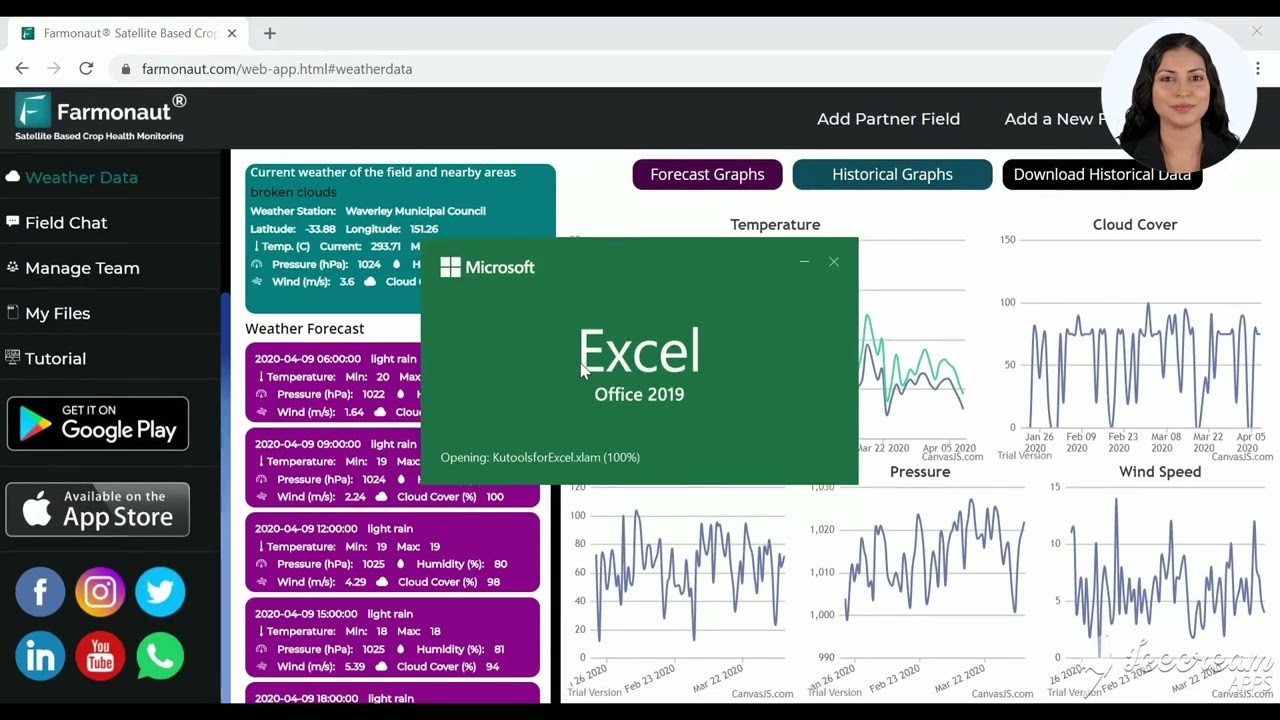
For automated daily accumulation rather than manual formula work, use the Farmonaut Satellite & Weather API, documented at the developer docs.

Limitations: What GDUs Don’t Tell You
GDUs measure heat accumulation only — they do not account for everything that determines whether a crop actually reaches the stage the number predicts:
- Moisture and nutrients aren’t in the formula. A crop can hit its GDU target for a stage and still underperform if soil moisture or nutrient availability was limiting during that window.
- The relationship is treated as linear between the base and cap temperatures, which is why the corn 86°F and wheat 70°F caps exist — without them, an unusually hot day would over-credit growth the plant didn’t actually make.
- Station-level GDU ignores field microclimate — slope, aspect, and soil type can shift a specific field’s effective heat accumulation away from the nearest weather station’s reading.
- Thresholds are species- and variety-specific. The 50°F/86°F and 32°F/70°F figures above are the published corn and wheat standards; other crops and specific varieties carry their own bases that aren’t interchangeable with these.
- No published USDA figure directly ties GDU-informed management to a yield gain (e.g., a specific bushel-per-acre improvement) — the published research supports GDU’s accuracy for predicting stage timing, not a quantified yield benefit, so treat GDU as a timing tool rather than a yield-guarantee metric.
Bottom line: use GDUs alongside on-the-ground scouting, soil and moisture sensor data, and regional NASS Crop Progress figures — not as a standalone predictor.
Farmonaut Subscription Plans for Farm and Resource Management
Ready to pair GDU tracking with satellite crop monitoring and actionable advisories? Farmonaut offers scalable, subscription-based plans for individual growers, cooperatives, and large agribusinesses. Sign up directly for the plan that fits your operation below.
Frequently Asked Questions: GDU in Farming
1. What is a GDU in farming?
A GDU (Growing Degree Unit) is the amount of heat, above a crop’s base temperature, accumulated in a single day — corn’s base is 50°F, wheat’s is 32°F. Farmers sum daily GDUs from planting or greenup to track progress toward emergence, heading, and maturity.
2. What does GDU stand for (GDU full form)?
GDU stands for Growing Degree Unit. It is functionally identical to a GDD (Growing Degree Day) — the same formula under a different name, commonly used interchangeably in US corn and wheat agronomy.
3. What is the GDU formula?
GDU = [(Daily Max Temperature + Daily Min Temperature) / 2] − Base Temperature. If the result is negative, set it to zero. Corn caps the daily max at 86°F before averaging; wheat caps it at 70°F before Haun stage 2.0.
4. What is a wheat GDU, and how is it different from corn?
Wheat uses a 32°F base temperature and a 70°F cap before Haun stage 2.0 (95°F after), versus corn’s 50°F base and 86°F cap, per NDAWN. Wheat reaches heading at 1,567 accumulated GDD and kernel watery ripe at 1,825 GDD.
5. How many GDUs does corn need to mature?
A 110-day hybrid needs about 2,670 GDUs under the 86/50 method to reach black layer, per Kansas State University. Specific hybrids carry their own GDU-to-maturity ratings on the seed tag.
6. Does Farmonaut offer tools for GDU monitoring?
Yes. Farmonaut provides satellite-based field monitoring, AI advisory, and weather tracking that folds in GDU analytics automatically. Explore the Farmonaut App to get started, or integrate directly via the Satellite & Weather API.
7. Does weather variability change my GDU count year to year?
Yes — GDU accumulation depends entirely on the temperatures a field actually experiences. Climate Central found 97% of 246 US stations analyzed showed rising growing degree days between 1970 and 2021, so a field’s typical season-end total can differ meaningfully from a decade-old baseline; check current station data via NDAWN or Climate Central’s seasonal maps rather than relying on a historical average alone.
8. What are the limitations of using only GDUs for crop management?
GDUs don’t account for soil moisture, nutrient availability, or field microclimate, and no published USDA study quantifies a specific yield gain from GDU-informed management. Use GDUs alongside on-farm scouting, sensor data, and NASS Crop Progress reports.
GDU in Farming: Conclusion & Next Steps
A GDU quantifies one thing precisely: heat accumulated above a crop’s base temperature on a given day. Corn’s 50°F base and 86°F cap, and wheat’s 32°F base and 70°F cap, are the two published US standards worth memorizing — everything else, from emergence to heading to maturity, is a running total against those numbers. The formula itself hasn’t changed and won’t: what changes year to year is the weather feeding it, which is exactly why a live data source matters more than a static number.
Ready for the next step? Start applying GDU tracking with:
-
Farmonaut’s Satellite & AI Crop Monitoring App
for real-time field insights -
Large Scale Farm Management solutions
for cooperative, institutional, or corporate field operations -
Carbon Footprint Tracking and Management
for sustainability compliance and branding
For agronomic practices that pair with GDU-based timing, see top agro-ecological practices, and for the broader ag-tech landscape GDU tools sit within, see agriculture technology innovations.
Discussion
Questions, corrections or field experience? Share them below. First-time comments are reviewed before they appear, and your email is never published.
No comments yet. Be the first to add a question or your experience.

 Chimera Innovation
 Hiteshi Infotech
 Clubhouse OS
 Progenseed
 SkyHarvest
 Polaris Digitech
 Teledarbas
 Wild Oak Farm
 SFX
SFX BACF Africa
 Doodlakine
 Exurbia Geospatial
 FieldZero
 Indico Company
