NDVI Vegetation Index: 7 Powerful Ways to Boost Crop Health
“NDVI can detect crop stress up to 10 days before visible symptoms appear, enabling earlier intervention and management.”
Summary: Why NDVI Is Transforming Crop Health
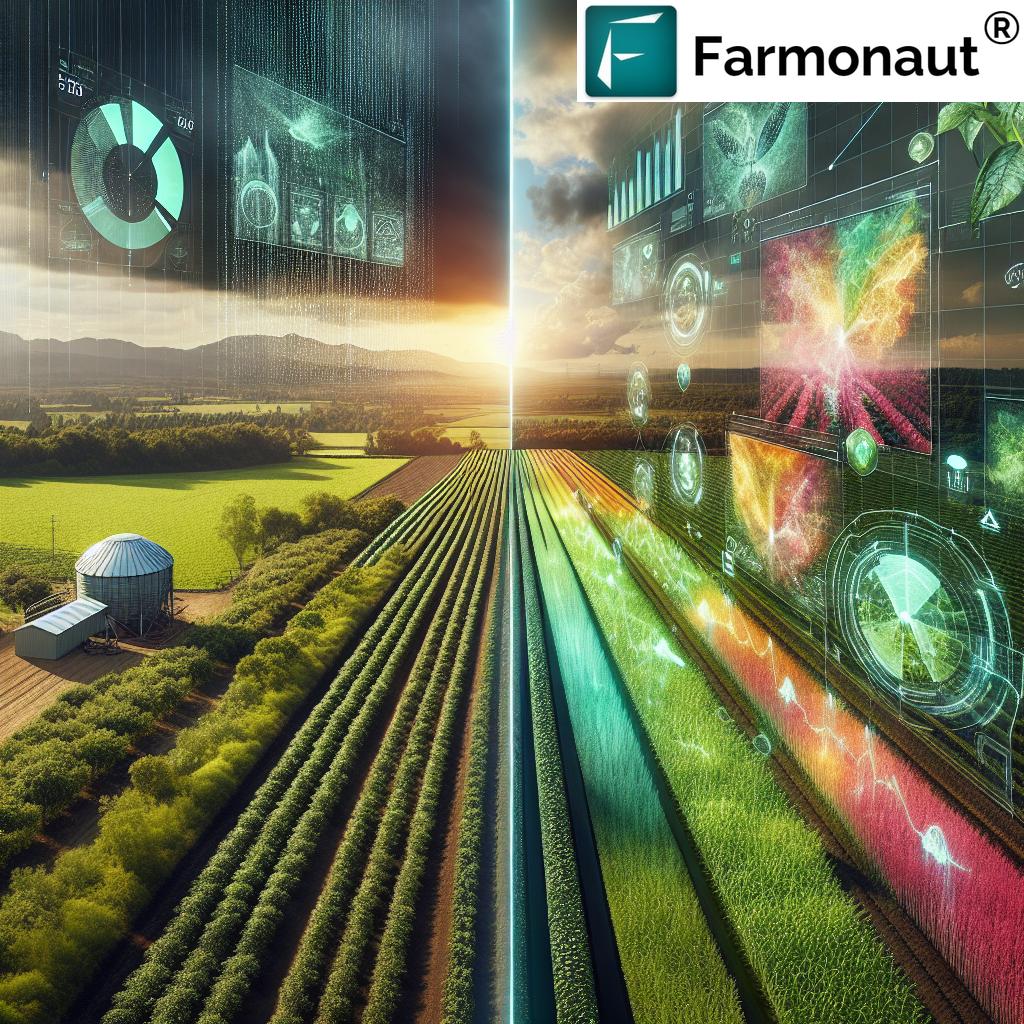
The Normalized Difference Vegetation Index (NDVI) is revolutionizing vegetation health assessment across agriculture, farming, and forestry. By analyzing the reflectance of red and near-infrared (NIR) light, NDVI delivers actionable insights on plant vitality, stress detection, and resource allocation. Farmers and foresters use NDVI to inform crop management—from satellite crop monitoring and yield prediction to precision application of water and fertilizers. This innovation drives agricultural productivity optimization and supports sustainable, data-driven decision-making at field, farm, and regional scales.
NDVI’s importance extends beyond monitoring crops; it’s central to deforestation monitoring, early detection of crop stress, and ecosystem management. As a pioneering agri-technology provider, we at Farmonaut leverage NDVI monitoring to provide real-time crop health insights on our Android, iOS, web app, and via API. Our platforms enable farmers to optimize their resources, minimize losses, and make smart, timely decisions.
“Over 80% of precision agriculture systems worldwide use NDVI data for yield prediction and vegetation monitoring.”
Understanding NDVI: The Science Behind the Vegetation Index
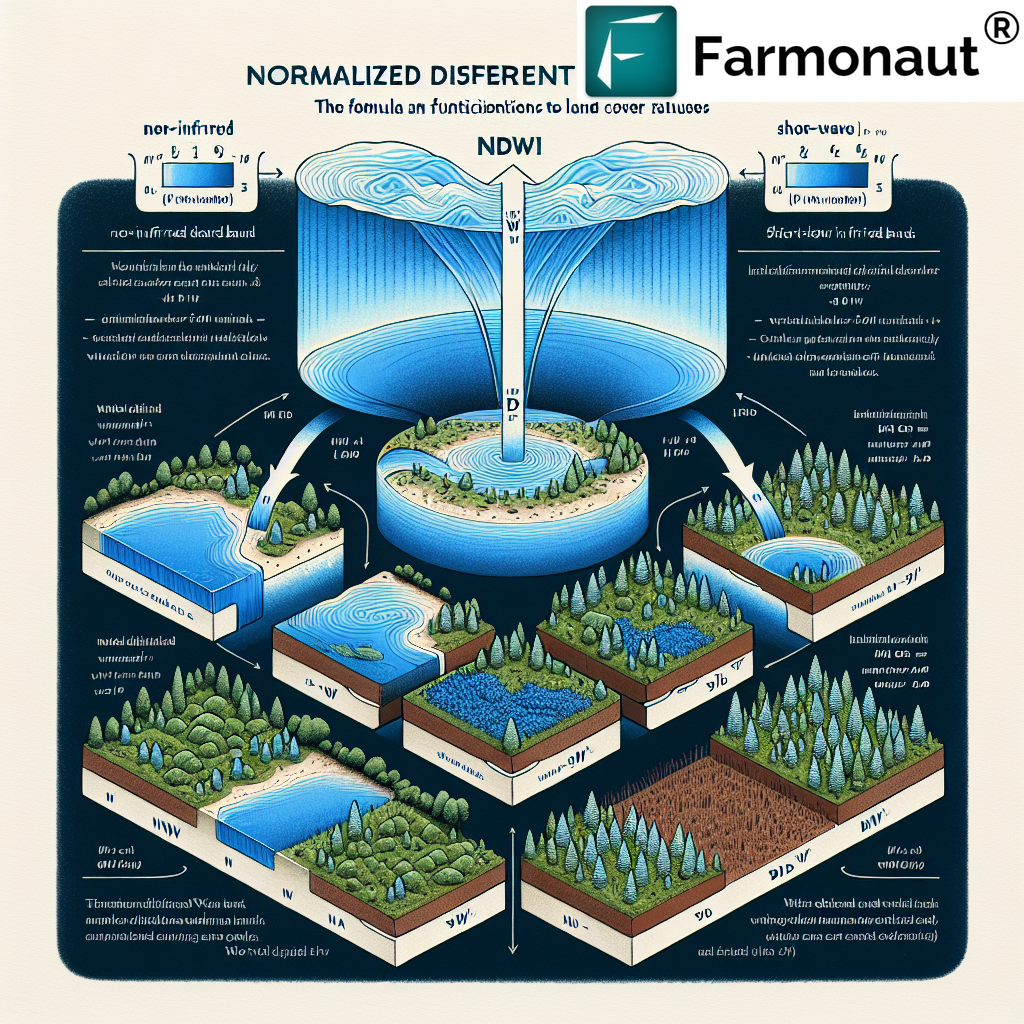
The Normalized Difference Vegetation Index (NDVI) is a quantitative tool that assesses vegetation health and density using remote sensing technology. It’s calculated via the following formula:
NDVI = (NIR – Red) / (NIR + Red)
- NIR represents the near-infrared reflectance from the vegetation surface.
- Red denotes the visible red light reflectance, which is strongly absorbed by chlorophyll during photosynthesis.
- Healthy plants absorb much red light and reflect a large portion of NIR light, resulting in higher NDVI values—closer to +1.
- Stressed, sparse, or dead vegetation absorbs less red and reflects less NIR, moving indices toward zero or negative values.
NDVI values range from -1 to +1:
- <0.2: Indicates barren land, bare soil, or areas with negligible vegetation.
- 0.2–0.5: Underlines sparse vegetation or potential crop stress.
- >0.5: Denotes vigorous, dense, healthy vegetation.
NDVI Ranges and Crop Health Interpretation
| NDVI Range | Crop Health Status | Recommended Action |
|---|---|---|
| < 0.2 | Barren land/Bare soil or Dead vegetation | Check for seeding; apply soil amendments; initiate planting/preparation activities. |
| 0.2–0.3 | Poor/Stress Detected | Intensify irrigation; monitor for nutrient deficiencies or pest pressure; act quickly on early crop stress signs. |
| 0.3–0.5 | Moderate Health | Review irrigation and nutrition; plan scouting for disease or insect outbreaks; prepare targeted interventions. |
| 0.5–0.7 | Healthy Vegetation | Maintain current practices; optimize resources for continued healthy growth. |
| > 0.7 | Excellent/Dense Coverage | Monitor for possible disease outbreaks due to humidity; plan harvest timing; potential for high yields. |
NDVI Vegetation Index: 7 Powerful Ways to Boost Crop Health
Modern agriculture faces complex challenges: climate variability, population growth, and sustainable intensification. NDVI monitoring stands out as an essential solution—empowering farmers, agronomists, and foresters by providing actionable data and insights for targeted interventions. Let’s explore the 7 key applications driving productivity and sustainability across agriculture and forestry:
1. Crop Health Monitoring
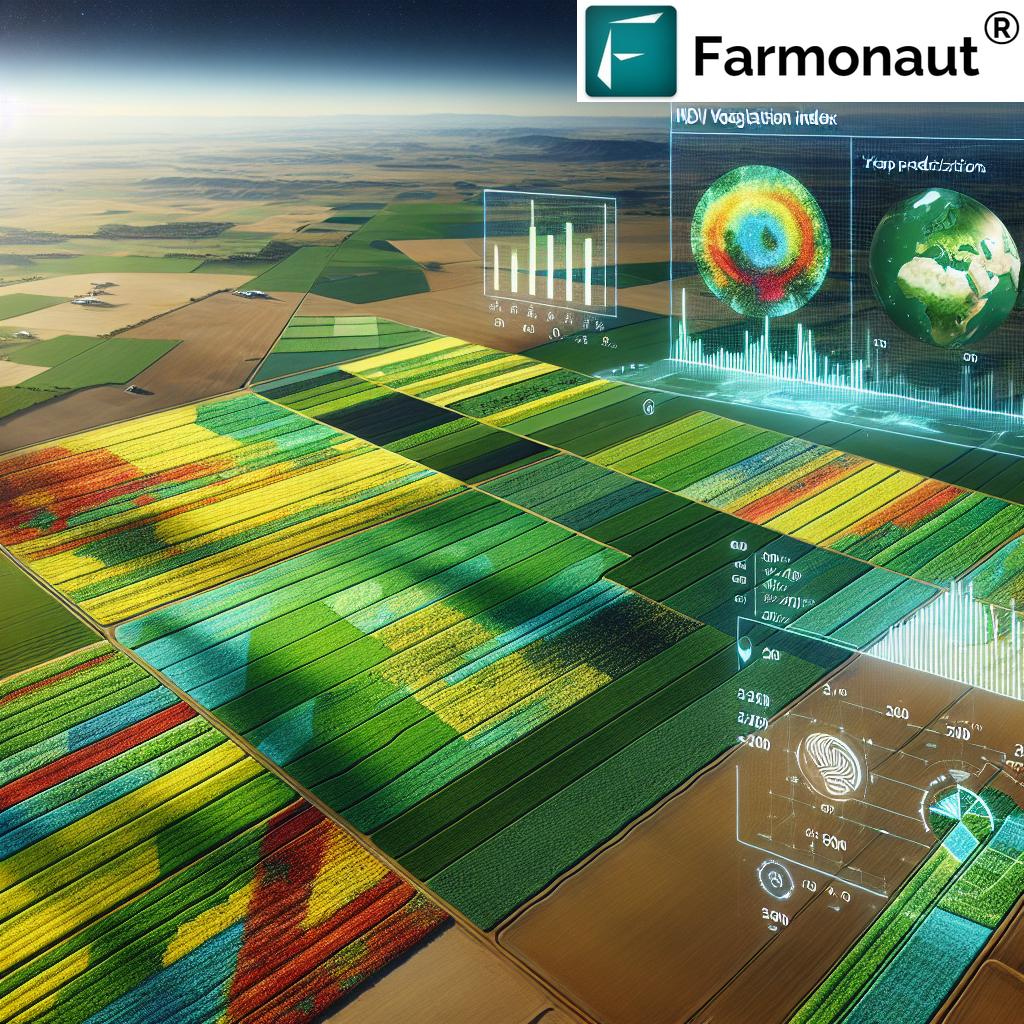
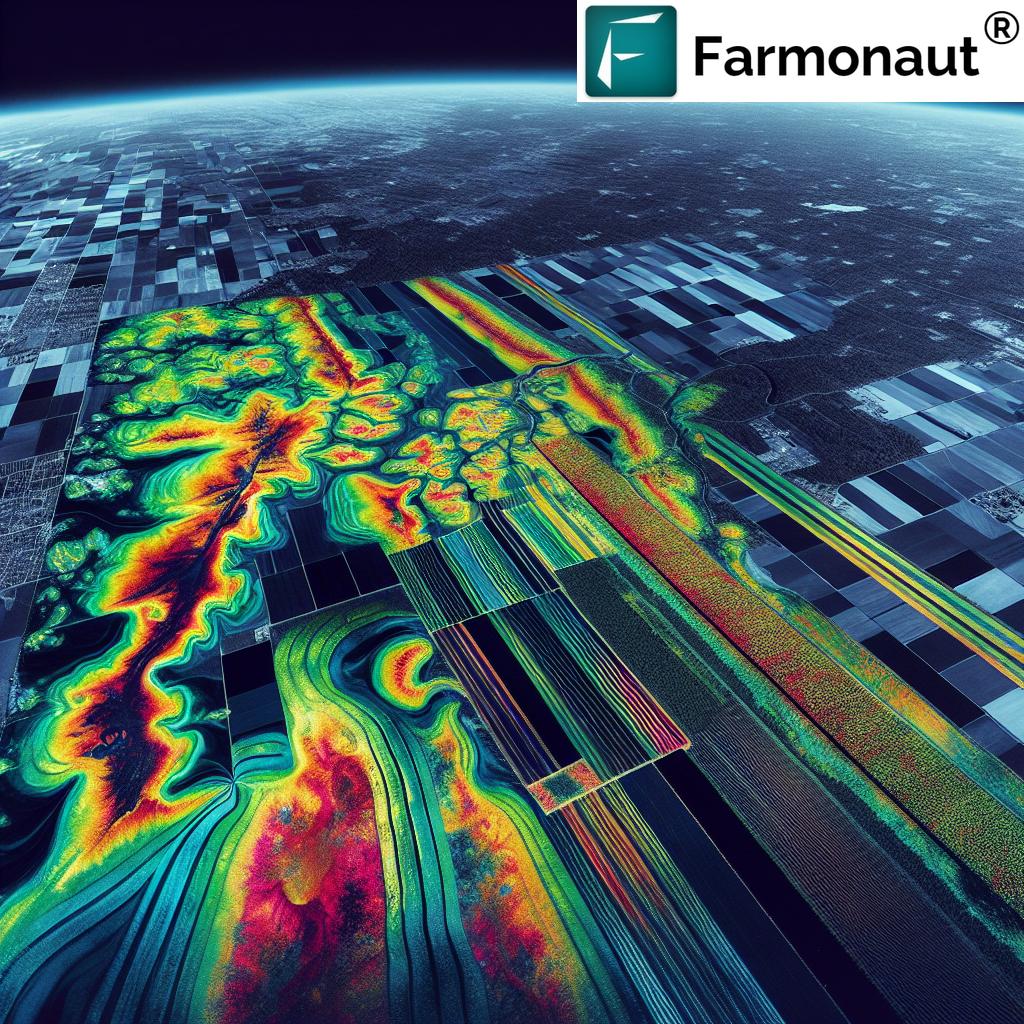
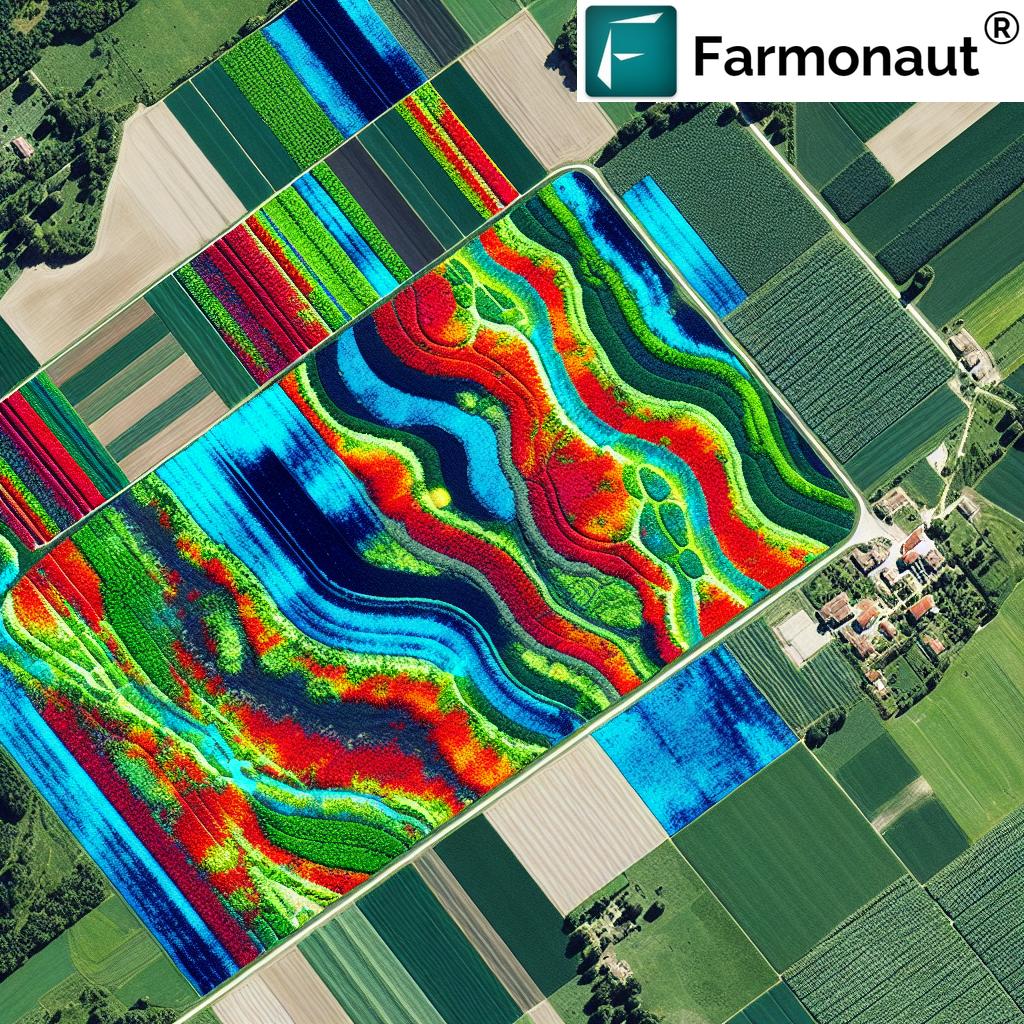
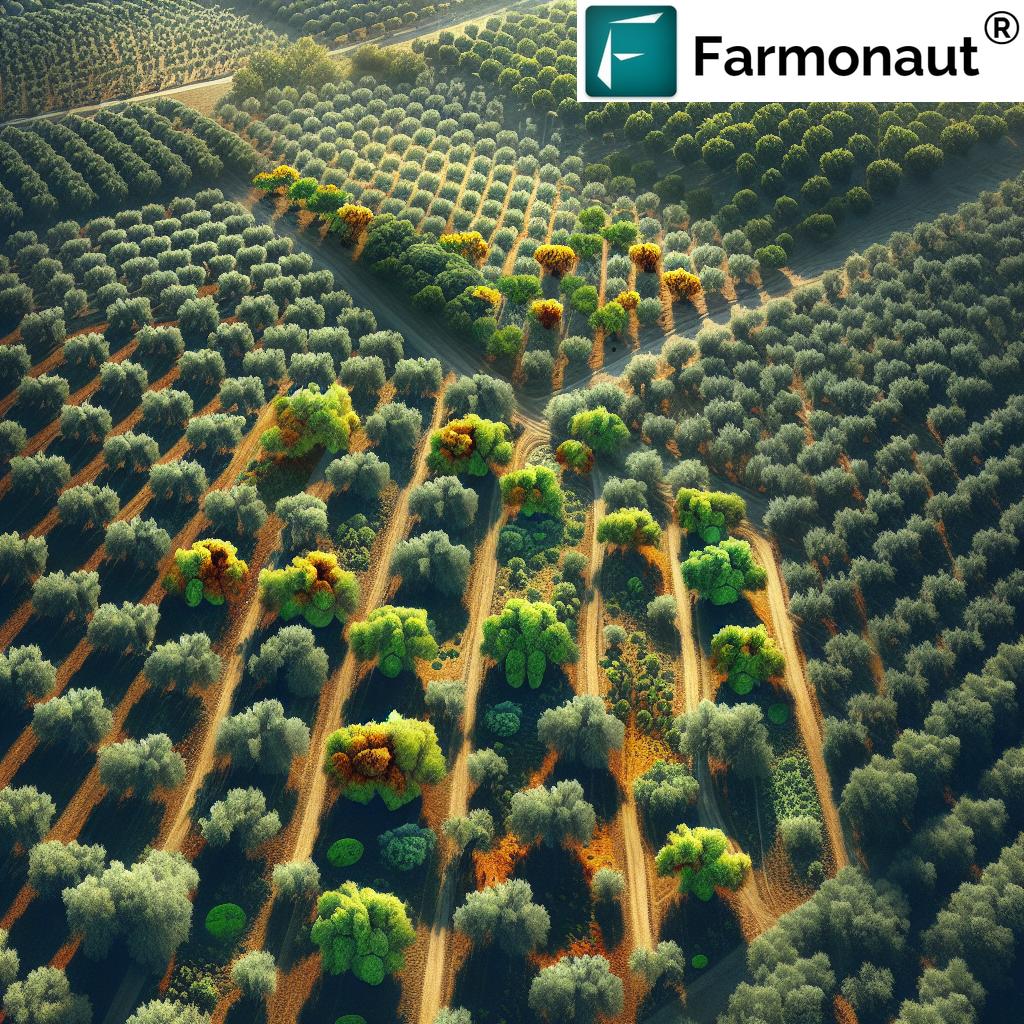
NDVI-based crop health monitoring is a game-changer for modern farming. By frequently analyzing NDVI maps, farmers can assess spatial changes in crop vitality and spot early signs of stress. Because NDVI reflects chlorophyll content and biomass, any deviation from normal values helps highlight issues long before visual symptoms emerge.
- Identifies nutrient deficiencies early—NDVI “hot spots” flag areas requiring supplemental fertilizer.
- Pinpoints pest infestations, fungal, or viral disease outbreaks at field scale.
- Supports targeted management, maximizing resource use and minimizing losses through early detection and rapid intervention.
- Helps maintain spatial consistency in crop health, thus supporting uniform growth and higher overall yields.
Using our Farmonaut platform, users can access real-time NDVI maps to monitor field performance, enabling precision interventions and timely management.
2. Yield Prediction Using NDVI
NDVI’s quantitative assessments of vegetation health and density play an integral role in crop yield prediction models. By analyzing temporal NDVI data throughout the growing season, patterns in plant growth and health are revealed, enabling:
- Accurate estimation of hectares with uniform crop development or zones needing attention.
- Forecasts of final output volumes, supporting decisions on harvesting schedules, labor, and logistical planning.
- Better resource allocation and risk reduction for stakeholders, including financial institutions.
This data-centric approach is vital for agricultural supply chain management. Financial institutions also benefit by satellite-based crop monitoring for loan and insurance verification. Learn how Farmonaut’s Crop Loan & Insurance Service leverages NDVI to streamline access to credit and insurance for farmers.
3. Irrigation Management with Remote Sensing
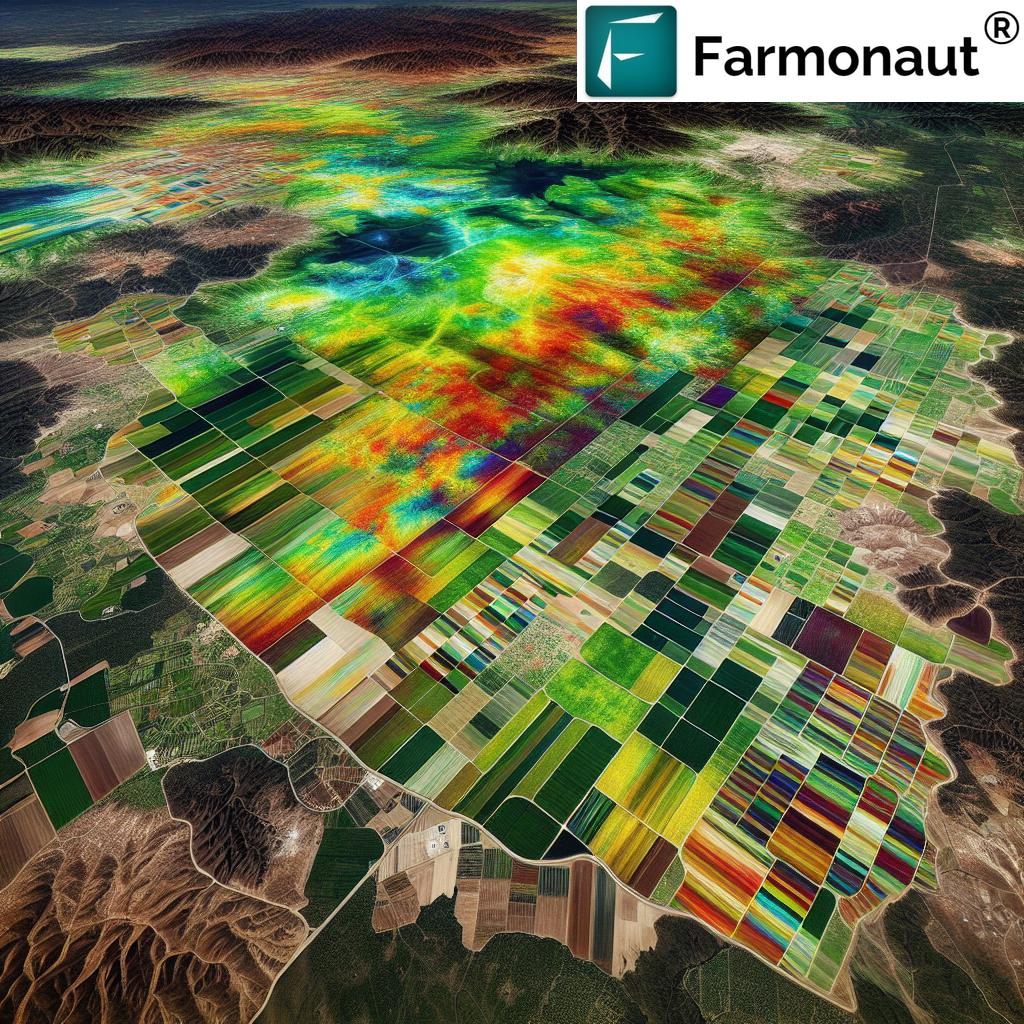
Efficient irrigation management is critical for crop health, water conservation, and farm profitability. NDVI maps highlight moisture stress and areas with varying water requirements across large fields:
- Detects zones of water scarcity for targeted irrigation.
- Aids optimization of irrigation schedules to avoid both waterlogging and under-watering.
- Supports sustainable practices by ensuring water is used efficiently—conserving resources and reducing input costs.
When combined with soil moisture data and weather forecasts (all available on Farmonaut’s dashboard), NDVI-driven irrigation recommendations lead to maximized crop health and yield.
4. Fertilizer Application and Precision Inputs
One of the most valuable applications of NDVI in precision agriculture is Variable Rate Application (VRA) of fertilizers. By mapping spatial NDVI variation:
- Farmers apply nutrients only where needed, increasing input efficiency.
- Reduces fertilizer waste, minimizing environmental impact.
- Promotes sustainability and supports compliance with environmental standards.
- Boosts returns-on-investment—more yield per unit of input.
On our Farmonaut app, NDVI-driven VRA maps help in prescription planning and tracking, directly impacting crop outcomes.
5. Early Detection of Crop Stress
NDVI enables early intervention against crop stressors—including drought, insect infestations, or emerging diseases:
- High-frequency satellite imagery and NDVI analysis detect sub-field-level changes up to 10 days before visible symptoms appear.
- Farmers gain lead time for targeted intervention (spraying, irrigation, or field scouting).
- Minimizes yield losses; prevents stress from affecting the entire field.
- Supports targeted control measures, optimizing budget and effort.
Early detection of crop stress using NDVI is at the heart of precision agriculture. Experience this on the Farmonaut platform for field-by-field and real-time insights.
6. Forest Health Assessment & Deforestation Monitoring with NDVI
NDVI extends its powerful insights beyond crops, becoming indispensable in forestry and large-scale vegetation monitoring:
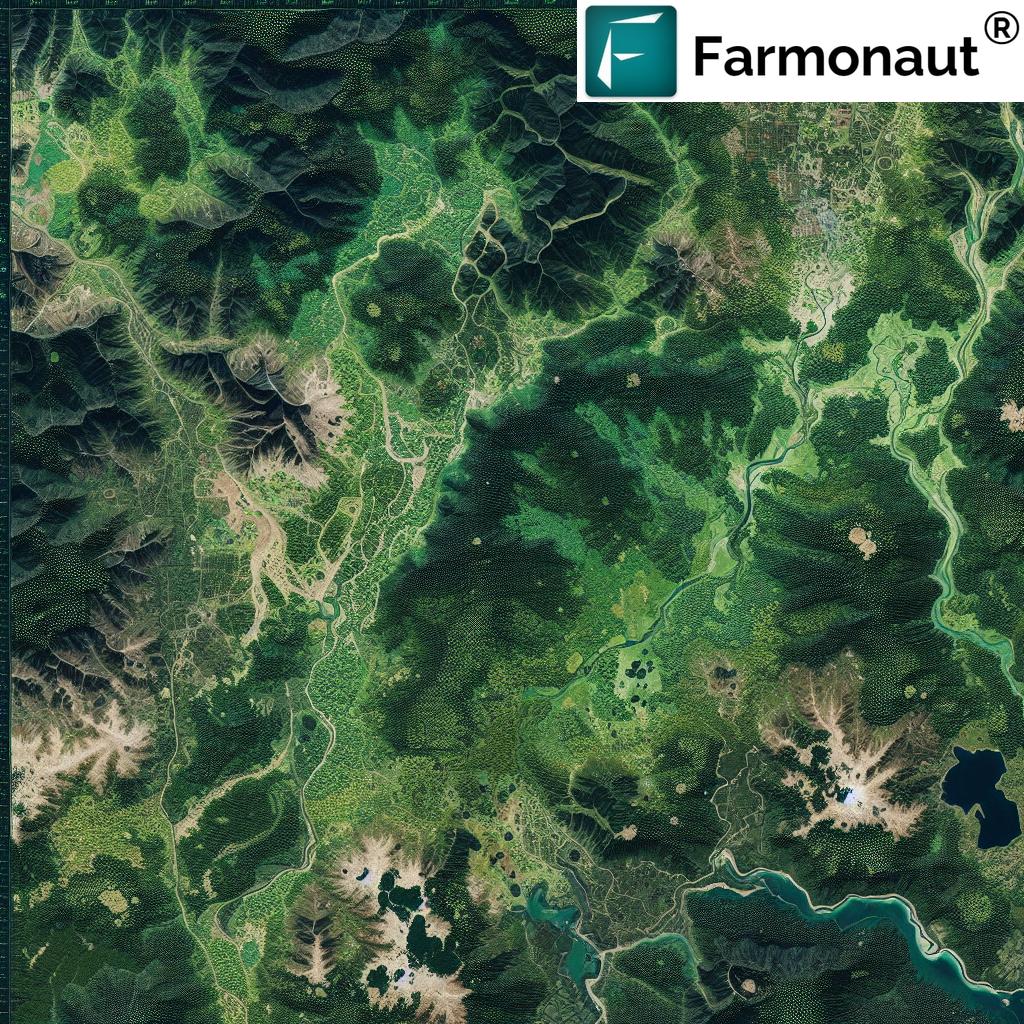
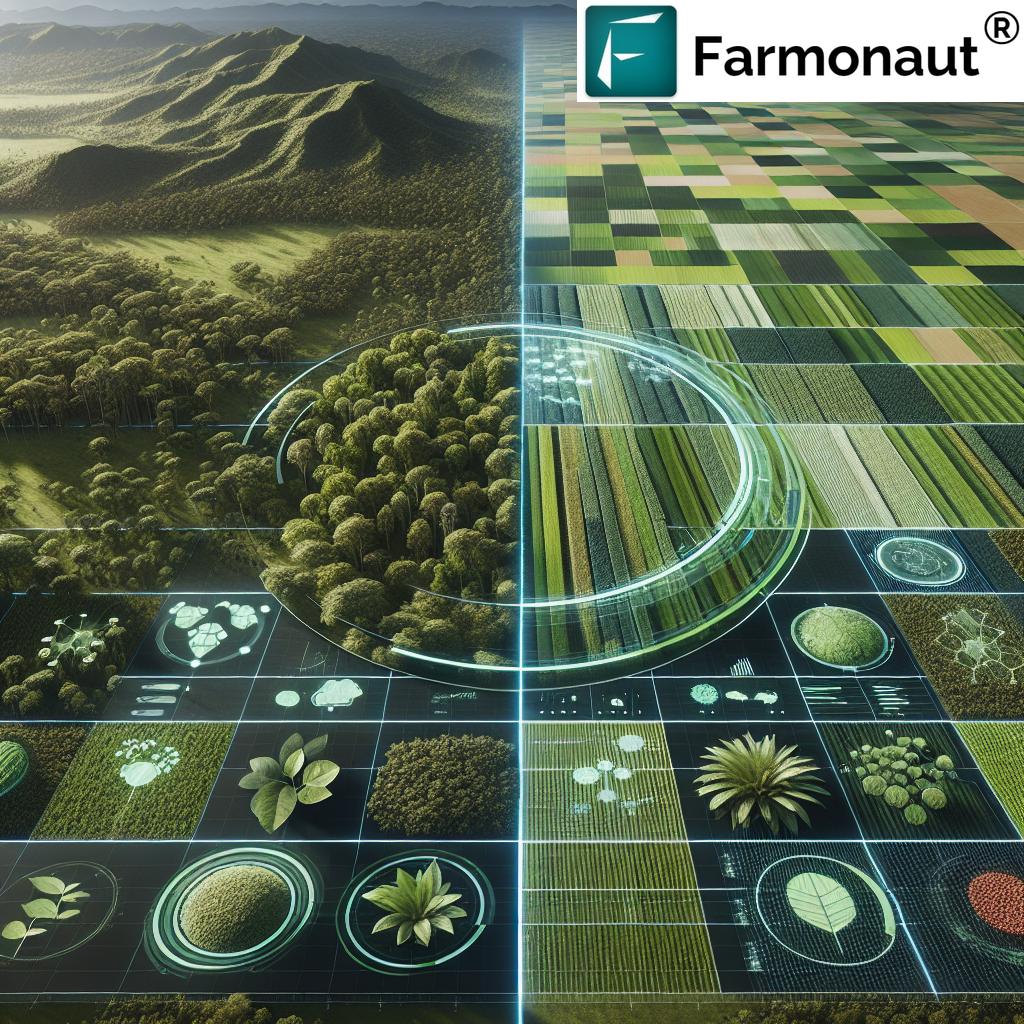
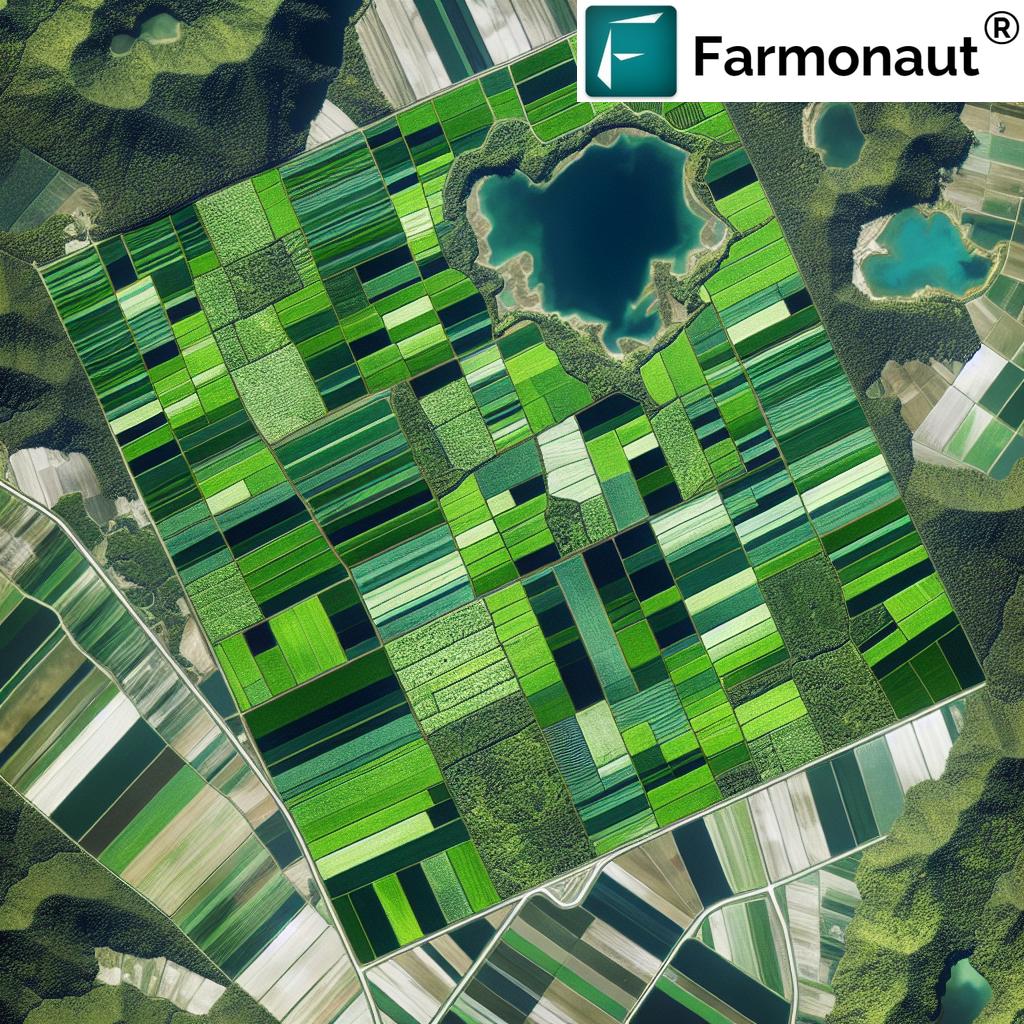
- Provides forest health assessments—identifying areas of low density, dieback, or regrowth.
- Detects outbreaks of disease and insect infestation in otherwise-inaccessible woodlands.
- Quantifies biomass changes, natural events impact (fires, storms), and supports reforestation efforts.
- Critical for deforestation monitoring with NDVI—tracking human activities and natural land-use changes over time.
NDVI data, accessed through Farmonaut’s Forest Advisory Service, is a cornerstone for conservation efforts and sustainable land management.
7. Ecosystem Monitoring and Environmental Applications
NDVI also underpins regional landscape management and ecosystem monitoring:
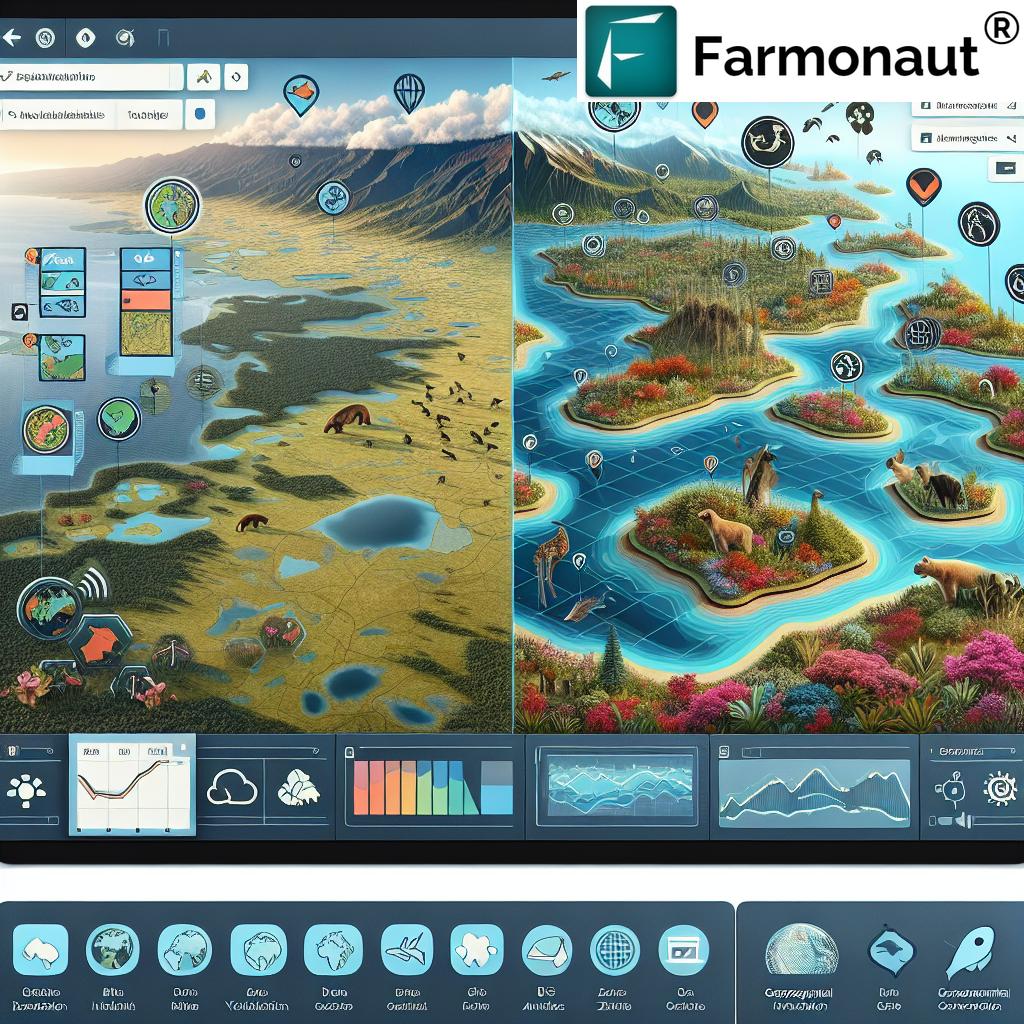
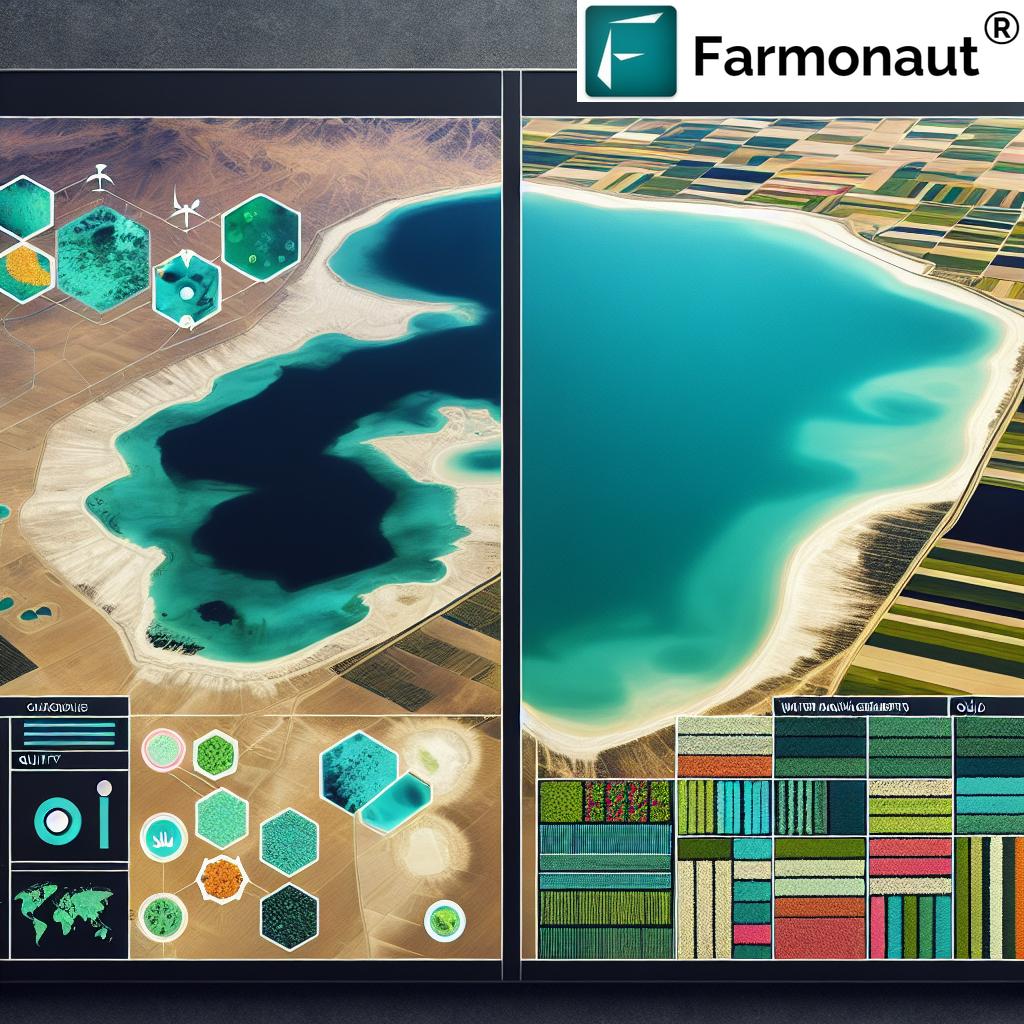
- Tracks land cover changes across wetlands, grasslands, and semi-arid zones.
- Assesses the impact of human activities, agriculture expansion, or environmental disasters like droughts and floods.
- Guides conservation strategies and environmental regulations.
- Facilitates compliance with sustainability standards by providing measurable, satellite-based indices of recovery or degradation.
Vital for governments, NGOs, and large-scale landholders, NDVI-based ecosystem monitoring advances sustainable land, water, and carbon management. Discover how Farmonaut’s Carbon Footprinting Service helps you monitor and reduce environmental impacts and guide sustainability.
NDVI: Limitations and Critical Considerations
While the NDVI Vegetation Index delivers transformative insights, it is essential to understand limitations:
-
Saturation in Dense Vegetation:
For very dense or healthy canopies, NDVI may saturate near-maximum, reducing sensitivity to further biomass increases. Complementary indices or hyperspectral data can address this gap. -
Atmospheric Interference:
Cloud cover, haze, or air pollution can disrupt satellite NDVI readings. Correction algorithms are required for precise, actionable insights. -
Temporal Resolution:
The cadence of available satellite imagery can limit detection of rapid, short-term changes in crop conditions. Combining satellite sources or integrating ground sensor data (IoT) helps improve monitoring frequency and reliability.
NDVI is best used as one layer in a holistic, precision agriculture technology strategy—supported by ground-truth data and auxiliary remote sensing metrics.
Looking to integrate satellite-based NDVI, weather, and crop data into your agribusiness, co-op, or research platform? Explore the Farmonaut API for real-time, customizable field analytics. Developers: detailed setup instructions and endpoints are available in our API Developer Docs.
Advancements in NDVI Monitoring: What’s Next?
NDVI-based technology is rapidly evolving, driven by advancements in:
-
Artificial Intelligence & Machine Learning:
Combining NDVI with other spectral indices, machine learning models deliver more accurate crop yield prediction, automated disease stress detection, and dynamic harvest planning. -
Hyperspectral Imaging:
Hyperspectral satellites gather finer-grained reflectance information, revealing detailed nutrients, crop types, and stress markers not visible with NDVI alone. -
IoT & Ground Sensor Integration:
Field sensors feed live data on soil, water, and air conditions; when combined with NDVI imagery, this enables multi-dimensional farm management. -
Real-time NDVI Monitoring:
The latest satellites transmit NDVI updates more frequently, giving immediate alerts for crop stress and environmental threats. -
Blockchain Technology:
NDVI measurement is now traceable and secure using blockchain, ensuring data integrity for crop insurance, certification, and supply chain transparency.
Discover more on Farmonaut’s Blockchain Traceability System. -
Large-Scale and Remote Management:
For big plantations and agribusinesses, large-scale farm management tools centralize NDVI, fleet logistics, and advisory analytics for efficient oversight.
NDVI in Action: Farmonaut’s Approach to Precision Agriculture Technology
At Farmonaut, our mission is to democratize precision agriculture technology worldwide—leveraging NDVI monitoring, AI, and reliable satellite crop monitoring to place powerful insights into the hands of every farmer, co-op, plantation owner, and decision-maker, no matter their location or scale.
-
Affordable, Real-Time Crop Monitoring:
Our Android, iOS, and web app enable access to multispectral NDVI maps, crop alerts, soil moisture, and weather analytics at your fingertips. -
AI-Driven Farm Advisory (Jeevn AI):
Get evidence-based advisory for optimal irrigation, nutrient management, and pest control, powered by dynamic NDVI and environmental data. -
Scalable for All:
Whether you are a smallholder, large agribusiness, or government institution, our team offers tailored solutions, seamless integration, and field-to-cloud traceability. -
Resource and Fleet Management:
Our fleet management tools optimize logistics, field staff safety, and operational efficiency. -
Sustainability & Compliance:
Real-time carbon footprint analysis enables climate-smart operations and transparent reporting for environmental regulations.
Why choose Farmonaut?
Our solutions require no expensive drone hardware— just a smartphone or browser—making advanced NDVI and precision farming accessible to everyone. And for advanced users, our API empowers developers and corporate clients with seamless integration for custom analytics.
Ready to get started? Try Farmonaut’s Real-Time NDVI Platform now!
Farmonaut Subscription Packages
Explore flexible packages for individual farmers, agribusinesses, and government bodies, based on hectares monitored and satellite data update frequency.
“NDVI can detect crop stress up to 10 days before visible symptoms appear, enabling earlier intervention and management.”
Frequently Asked Questions (FAQ)
What is the NDVI Vegetation Index?
NDVI (Normalized Difference Vegetation Index) is a widely used remote sensing metric that quantitatively assesses vegetation health and density by analyzing the reflectance of red and near-infrared (NIR) light from plant surfaces. Higher NDVI values indicate healthier, denser vegetation, while lower values signal sparse or stressed plants.
How is NDVI calculated and what does it measure?
NDVI is calculated using the formula: (NIR – Red) / (NIR + Red). It measures the difference in reflectance between the red and near-infrared portions of the electromagnetic spectrum, directly correlating with green biomass and photosynthetic activity.
How does NDVI monitoring help farmers?
NDVI monitoring empowers farmers to detect early signs of crop stress (due to pests, diseases, drought, or nutrient deficiency), optimize irrigation and fertilizer application, predict yields, schedule harvests efficiently, and minimize yield losses through early intervention strategies.
Why is early detection of crop stress important?
Early detection allows for prompt, targeted interventions, helping minimize damage and maximize crop yields. NDVI can spot stress up to 10 days before visible signs, giving farmers a critical window for action.
Can NDVI be used for forestry and conservation?
Absolutely. NDVI is instrumental for forest health monitoring, deforestation tracking, and ecosystem recovery assessment following fires, storms, or human intervention. It provides continuous, large-scale environmental data for sustainable land and resource management.
What are the limitations of NDVI?
NDVI may saturate in very dense vegetation, lose accuracy due to atmospheric interference (clouds, dust), and depends on the temporal resolution of satellite imagery. It is most powerful when integrated with ground truthing and additional indices.
How affordable is satellite-based crop monitoring with Farmonaut?
We at Farmonaut are committed to making precision agriculture affordable and accessible worldwide, offering subscription-based solutions tailored to farm size and user needs—no drone hardware required. Get started here.
How can NDVI data be accessed via API?
Farmonaut’s robust API enables integration of NDVI, weather, and field analytics into your own platforms. Developers can find endpoints and technical guidance at our Developer Docs.
Conclusion: Shaping the Future of Agriculture & Forestry with NDVI
The NDVI Vegetation Index stands at the intersection of science, technology, and sustainability in agriculture and forestry. Its data-driven insights empower users to monitor vegetation health, predict yields, catch crop stress early, and make precision management decisions. NDVI enables environmental stewardship by facilitating real-time, large-scale monitoring of forest cover, ecosystem recovery, and impacts of human-induced changes.
We at Farmonaut are at the forefront of this revolution—making satellite-based, precision agriculture technology universally accessible while promoting transparency, sustainability, and efficiency across the farming ecosystem. Whether you’re a smallholder, corporate agribusiness, financial institution, or government agency, NDVI-based vegetation assessment and monitoring will transform how you interact with the land.
Unlock the full power of NDVI monitoring with Farmonaut—your partner for data-driven success in agriculture, forestry, and environmental management.


