

Utah copper · Mine facts guide
Bingham Canyon Mine: Output, Size and Satellite View
The Bingham Canyon mine in Utah is a pit about 4 km wide that produced 125,000 t of copper in concentrate in 2025 (Rio Tinto). This guide gives size, output, reserves, smelter status and history, with a satellite view and an ore value calculator.
Key takeaways
- Rio Tinto’s Bingham Canyon mine produced 125,000 t of copper in concentrate, 117,800 oz of gold and 5,100 t of molybdenum in 2025 (Rio Tinto Form 20-F, 2025).
- Open-pit reserves at 31 December 2025 were 730 Mt at about 0.36% copper, so scale, not grade, makes the mine work (Rio Tinto Form 20-F).
- Refined copper fell 31% to 134,000 t in 2025 after pit-wall and smelter problems; the smelter furnace rebuild finished in August 2026 (Argus, January 2026; Rio Tinto third-quarter 2026 results).
- The pit is about 4 km wide; depth is quoted as 970 m (GSA Today, 2014) and 1,200 m (NASA, 2007).
- At 125,000 t, the mine is about one-eighth of US mine copper (USGS, 2026) but far below Escondida in Chile at 1,272,000 t.
In this article
- Bingham Canyon mine facts at a glance
- How big is the pit?
- How much copper does Bingham Canyon produce?
- Gold, silver and molybdenum from the same ore
- Why output fell and what is being done about the pit wall
- Reserves, grade and mine life
- From pit to cathode: the Kennecott smelter and refinery
- Bingham Canyon timeline
- Bingham Canyon from space
- Power, land and reclamation
- Can you visit Bingham Canyon?
- Kennecott in Utah is not Kennecott in Alaska
- Frequently asked questions
The Bingham Canyon mine is an open pit about 4 km (2.5 miles) wide and roughly 1 km deep in the Oquirrh Mountains, 16 miles (26 km) south-west of Salt Lake City, Utah (National Park Service landmark record). Rio Tinto owns it through Kennecott Utah Copper LLC. In 2025 it produced 125,000 tonnes of copper in concentrate, 117,800 troy ounces of gold, 1.73 million ounces of silver and 5,100 tonnes of molybdenum (Rio Tinto Form 20-F, production table). This page gives the size, output, reserves, smelter status and history in numbers, a satellite view of the pit, and a calculator for the value of ore at your own grade and prices.
Bingham Canyon mine facts at a glance
Most of these figures come from Rio Tinto’s own filings for the year to 31 December 2025, with the date shown. Where sources disagree, the table says so.
| Item | Fact | Source and date |
|---|---|---|
| Owner and operator | Rio Tinto (100%), run by Kennecott Utah Copper LLC; interest acquired in 1989 | Rio Tinto Form 20-F, December 2025 |
| Type of mine | Open pit plus a new underground skarn mine | Form 20-F, December 2025 |
| Deposit type | Porphyry and skarn deposits with copper, gold, silver, molybdenum and tellurium | Form 20-F, December 2025 |
| Land held | About 95,000 acres (about 38,400 ha) wholly owned | Form 20-F, December 2025 |
| Pit size | Over 4 km wide; depth quoted as 970 m (2014) or 1,200 m (2007) | GSA Today; NASA |
| Copper in concentrate | 125,000 t in 2025 (123,000 t in 2024) | Form 20-F, December 2025 |
| Refined copper | 134,000 t in 2025, down 31% from 193,000 t in 2024 | Argus, 21 January 2026 |
| Open-pit reserves | 730 Mt at about 0.36% copper (proven plus probable) | Form 20-F, 31 December 2025 |
| Planned pit life | Pushback approved to allow mining between 2026 and 2032 | Rio Tinto half-year results, July 2026 |
| Landmark status | National Historic Landmark since 13 November 1966 | National Park Service |
How big is the pit?
Published sizes differ, and neither source says where it measures depth from. A University of Utah paper on the April 2013 landslide gives the pit as 970 m deep, after the 2013 failure (Pankow et al., GSA Today, January 2014). NASA’s 2007 astronaut-photo caption says over 4 km wide and 1,200 m deep, as measured in 2007 (NASA Visible Earth). In round numbers, think of a bowl about 4 km across and 1 km deep, or 2.5 miles by 0.6 to 0.75 miles. The old figure of “0.75 miles deep” sits at the top of that range.
The walls are cut as stepped terraces called benches. NASA measured benches on the western face at 16 to 25 m high; they give trucks and shovels a working level and keep the sloping wall stable. The same caption says the operator was moving about half a million tons of rock a day in 2007 and that more than 17 million tons of copper had been removed since mining began. That is a 2007 figure, so output since then adds to it.
You will often read that this is the largest man-made excavation on Earth. Sources use that line freely, but there is no single agreed measure behind it. NASA’s own wording is more careful: “one of the largest open-pit mines in the world”.
How much copper does Bingham Canyon produce?
Mine production was 125,000 tonnes of copper in concentrate in 2025, 123,000 t in 2024 and 152,000 t in 2023 (Rio Tinto Form 20-F, December 2025). Concentrate is the product of the mill: ore crushed, ground and floated until the copper minerals are separated from most of the waste rock, ready for the smelter. The USGS estimates total US mine output at 1.0 million tonnes of recoverable copper in 2025 (USGS Mineral Commodity Summaries, February 2026). On those two sources, Bingham Canyon supplied roughly one-eighth of US mine output. The first figure is Rio Tinto’s copper in concentrate; the second is the USGS estimate of recoverable copper from mines.
Chart
Mine copper production at three copper mines operated or part-owned by Rio Tinto, 2025
Thousand tonnes of copper, 100% basis
It is a large US mine but not a large world mine. Rio Tinto’s table puts Escondida in Chile at 1,272,000 t of mine production on a 100% basis and Oyu Tolgoi in Mongolia at 345,000 t, both ahead of Bingham Canyon.
Copper demand is the reason the pit keeps being deepened. For the wider picture of where copper comes from, see our guide to copper deposit types and top producing countries.
▶ Explains why electric vehicles need so much copper and where that copper comes from. · 6:03
Gold, silver and molybdenum from the same ore
The ore is a porphyry deposit, a large body of rock cut by many small veins and grains of copper minerals, where the metals are spread through a lot of rock at low grade. A porphyry mine earns its income from several metals at once. In 2025 Bingham Canyon mined 117,800 oz of gold, 1,734,000 oz of silver and 5,100 t of molybdenum, a metal used to harden steel. Molybdenum output nearly doubled from 2,600 t in 2024 and was up from 1,800 t in 2023 (Rio Tinto Form 20-F). Rio Tinto named more molybdenum at Kennecott as one of its first-half 2026 productivity actions.
Chart
Bingham Canyon molybdenum production
Thousand tonnes of molybdenum
Gold production in 2025 was 117,800 oz against 95,200 oz in 2024 and 104,800 oz in 2023. Because the metals are by-products of one flow of ore, they rise and fall with the section of the pit being mined, not with their own prices.
The reserve table also lists tellurium among the metals in the mineralisation. Rio Tinto said in 2019 that it was working with US government scientists to recover rhenium and tellurium from Kennecott’s refinery and smelter streams (Mining Engineering, December 2019).
Why output fell and what is being done about the pit wall
Two things moved the numbers in 2025 and 2026: unstable ground in the pit, and the smelter.
Chart
Mined and refined copper at Kennecott
Thousand tonnes of copper
On the ground, Rio Tinto’s impairment review for 2024 says studies of a zone of pit-wall instability showed the mine plan had to change to stabilise the wall and reduce the risk of a major failure. That limited ore from the main ore face in 2025 and 2026 (Rio Tinto Form 20-F). Argus reported that refined copper fell 31% in 2025 and that the smelter closed for 21 days in September and another 45 days from mid-October (Argus, 21 January 2026).
In the first half of 2026 Rio Tinto again reported lower Kennecott output: less high-quality concentrate, mine sequencing changes linked to ground control, planned mill maintenance, and a temporary shutdown after a fatality in the first quarter. A flash converting furnace breach in late June meant the smelter kept making copper matte (an intermediate copper-iron-sulphur product) rather than refined metal. The company said full-year copper including that matte would be unchanged (Rio Tinto half-year results, July 2026). In its third-quarter report it said the furnace rebuild finished at the end of August, ahead of plan (Rio Tinto, third-quarter 2026 production results).
The wall problem is not new. On 10 April 2013 the north-eastern wall failed in two events about 90 seconds long, 1.5 hours apart, and moved about 65 million cubic metres of rock. No one was hurt because instrument monitoring had warned the operator and the area was cleared. The authors called it likely the largest non-volcanic landslide in North America in modern times (GSA Today, January 2014).
The chart above shows mined copper against refined copper by year. Refined metal leaves the smelter and refinery later than ore leaves the pit, so the two series do not move together from year to year.
Reserves, grade and mine life
A reserve is the part of a deposit that can be mined at a profit with current plans, after allowing for mining losses. Rio Tinto reports the open pit at 442 million tonnes (Mt) proven at 0.38% copper and 288 Mt probable at 0.34% copper at 31 December 2025. That is 730 Mt in total at about 0.36% copper, or 3.6 kg of copper per tonne of rock. The gold grade is 0.18 to 0.19 grams per tonne (g/t) and silver about 1.9 to 2.0 g/t (Rio Tinto Form 20-F, mineral reserves table). The underground skarn ore is richer: probable reserves of 7.8 Mt at 2.13% copper and 1.16 g/t gold.
Low grade is why scale matters. At 0.36% copper the mine must move enormous tonnages, and every extra bench of waste removed before ore is reached adds to cost.
The plan to keep the pit going has two stages. The south-wall pushback began in 2012 and moved the end of mine life from 2018 to 2032. In December 2019 Rio Tinto approved a further US$1.5 billion for the second phase (International Mining, December 2019). The open pit extension now carries a total capital cost of US$1.8 billion, with US$0.6 billion left to spend at 1 July 2026. Waste stripping continues through 2027, and steady ore production from the second phase is expected in the second half of 2027 (Rio Tinto half-year results, July 2026).
Underground, the North Rim Skarn project (US$0.6 billion, approved in June 2023) reached first production in the fourth quarter of 2025, with a target of about 250,000 t of copper through 2033. Rio Tinto said underground output was held back in the first half of 2026 by a safety stand-down, ground repair after a rockfall and maintenance limits.
Use the calculator to see what a tonne of ore at these grades could be worth. It uses the reserve grades as defaults and leaves recovery and prices to you.
Calculator
What is a year of porphyry copper ore worth?
Enter your own ore tonnage, grades, recoveries and prices.
- Gold recovered per year: 150,465 oz
- Gross copper value per year: $1,349,227,440
- Gross gold value per year: $451,396,145
- Gross value per tonne of ore: $45
Example values only, not Kennecott’s figures or a forecast. Default grades are the open-pit reserve grades in Rio Tinto’s Form 20-F (December 2025). Recoveries and ore tonnage are examples. Prices are inputs: example, use today’s price. Molybdenum, silver, mining costs, smelter charges and royalties are left out, so the result is gross metal value, not profit.
From pit to cathode: the Kennecott smelter and refinery
Bingham Canyon is the start of a chain. Ore goes to the Copperton concentrator, which makes copper concentrate. The Garfield smelter, a refinery and a precious metals plant, plus an assay laboratory and tailings storage, complete the operation (Rio Tinto Form 20-F). Rio Tinto says the operation refines copper to 99.99% purity (Rio Tinto, Kennecott visitor experience).
Infographic
Kennecott copper chain in 5 steps
- 1MineOre and waste are drilled, blasted and hauled from the pit and, since late 2025, from the underground skarn mine.
- 2ConcentrateThe Copperton concentrator crushes and grinds the ore and separates a copper concentrate.
- 3SmeltThe Garfield smelter turns concentrate into copper matte and then metal for refining.
- 4RefineThe refinery makes high-purity copper cathode.
- 5RecoverA precious metals plant recovers gold and silver.
The smelter matters beyond Utah. The USGS counts two primary copper smelters in the whole United States (USGS Mineral Commodity Summaries 2026), and Kennecott runs one of them. That is why a furnace outage there shows up in national refined-copper figures, not only in company results.
The smelter, concentrator and refinery are all run by the same company, Kennecott Utah Copper LLC, which also runs the mine.
Bingham Canyon timeline
- 1848: brothers Thomas and Sanford Bingham report lead-silver ore in the canyon, which is named after them. In December 1863 soldiers under Colonel Patrick Connor form the West Mountain Mining District (Kennecott Groundbreakers history).
- Early 1900s: Rio Tinto dates the mine to 1903. The NPS landmark record gives 1904 as the significant year (NPS). NASA notes that large-scale open-pit mining turned the hill into “the Pit” by the 1930s.
- 13 November 1966: Bingham Canyon Open Pit Copper Mine is designated a National Historic Landmark (NPS). Some company pages give 1972; the NPS record shows 1966.
- 1989: Rio Tinto acquires its interest in Kennecott.
- 2012: the south-wall pushback begins.
- 10 April 2013: the large wall failure described above.
- 2019: the US$1.5 billion second-phase approval; the company also announced the closure of its coal-fired power plant that year (International Mining, December 2019).
- 2022 and 2023: underground approvals for the Lower Commercial Skarn and the North Rim Skarn.
- Late 2025: first underground production from North Rim Skarn.
- August 2026: the rebuilt flash converting furnace is completed.
Bingham Canyon from space
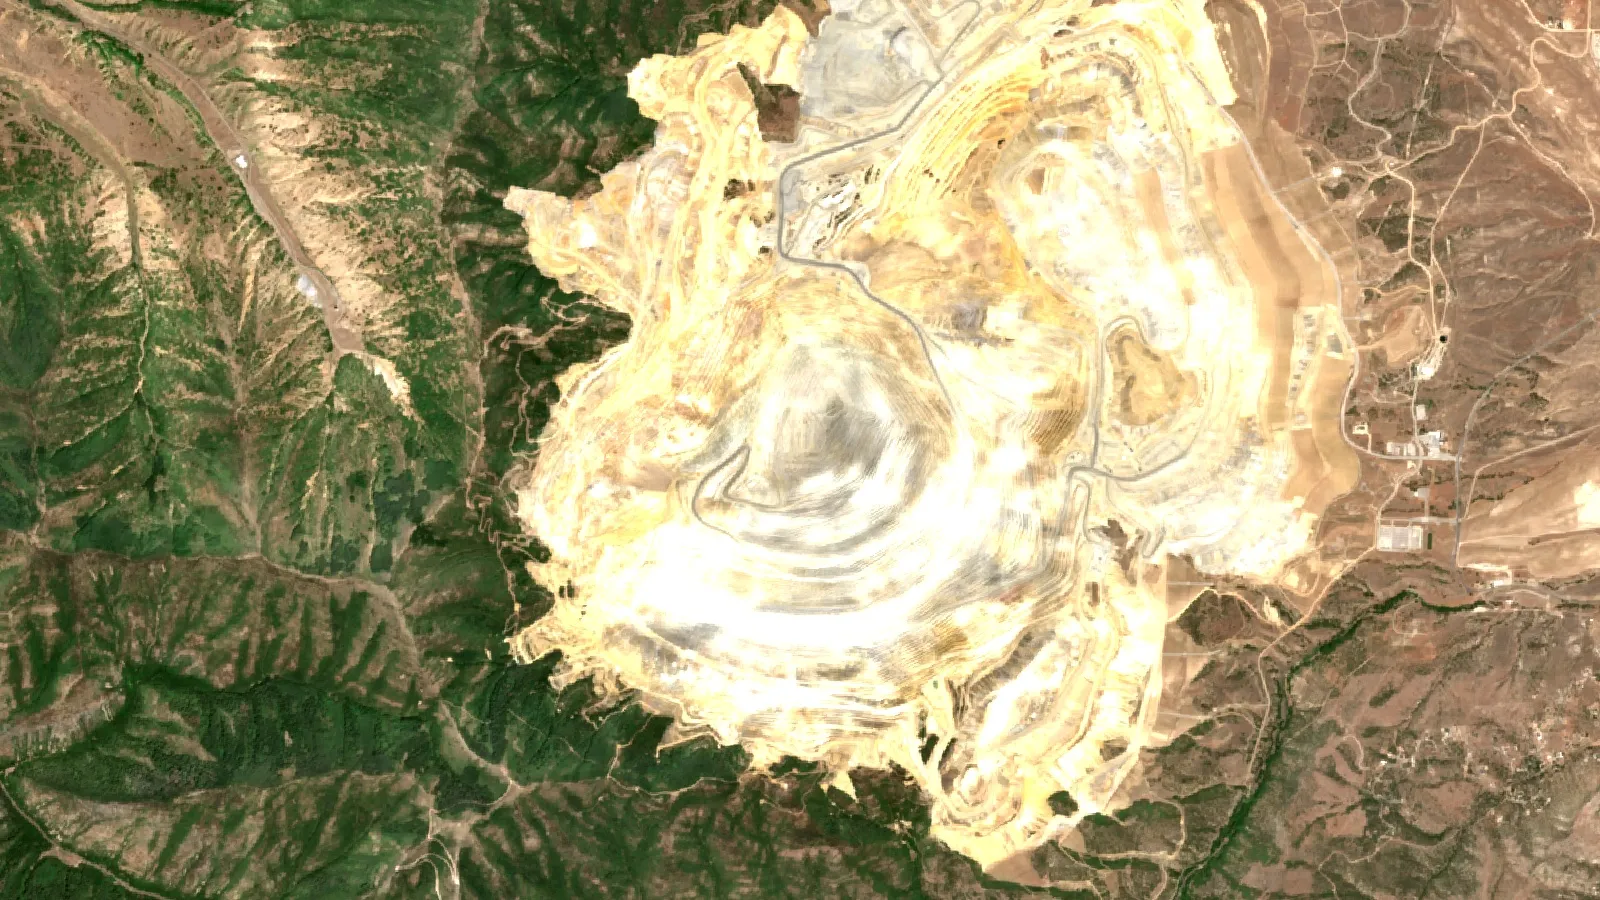
The pit is easy to find from orbit: a stepped hole ringed by brown-to-gray, flat-topped waste-rock hills. NASA’s astronaut photograph from the International Space Station in 2007 shows the benches along the western wall and leach-water reservoirs south of the town of Bingham Canyon (NASA Visible Earth).
Satellites also show how the pit grew. NASA’s Scientific Visualization Studio compares Landsat 1 imagery from 7 August 1972 with Landsat 7 imagery from 31 July 2000, a way to see about three decades of benching and dump building in two frames (NASA SVS, Bingham Coppermine growth over time). Sentinel-2 passes every few days at 10 m pixels, which is enough to track pit and dump footprints, pond edges and changes in vegetation around the property. The image at the top of this page is a Sentinel-2 composite of the pit and its surroundings, about 12 km across, built from summer scenes.
What satellites cannot do is measure the grade of ore from below the pit floor. They map surface minerals, alteration, terrain and change. NASA’s caption notes that geologists can sometimes use satellite observations to spot surface rock types and landforms that suggest copper ore below. That is the step before drilling, not a replacement for it. Farmonaut Mining Pro applies the same idea to a licence boundary and returns exploration targets, which come before any resource estimate. The link to the full explanation is in the box at the end of this page; for a broader read see our guide to copper porphyry deposits, alteration and discovery.
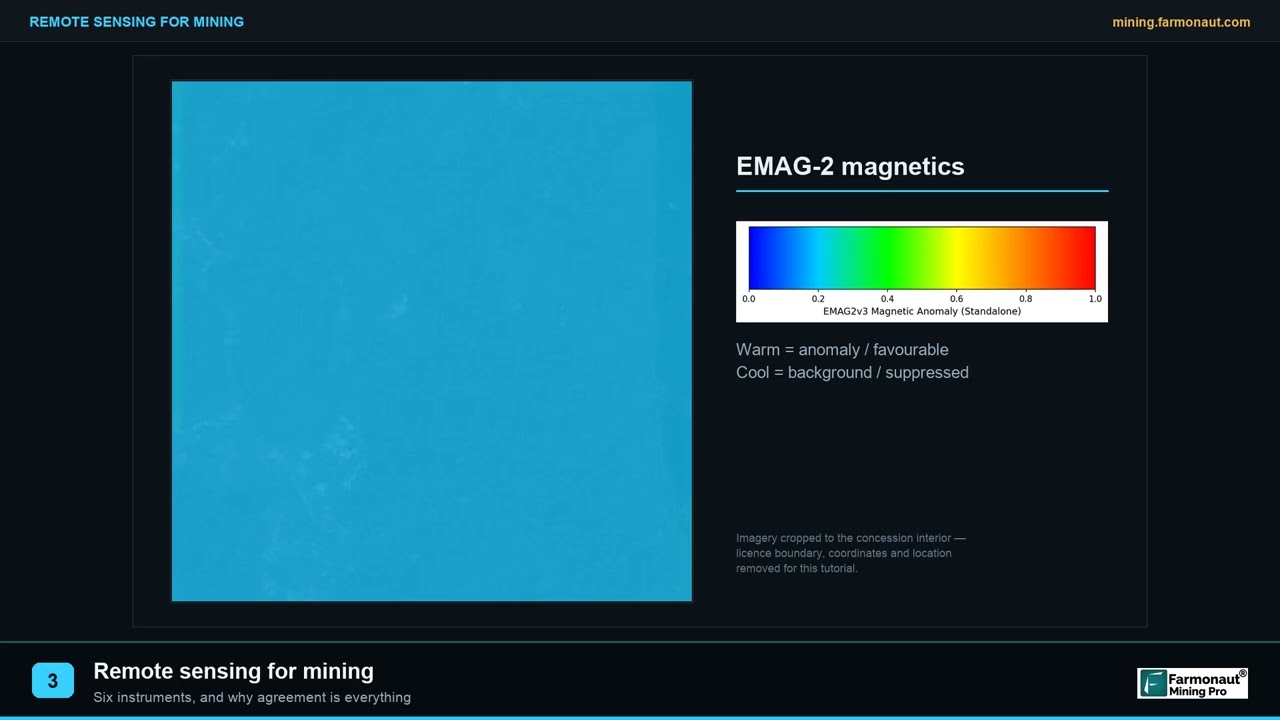
▶ A short plain-language explanation of what remote sensing measures in mining. · 2:01
Power, land and reclamation
The mine runs on grid power supplied by Rocky Mountain Power under a contract, and permit conditions set by Utah and US agencies cover environmental compliance, reporting, closure and reclamation (Rio Tinto Form 20-F). Rio Tinto reports that renewable diesel cut emissions at Kennecott in 2025 and that a second solar phase of 25 MW began commercial operation in December 2025. In 2019 the company had said it would permanently close the coal-fired power plant at Kennecott and buy renewable energy certificates instead.
The wider environmental effects of any large pit, from dust and water to land change, are what the video below explains. For an operator, satellite change maps of dumps, ponds and disturbed land are a routine way to check reclamation against a permit.

▶ A claymation on the seven environmental impacts of mining. · 2:31
Can you visit Bingham Canyon?
Yes. The Rio Tinto Kennecott Visitor Experience at 12732 Bacchus Highway, Herriman, Utah, runs shuttles to the pit overlook. Rio Tinto’s page lists opening from 9.30 am to 2.30 pm every day, shuttles every 30 minutes, and advance online tickets (Rio Tinto, Kennecott visitor experience). Check the page before you travel, as hours and season can change.
Kennecott in Utah is not Kennecott in Alaska
People use “Kennecott” for two different places. The Utah operation is the working copper complex described here. The Kennecott Mines National Historic Landmark in Alaska is an old mill town and underground copper mine inside Wrangell-St. Elias National Park. The Alaska operation closed by 1938 and is now preserved by the National Park Service (National Park Service). Rio Tinto Zinc bought Kennecott, owner of the Utah mine, in 1989 (Kennecott Groundbreakers history).
Frequently asked questions
Where is the Bingham Canyon mine?
It is in the Oquirrh Mountains of Salt Lake County, Utah, about 16 miles south-west of Salt Lake City, according to the National Park Service record. Locals often call it the Kennecott copper mine.
Who owns the Bingham Canyon mine?
Rio Tinto owns 100% and operates it through Kennecott Utah Copper LLC. It acquired its interest in 1989 (Rio Tinto Form 20-F). More detail is in our post on who owns the Kennecott copper mine.
How deep and wide is the pit?
About 4 km wide and 970 m to 1,200 m deep, depending on the source and where the rim is measured. See the pit size section above for the two citations.
How much copper does it produce each year?
Mine production was 125,000 t of copper in concentrate in 2025 and refined output was 134,000 t. Both numbers come from Rio Tinto filings; the first-half 2026 report says production was lower again early in the year.
Is it the largest copper mine in the world?
Not by output. Escondida in Chile produced 1,272,000 t of mine copper in 2025 on a 100% basis, about ten times Bingham Canyon, according to the same Rio Tinto table. The pit is among the biggest open pits by size.
Can you see the Bingham Canyon mine from space?
Yes. NASA has published an astronaut photograph taken from the International Space Station and a Landsat comparison of the pit in 1972 and 2000. The 4 km pit is large enough to see at Landsat’s 30 m pixel size.
What metals does it produce?
Copper first, then gold, silver and molybdenum, with tellurium noted in the mineralisation. All four main metals are reported in the 2025 production table.
When will Bingham Canyon close?
No closure date is set. The approved pit plan allows mining between 2026 and 2032, the underground project targets production to 2033, and Rio Tinto has said there are options to extend. Treat these dates as plans, not forecasts.
Is the Kennecott smelter still running?
Yes. A flash converting furnace breach in late June 2026 meant the smelter made copper matte instead of refined metal for a time, and Rio Tinto’s third-quarter 2026 report says the rebuild was completed at the end of August.
Is Kennecott in Alaska the same company or mine?
No. The Alaska Kennecott Mines are a closed National Historic Landmark managed by the National Park Service. The Utah operation is a working mine owned by Rio Tinto.
Can I visit the Bingham Canyon mine?
Yes, through the Rio Tinto Kennecott Visitor Experience, which needs a ticket booked online in advance. Drone use and professional photography are restricted on the property.
This page is for information only. It is not investment advice. It gives no share prices or targets. Production and reserve figures are Rio Tinto’s as filed; check the company’s latest filings before relying on them.
Farmonaut mining
Map a copper licence from space
Consultants can screen a licence boundary with satellite data and get exploration targets, which sit ahead of any resource estimate.

Mining Pro sample view, synthetic data
Keep reading
Sources
- Rio Tinto, Annual Report on Form 20-F 2025 (SEC): sec.gov
- Rio Tinto, 2026 half-year results: riotinto.com
- Rio Tinto, third quarter 2026 production results: riotinto.com
- Argus, Rio Tinto raises global copper output (21 January 2026): argusmedia.com
- USGS, Mineral Commodity Summaries 2026: Copper: pubs.usgs.gov
- Pankow et al., GSA Today (January 2014), Bingham Canyon landslide: geosociety.org
- National Park Service, Bingham Canyon Open Pit Copper Mine (NHL record): npgallery.nps.gov
- NASA Visible Earth, Bingham Canyon Mine, Utah: visibleearth.nasa.gov
- NASA SVS, Bingham Coppermine growth over time: svs.gsfc.nasa.gov
- Rio Tinto, Kennecott visitor experience: riotinto.com
- International Mining, Rio pushes back Kennecott life (December 2019): im-mining.com
- Mining Engineering, Rio Tinto to invest $1.5 billion in Kennecott (December 2019): me.smenet.org
- National Park Service, Kennecott Mines National Historic Landmark (Alaska): nps.gov
- Kennecott Groundbreakers, The Bingham Mine history: kennecott-groundbreakers.com
Discussion
Questions, corrections or field experience? Share them below. First-time comments are reviewed before they appear, and your email is never published.
No comments yet. Be the first to add a question or your experience.

 Sahel Shipping SA
 Sania Corporation
 Sean Mining Limited
 NTS Group (Pty) Ltd
 Mine4Africa
 Lithspo Minerals Limited
 Tintina Mining Group
 Dalgety Minerals Pty Ltd
 Vortex Minerals Pty Ltd
 Faith At Work (Pty) Ltd
 Geotech Mining Solutions plc
 Vulcan International Limited
 Kidepo Associates
 GKY Mining
 Alkimy SARL
 Double A Trading
 GemSprout Metals Limited
 Qader Group
 Ileys General Trading
 SG Gold Mining LLC
 VRV Global Pte Ltd
 Omsri International FZE
 G.I.T.T.
 Jaunita Erss Ltd











