

Farmonaut Mining Pro
Mineral exploration software for ranking drill targets
Mining Pro is mineral exploration software that runs in your browser. It combines satellite optical, radar, thermal and magnetic data into ranked Exploration Targets, each with an estimated value, and then gives you the tools a mining engineer would use to model, plan and export them.

Companies that have commissioned Farmonaut exploration work
- SRK Consulting
- Riverside Resources
- NTS Group
- Critica Metals
- Tintina Mining Group
- Huckleberry Garnet LLC
- Dalgety Minerals
- Vortex Minerals
- Geotech Mining Solutions plc
- Mine4Africa
Why satellite first
Deciding where to look first on a new license
Airborne surveys and field reconnaissance are still how ground gets confirmed, but they're an expensive way to start on a license nobody has screened yet. Satellite mineral exploration software is a much cheaper way to do that first screening.
Without satellite triage
- Weeks to months before a single hectare is ranked
- Field crews sent on gut feel and old geological maps
- One evidence type at a time, rarely cross-checked
- A portfolio review means re-flying or re-visiting ground
With Farmonaut Mining Pro
- Upload a license boundary and get ranked targets back
- Five independent kinds of evidence checked against each other
- You can see the reasoning behind each score
- Reviewing the license again later doesn't need a field crew
How detection works
The five kinds of evidence we combine
No single satellite sensor can prove a deposit is there. Mining Pro weighs the evidence the way a geologist would on the ground, but across the whole license at once: it combines layers from eight sensor families into one prospectivity score (on gold licenses this is the Gold Potential Index), and a target only ranks high when independent physical measurements agree.
Optical
Multispectral and SWIR imagery maps hydrothermal alteration, iron-oxide ratios and vegetation stress at the surface.
Thermal
Thermal anomalies can point to shallow intrusive or epithermal systems that are still warm enough to register from orbit.
Radar
Synthetic aperture radar picks up lineament density and the fault networks that control where fluids, and with them ore, can move.
Magnetics
The magnetic response can point to a buried intrusion driving the system, which you can't see at the surface.
Terrain
Elevation and drainage data rule out ground that couldn't be worked geotechnically, so it never makes the target list.
Checking the reasoning
The "Why Detected?" panel
Click a zone on the 2D Map and open "Why Detected?". It ranks the evidence behind that zone across the eight signal fields listed below, strongest first.
- ASTER alteration
- SAR radar
- PALSAR
- Thermal
- Geobotanical
- Geophysics
- Bare-ground evidence
- Fused index score
Sensors include Sentinel-2, Landsat 8/9, ASTER, Sentinel-1, ALOS PALSAR, ALOS-2, MODIS, SRTM, Copernicus GLO-30, GEDI, EMAG2, MERIT Hydro and Dynamic World.
The nine tools in Mining Pro
All nine tools work from the same detection run, so the zone you click on the map is the same zone you'll find in the block model and in the pit shell.
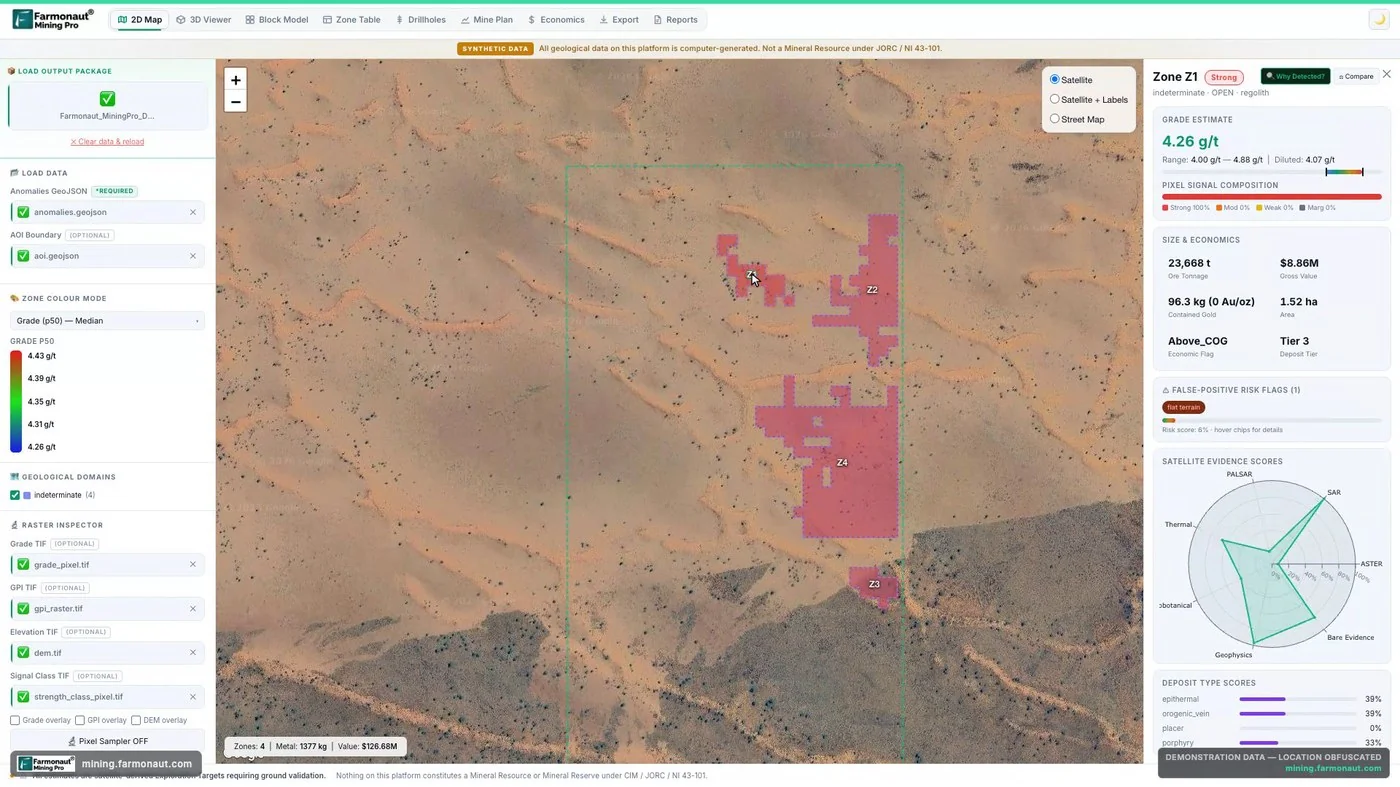
2D Map
The license boundary, anomaly zones ranked by priority and live portfolio stats on satellite imagery. Most sessions start here.
Raster Inspector
Sample any pixel of the prospectivity, grade or signal-strength rasters. The histogram helps you tell a coherent signal from noise.
3D Viewer
3D mining visualization of terrain, depth, grade, drill-target vectors and an economic heat map, which you can view from four compass directions.
Zone Table
All the anomalies side by side, with grade, contained metal, confidence against its threshold, false-positive risk and drill priority.
Block Model
A regularized 3D grid, coded EXPL_TARGET_A/B/C by confidence and by rock type. These are exploration classes and shouldn't be read as resource categories.
Drillholes
A collar, survey, assay and lithology database you can look at eight ways, including 3D, plan, strip logs and cross sections.
Mine Plan
Conceptual mine planning with a floating-cone pit shell, a grade-tonnage curve at any cut-off, bench tonnage and a life-of-mine schedule.
Economics
Recoverable value for each zone, a break-even price, and a tornado chart showing how sensitive the value is to price and recovery.
Export & Reports
DXF, Surpac STR/DTM and OMF files in real-world UTM for Leapfrog, Vulcan, Surpac and Datamine, plus a full PDF report.
What a full run looks like on one license
These numbers come from an actual Mining Pro session on a de-identified demonstration license. We've obfuscated the location and names, but the grades, tonnages and dollar values are exactly what the platform produced.
About these figures: Mining Pro produces Exploration Targets, which sit ahead of a JORC or NI 43-101 resource estimate and are not a replacement for one. The block model, drillholes, pit and schedule on this license are conceptual and synthetic, generated to show the workflow, and are not a Mineral Resource or Reserve under either code. Any target still needs ground or drill confirmation.
Screens from the demonstration session
All of these were captured on the same de-identified demonstration license, and none of them are mockups.
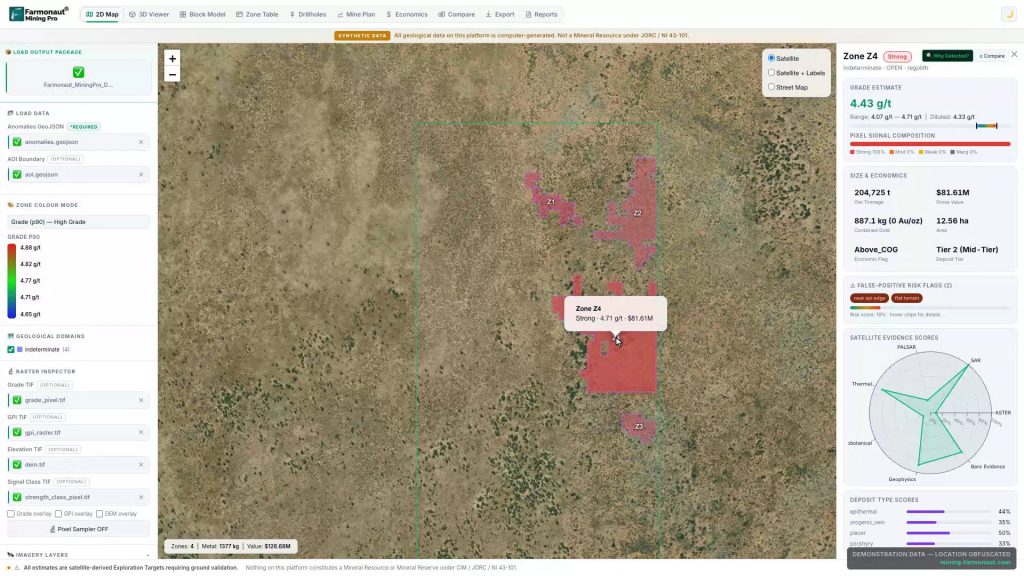
2D Map
Ranked zones on satellite imagery, with each zone's grade, size and value.
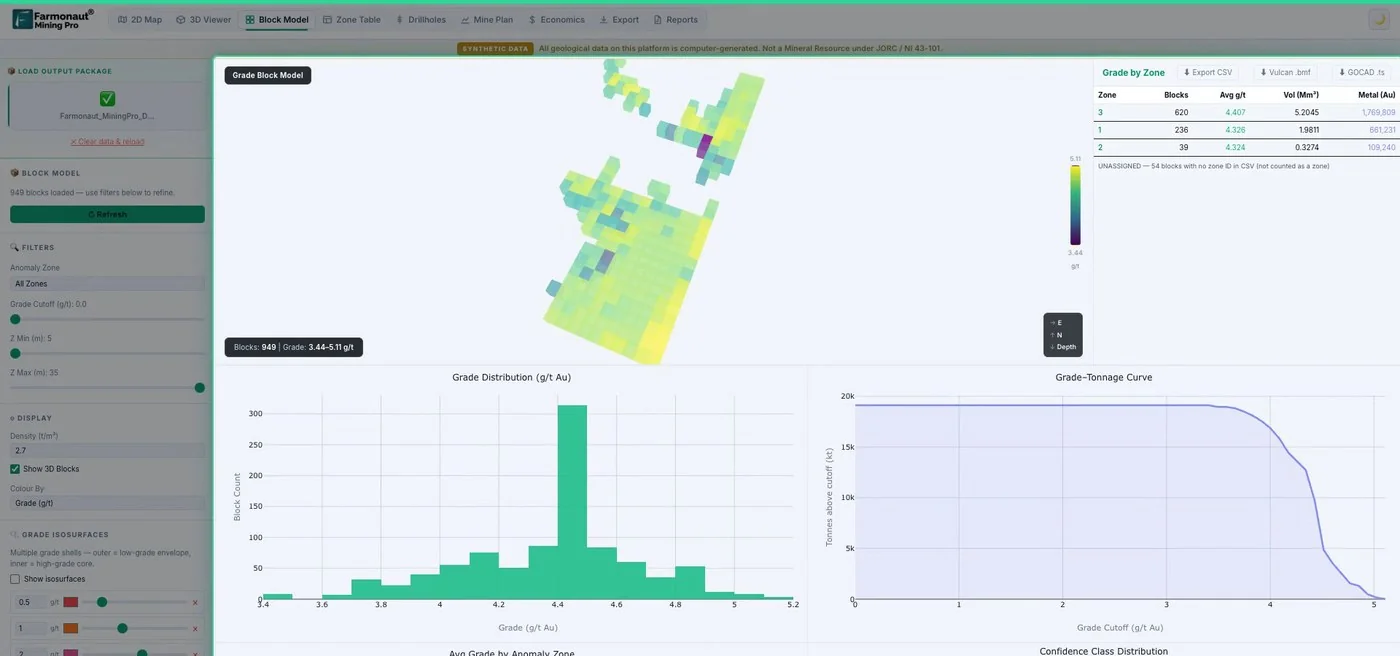
Block Model
949 blocks, the grade distribution and the grade-tonnage curve.
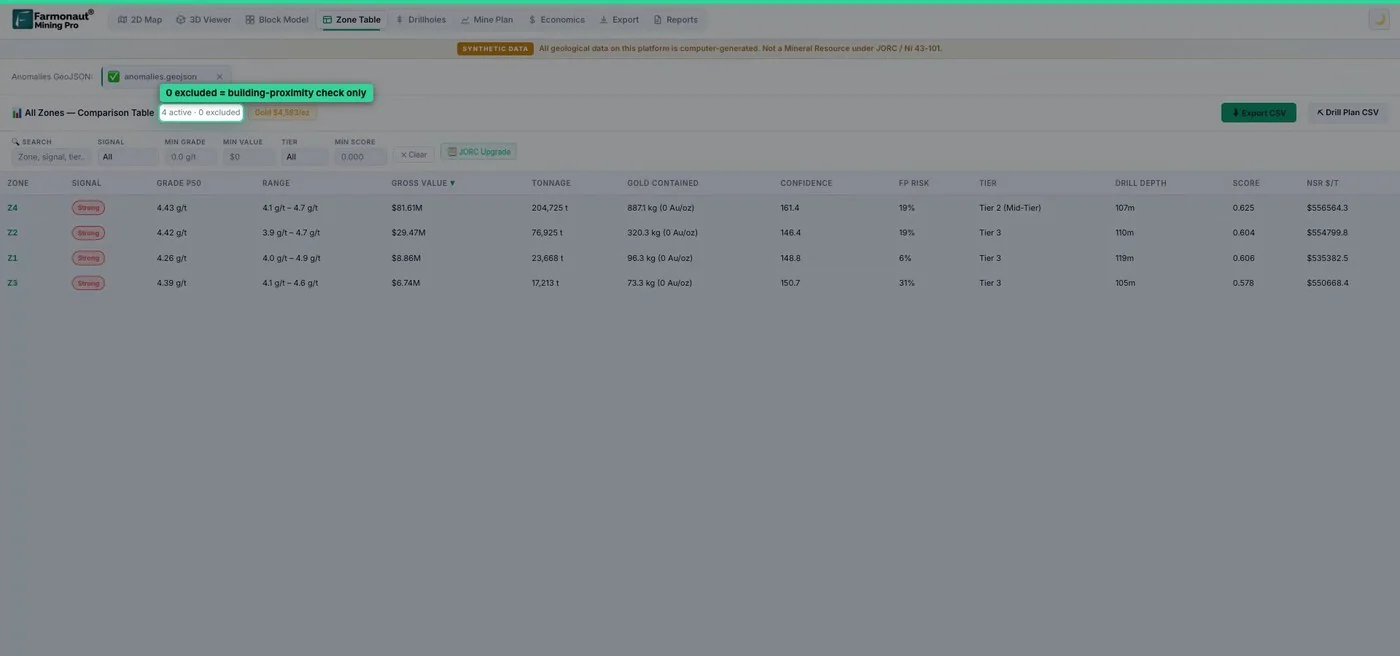
Zone Table
All the anomalies compared side by side.
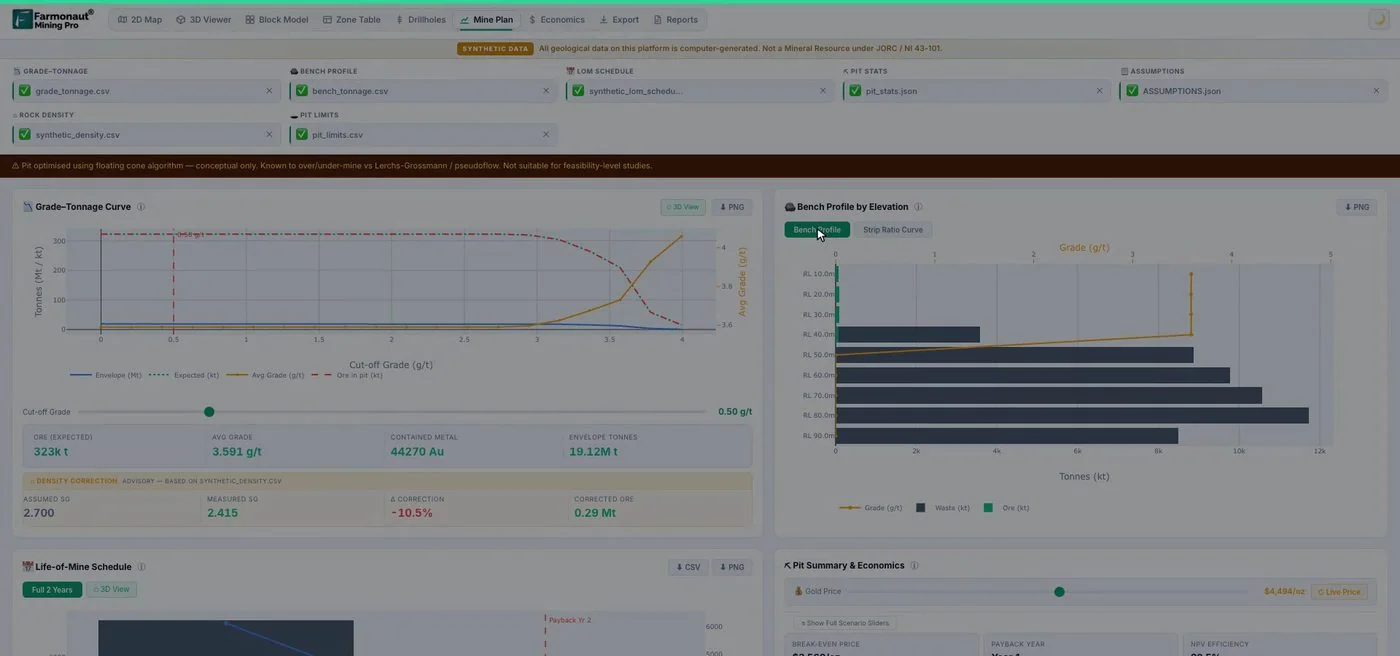
Mine Plan
Grade-tonnage curve and bench profile behind the conceptual pit.
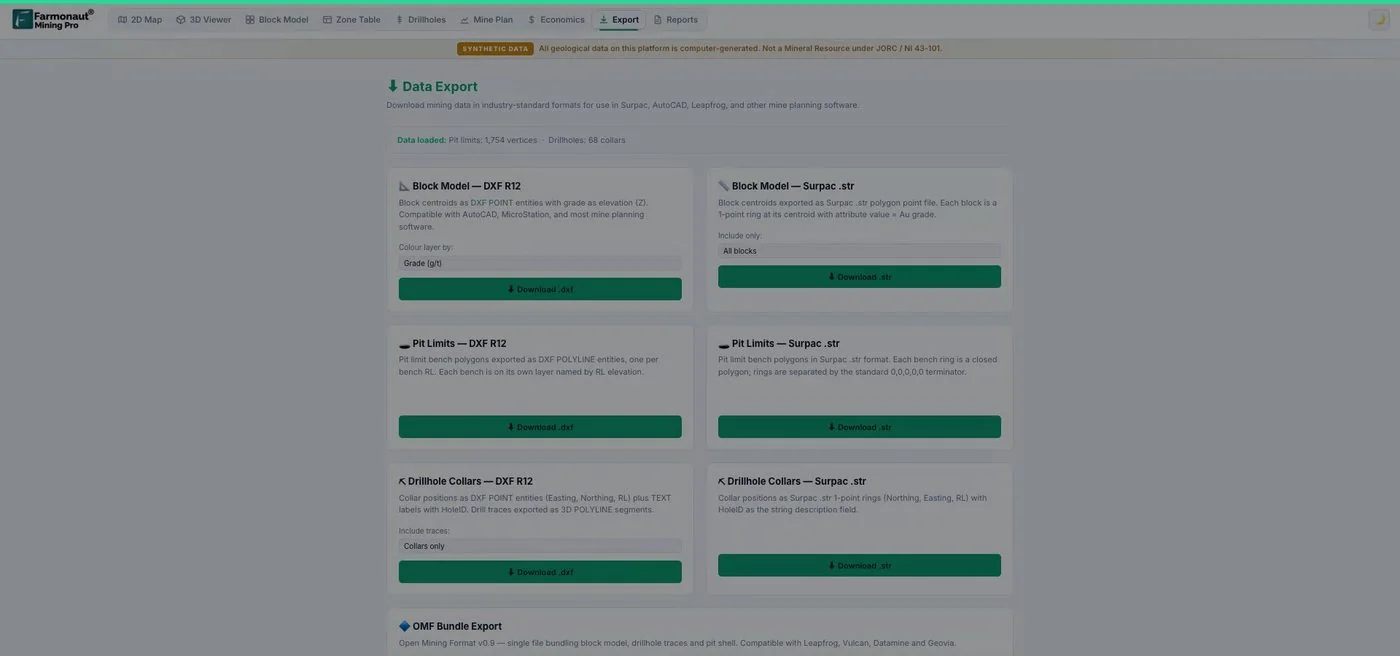
Export
DXF, Surpac STR/DTM and OMF for your modeling package.
Results on client licenses
Mining Pro runs on the same detection engine we use for all of Farmonaut's mineral exploration engagements. These are company-wide figures for FY2025-26 and FY2026-27 to date.
Mineralization where the targets pointed
Ranked targets on a compact license went straight to the drill, and the client reported mineralization where the analysis pointed.
Read the case study Gold · Zimbabwe
Ranked in 366 acres
We screened a greenstone-belt portfolio, set aside 83.7% of the area before any fieldwork, and narrowed the rest down to seven zones.
Read the case study Lithium + gold · Nigeria
Saved on a 300 ha license
The client reported more than six months and up to USD 25,000 in early-stage costs saved, with ranked targets for partner talks.
Read the case study Gold · Ghana
Screened in one engagement
533.65 km² across nine licenses, covered in a single engagement rather than nine separate field mobilizations.
Read the case studyFour ways teams use this mining geology software
All four use the same nine tools; what changes is which ones you spend most of your time in.
Free video course · 4h 10m
A free course that covers every tool
The course goes through each tab and formula inside the actual platform, using the demonstration license above. It starts with how satellites find gold and finishes with a full conceptual mine plan.
| Part 1 · Foundations | ||
|---|---|---|
| 01 | What Mining Pro does, and who it's for | 14:08 |
| 02 | How satellites find gold: the physics | 18:58 |
| 03 | From pixels to tonnes: the math behind the map | 18:55 |
| Part 2 · The platform | ||
| 04 | The 2D Map: your license at a glance | 14:14 |
| 05 | The Raster Inspector: evidence pixel by pixel | 13:39 |
| 06 | 3D Viewer, part 1: building the scene | 16:42 |
| 07 | 3D Viewer, part 2: interrogating the model | 13:37 |
| 08 | The Zone Table: auditing every number | 15:37 |
| 09 | The Block Model: an engineer's data structure | 17:46 |
| 10 | Drillholes, part 1: inside the database | 14:58 |
| 11 | Drillholes, part 2: planning a drill program | 12:13 |
| 12 | Mine Plan, part 1: pit shell and grade-tonnage | 18:56 |
| 13 | Mine Plan, part 2: costs, AISC and engineering | 14:58 |
| 14 | Economics and risk: Monte Carlo P10/P50/P90 | 14:59 |
| Part 3 · Applied | ||
| 15 | Export to Leapfrog, Vulcan, Surpac, Datamine | 14:49 |
| 16 | Four workflows, brought together | 15:11 |
How satellite evidence layers relate to deposit models
Each deposit type leaves a different mix of clues at the surface, so the weight a layer carries depends on the model you're testing.
Alteration minerals
Hydrothermal fluids leave minerals with absorption features in the shortwave infrared: sericite, kaolinite and alunite near 2.2 micrometers, chlorite, epidote and carbonates near 2.3. ASTER's six SWIR bands separate these groups well enough to sketch zoning, such as a phyllic zone inside a wider propylitic halo around a porphyry copper system. (Its SWIR detectors stopped working in 2008, so this layer comes from the archive.) Iron oxides in gossans show up in the visible and near-infrared bands of Sentinel-2 and Landsat.
Structure, thermal and magnetics
Orogenic gold is mostly controlled by shear zones and fault intersections, and its alteration is often too narrow to see from orbit. On greenstone belts, radar lineaments and terrain therefore carry more of the score, as in our greenstone gold case study from Zimbabwe. ASTER emissivity picks out quartz-rich rock such as silica caps over epithermal systems. EMAG2 magnetics has a grid spacing of a few kilometers, so it shows a buried intrusion or the edge of a belt rather than individual veins; an airborne survey, if you have one, will resolve far more. Our guide to remote sensing for mining covers the sensors in more depth.
How to read a prospectivity score and its confidence tier
The prospectivity score (the Gold Potential Index on gold licenses) is a ranking within your license. A high value means several independent kinds of evidence agree at that spot. It isn't a probability that ore is there. Before you rank a zone for fieldwork:
- Look at its shape as well as its peak. A coherent zone along a mapped structure beats a few bright pixels, and the Raster Inspector histogram shows the difference.
- Open "Why Detected?" and see which evidence carries the score. Radar, thermal and geophysics agreeing is stronger than one spectral ratio on its own.
- Check the false-positive risk in the Zone Table. Clay-rich farmland, mine waste, road cuts and dry lake beds can all mimic alteration.
Each zone also gets a confidence class, coded EXPL_TARGET_A, B or C in the block model. On the demonstration license, the 910 Class A blocks hold 95% of the contained metal. We'd start field checks on Class A zones and come back to B and C later, or sooner if one lines up with old workings you already know about.
Confidence classes describe the strength of the satellite evidence. They don't correspond to the Inferred, Indicated or Measured categories of a resource estimate.
Turning an Exploration Target into a drill program
Under the JORC Code, an Exploration Target reported publicly has to be given as ranges of tonnage and grade, with a statement that it is conceptual and that there hasn't been enough exploration to estimate a Mineral Resource (Clause 17 of the JORC Code 2012). NI 43-101 has a similar rule. Mining Pro works at that stage, and the P10/P50/P90 ranges in the Economics tool fit that way of describing a target.
| What Mining Pro gives you | What still happens on the ground |
|---|---|
| Ranked zones with location, estimated depth and grade | Mapping and rock-chip or soil sampling to confirm the signal |
| Drill-target vectors and trench azimuths across strike | Access, permits and landholder agreements |
| A synthetic drillhole layout | Real drilling, logging and assays with QA/QC |
| A conceptual block model, pit shell and economics | A resource estimate signed off by a Competent Person (JORC) or Qualified Person (NI 43-101) |
The usual order is to field-check the Class A zones, trench or run ground geophysics on the ones that hold up, then drill the best. On engagements where clients tested our ranked zones, 90% were confirmed by ground or drill evidence, which makes the ranking a good guide to what to test first. The testing still has to happen, and feasibility studies come later still.
How Mining Pro fits with Leapfrog, Vulcan, Surpac and Datamine
Leapfrog Geo is widely used for implicit geological modeling, and Vulcan, GEOVIA Surpac and Datamine cover modeling, mine design and scheduling. All four do their best work with drillhole data. Mining Pro comes earlier, before there's drilling to model: you use it to decide where the first holes go, then take the results into the package your team already knows.
The Export tool writes DXF, OMF and Surpac STR/DTM files of the block model, pit limits and drillholes in real-world UTM coordinates. DXF imports into all four packages, Leapfrog also reads OMF, and Surpac reads STR/DTM natively. Because everything is in UTM the targets land over your topography, tenement boundary and any historical holes. When your own drilling comes in, the resource model is built from the real holes and our targets stay on as a reference layer. Chapter 15 of the course shows the import into each package.
Choosing mineral exploration software
The right mineral exploration software depends on how far along your project is and what data you hold. These are the questions we'd ask:
- Do you have drill data? If so, a geological modeling package is your core tool. If not, you need satellite mineral exploration software that ranks ground before drilling.
- Can you see why a target ranks where it does? A score you can't take apart is hard to defend to a board or a joint-venture partner.
- Does it export in your coordinate system and file formats?
- Does it keep to the reporting codes? Satellite results presented as resources cause trouble later with JORC or NI 43-101 disclosure.
The label "AI mining software" says little by itself, so ask what data a model uses and whether you can inspect its evidence (our article on AI in mineral exploration explains how these models are built). If you already have hundreds of drill holes and a resource to update, a full modeling package will do more for you than Mining Pro. It's most useful on early-stage licenses, portfolio screening and second opinions.
Getting started with Mining Pro
- Watch Part 1 of the course (three chapters, 52 minutes) for the physics and math the rest of the platform builds on.
- Open Mining Pro and follow the course on the 2D Map, starting with "Why Detected?" on the strongest zone.
- Work through the Zone Table and Block Model before economics. A value figure only means something once you trust the zone behind it.
- For your own ground, send the boundary, country and target minerals through the mining quote form. We reply within one working day with scope, price and timeline.
If you'd rather have our team prepare a finished document, ask for a satellite mineral detection report instead.
Before you start
What people ask about our mineral exploration software
What kind of mineral exploration software is Mining Pro?
It's a browser-based tool. Mining Pro combines satellite optical, radar, thermal and magnetic data into a prospectivity score and turns a license boundary into ranked Exploration Targets with an estimated value. You then work with those targets across nine connected tools, from 2D mapping to conceptual mine economics, before you book a drill rig.
How is Mining Pro different from a satellite mineral detection report?
A satellite mineral detection report is a finished deliverable our team prepares for your license. Mining Pro is the software where you explore the results yourself: zones, rasters, 3D models, drillholes, pit shells and economics. To scope a report for your ground, request a quote.
Has it been validated in the field?
Yes. On engagements where clients tested them, 90% of ranked zones were confirmed by ground or drill evidence. On one copper-cobalt license, the client took our ranked targets straight to the drill and reported mineralization where the analysis pointed.
Are the results a JORC or NI 43-101 resource?
No. Mining Pro produces Exploration Targets, which come at an earlier stage than a JORC or NI 43-101 resource estimate. The block models, drillholes, pit shells and schedules for the demonstration license are conceptual and synthetic, and any target still needs ground or drill confirmation.
How should I read the prospectivity score in mineral exploration software like Mining Pro?
Treat it as a ranking within your license. A high score means several independent kinds of evidence agree at that spot, which is different from a probability that ore is there. Check the zone's shape in the Raster Inspector, the evidence behind it in "Why Detected?" and its false-positive risk in the Zone Table before you rank it for fieldwork.
Do I still need a Competent Person or Qualified Person?
Yes, once you want to report a resource. Mining Pro helps you decide where to sample and drill first. A Mineral Resource under JORC or NI 43-101 has to be estimated from real drilling and assays and signed off by a Competent Person or Qualified Person.
Can I use Mining Pro on my own license?
Yes. Send the boundary, country and target minerals through the mining quote form and we'll reply within one working day with the scope, price and timeline. Delivery takes under 5 days from a usable boundary, and multi-license portfolios are delivered in phases.
What satellite data does it use?
Layers from eight sensor families: optical multispectral (Sentinel-2, Landsat 8/9), SWIR and emissivity (ASTER), radar (Sentinel-1, ALOS PALSAR, ALOS-2), thermal (MODIS), terrain (SRTM, Copernicus GLO-30, GEDI), magnetics (EMAG2), hydrology (MERIT Hydro) and land cover (Dynamic World). We group them into five evidence families and score them together, because no single layer is reliable enough on its own.
Is it a satellite gold detector or a gold prospecting app?
In a sense, yes, but it's software rather than a handheld device. Instead of sweeping ground by hand, you have Mining Pro scan the whole license, hundreds of hectares at once, and rank where gold or another target mineral is most likely. It all runs in a browser.
Does it offer 3D mining visualization?
Yes. The 3D Viewer shows terrain, depth, grade, drill-target vectors and an economic heat map in a single scene that you can rotate and view from four compass directions. The Drillholes tool has its own 3D mode for collars, surveys and assays.
Can I export to Leapfrog, Vulcan, Surpac or Datamine?
Yes. DXF files import into Leapfrog, Vulcan, Surpac and Datamine, Leapfrog also reads OMF, and Surpac STR/DTM is native to GEOVIA Surpac. Everything exports in real-world UTM coordinates, so the files land in the right place when you import them.
Which countries and minerals has Farmonaut worked on?
Mining Pro is used by 100+ mining businesses in 25+ countries. Across all mineral exploration work in FY2025-26 and FY2026-27 to date, Farmonaut has analyzed 391,956 acres in 33 countries for 23 minerals, including gold, copper, lithium, cobalt, tin, uranium, diamond and bentonite.
How do I learn the platform?
Watch the free 16-chapter video course (4h 10m). It covers each tool on an actual demonstration license, from the physics of satellite detection through to a conceptual mine plan.
All Mining Pro outputs are satellite-derived Exploration Targets, and the mine-planning figures shown for the demonstration license are conceptual.
Open Mining Pro in your browser
You can start using it now or watch the course first. If you'd rather have our team prepare a finished report on your license, request a quote.
More Farmonaut solutions
Case studies from real exploration projects
How licence holders and exploration teams used our satellite analysis to find and rank targets before drilling.

 Kidepo Associates
 GKY Mining
 Alkimy SARL
 Double A Trading
 Qader Group
 Ileys General Trading
 SG Gold Mining LLC
 VRV Global Pte Ltd
 Omsri International FZE
 G.I.T.T.
 Jaunita Erss Ltd
 Almosi SARL
 SRK Consulting
 Mwerezi Minerals Company Limited
 Mining SARL
 SenGold Invest SAS
 Sean Mining Limited
 Exploration consultancy · South Africa · Gold










