

Industry outlook · Trends with data
Mining and Metals Industry Trends: 8 Shifts With Data
The main trends are record metal prices, demand from electric vehicles and data centres, concentrated supply and slow mine development. Each one is shown with dated figures from the World Bank, IEA, USGS and World Gold Council.
Key takeaways
- The World Bank forecast in April 2026 that its metals and minerals price index would rise 17% in 2026, with base metals at all-time highs.
- Electric car sales passed 20 million in 2025, up 20% (IEA, Global EV Outlook 2026).
- The top refining country held 72% of refined supply on average in 2025, excluding rare earths, up from 70% in 2023 (IEA, 2026).
- A new US mine for metals such as copper, gold, lithium or nickel takes nearly 29 years from discovery to production on average (S&P Global, July 2024).
- Central banks bought a net 289 tonnes of gold in Q2 2026, a record for a second quarter (World Gold Council).
In this article
- The eight trends at a glance
- Trend 1: Metal prices at record levels
- Trend 2: Electric vehicles and data centres pull on demand
- Trend 3: Supply is concentrated, and export controls are growing
- How far key metal prices have risen
- Trend 4: New mines are slow to build and copper supply is tight
- Where the world's copper comes from
- Supply risk: how concentrated is refining?
- Trend 5: Gold becomes a reserve asset
- Trend 6: Cleaner haul fleets and emissions data
- Trend 7: Recycling and scrap fill part of the gap
- Trend 8: Data and satellite screening before drilling
- What a price move does to a copper mine's revenue
- Risks that could change these trends
The biggest trends in the mining and metals industry right now are record metal prices, demand pulled up by electric vehicles and data centres, supply that is concentrated in a few countries, mines that take decades to build, and a push to cut diesel use. The World Bank forecast in April 2026 that base metals would reach all-time highs this year, with its metals and minerals price index up 17% (World Bank, Commodity Markets Outlook, April 2026, Table 1; press release). This guide ranks eight trends, shows the numbers behind each one, and ends with a copper revenue calculator and answers to common questions.
It is written for consultants, licence holders and investors who need the numbers, not the slogans. Where a figure can change, the date and source are next to it. Some terms are explained on first use: a tonne is 1,000 kg, a refinery turns concentrate into pure metal, and an export control is a government limit on selling a material abroad.
The eight trends at a glance
The trends run in order of the market chain: price first, then demand, supply, time, policy and technology. The table gives the headline number and where it comes from.
| Trend | Headline number | Source |
|---|---|---|
| 1. Record metal prices | Metals and minerals index forecast +17% for 2026 | World Bank, April 2026 |
| 2. Electrification and data centres | More than 20 million electric cars sold in 2025 | IEA, Global EV Outlook 2026 |
| 3. Concentrated refining and export controls | Top refiner holds 72% of supply on average (excluding rare earths) | IEA, Critical Minerals Outlook 2026 |
| 4. Slow, tight supply | Nearly 29 years from discovery to production in the US on average | S&P Global, 2024 |
| 5. Gold as a reserve asset | 289 tonnes bought by central banks in Q2 2026 | World Gold Council, July 2026 |
| 6. Cleaner haul fleets | Haul trucks typically cause 30-50% of an open-cut mine’s direct (Scope 1) emissions | ICA Australia / ConnectOre, 2026 |
| 7. Recycling and scrap | About 30% of US copper supply came from scrap | USGS, 2026 |
| 8. Data and satellite screening | Earlier, cheaper targeting before drilling | See the section below |
Trend 1: Metal prices at record levels
Prices are the first thing every mining plan reacts to. In April 2026 the World Bank expected the average copper price to reach US$12,000 per tonne in 2026, up from US$9,947 in 2025. It expected gold at US$4,700 per troy ounce and silver at US$70, up from US$3,442 and US$39.8 (World Bank, April 2026, Table 1). The bank’s press release also said precious metals prices were forecast to rise 42% on average in 2026 as investors sought safe assets (World Bank press release, 28 April 2026).
Chart
World Bank price indexes, forecast to 2027
Index, 2010 = 100, nominal US$; 2026 and 2027 are April 2026 forecasts
Market prices have since run above that forecast for copper. The London Metal Exchange (LME) three-month contract closed at US$14,436 per tonne on 14 October 2026, according to the weekly brief of the International Copper Association Australia (ICA Australia, 15 October 2026). The same brief put the New York COMEX price up about 34% on a year earlier.
The World Bank also expects a pause. It forecast the metals and minerals index to fall about 7% in 2027 as costs ease and the aluminium squeeze moderates. A price spike is a reason to plan, not a promise that it will last.
Trend 2: Electric vehicles and data centres pull on demand
Electric car sales passed 20 million worldwide in 2025, up 20% on 2024, and reached a 25% share of new cars (IEA, Global EV Outlook 2026). Growth is uneven. The IEA reports that first-quarter 2026 sales of about 3.9 million were 8% lower than a year earlier, mainly because of weaker sales in China and the United States, while Europe grew by close to 30%.
The World Bank names data centres, electric vehicles and renewable energy as the industries behind strong demand for aluminium, copper and tin. All three need cables, motors and other electrical equipment, which use these metals. A mine owner cannot read demand from one sector alone, so it helps to track all three.
▶ Explains what mining contributes to economies and why energy-transition minerals are in demand. · 5:03
Trend 3: Supply is concentrated, and export controls are growing
The International Energy Agency (IEA) found that supply concentration turned into a real cost in 2025. The number of mineral tariff codes under Chinese export controls has tripled since 2023. In April 2025 China controlled seven heavy rare earth elements, and the IEA says some automakers cut output as a result. The wider October 2025 measures were suspended until November 2026. The IEA estimates that US$6.5 trillion of yearly downstream production outside China would be at risk if they were fully applied (IEA, Global Critical Minerals Outlook 2026).
Other producers acted too. The Democratic Republic of the Congo set a cobalt export quota, Zimbabwe limited lithium trade and Mozambique limited graphite. The IEA says cobalt prices rose by around 130%, largely because of the DRC export quota. Outside rare earths, the top refining country’s average share of supply rose to 72% in 2025 from 70% in 2023.
For licence holders this means a deposit outside the dominant refining country may be easier to sell to buyers who want to diversify. It also means buyers will ask where a concentrate will be refined before they sign an offtake agreement.
How far key metal prices have risen
The IEA reported how far prices have climbed over 2025 and early 2026. Base metals rose by about a third between January 2025 and April 2026. The IEA gives no start date for the other three, so read the chart as “rises reported by the IEA”, not as one common period. Lithium is shown at the floor of “more than doubled”, cobalt at around 130% and tungsten at its reported sixfold rise.
Chart
Price rises reported by the IEA for selected metals
Per cent increase as reported by the IEA. Periods differ: base metals January 2025 to April 2026; no start date given for the others. Lithium shown at its floor of ‘more than doubled’, tungsten at sixfold
Trend 4: New mines are slow to build and copper supply is tight
Copper shows the problem clearly. The USGS estimates that world mine output stayed at about 23 million tonnes in 2025, with Chile alone at 5.3 million tonnes (USGS, Mineral Commodity Summaries 2026, Copper). The ICA Australia brief adds that Morgan Stanley expects flat or lower mine output in 2026, which would be the first annual fall since 2017, and that Chile mined 3.2 million tonnes in January to August, down 8%.
The IEA says the projected copper supply gap in 2035 narrowed from about 30% in its previous outlook to 25% as new projects advanced, mainly in the DRC and Zambia. That is better, but still a large gap. Forecasters also disagree about 2026: the International Copper Study Group sees a refined surplus of 104,000 tonnes this year, while Goldman Sachs models a 640,000-tonne deficit outside the United States (ICA Australia, 15 October 2026).
Time is the other limit. S&P Global studied 268 mines producing metals such as copper, gold, lithium, nickel and zinc, and found that a new US mine takes nearly 29 years on average from discovery to production. Mines still in development were counted as starting in 2030, which S&P calls optimistic. Canada averaged 27 years and Zambia 34 (S&P Global, July 2024). A discovery made today is unlikely to add supply before the 2040s, which is why existing mines, scrap and better targeting all matter.
The final 2025 US critical minerals list, published on 7 November 2025, added copper, lead, silver, rhenium, silicon and potash to the 2022 list (USGS, Copper, 2026). Copper is now on it, so governments treat base metals as strategic, not only battery metals. If you hold a licence, our guides on lithium deposit types and tin exploration show how targeting differs by metal.
Where the world’s copper comes from
The chart below shows the six largest copper mining countries in the USGS estimate for 2025. Chile and the DRC together mine more than a third of the world total, so one strike or one export rule can move the whole market.
Chart
Copper mine output by country, 2025 estimate
Thousand tonnes of contained copper; world total about 23,000
Supply risk: how concentrated is refining?
Two IEA measures moved in different directions. The projected copper gap for 2035 narrowed, while the share held by the top refining country rose. The chart shows both.
Chart
Two supply-risk measures, earlier versus latest IEA reading
Per cent. Copper gap: 2035 projection, previous vs 2026 outlook. Refining share: 2023 vs 2025
Trend 5: Gold becomes a reserve asset
Central banks bought a net 289 tonnes of gold in the second quarter of 2026, a record for a second quarter and about five times the revised first-quarter figure of 57 tonnes. First-half buying of 345 tonnes was the lowest for a first half since 2022, because Turkey, Russia and Azerbaijan sold in the first quarter. In the World Gold Council’s reserves survey, 89% of central banks expected global reserves to rise over the next year, and a record 45% planned to add to their own (World Gold Council, Gold Demand Trends Q2 2026).
Gold exploration work includes mapping alteration and structures before drilling, which our satellite-based mineral detection page describes.
Trend 6: Cleaner haul fleets and emissions data
The International Council on Mining and Metals (ICMM) now publishes a global emissions dataset built with Wood Mackenzie. It combines Scope 1 and Scope 2 data from around 1,700 facilities across 14 commodities, covering about 87% of global production (ICMM, Global Mining and Metals Greenhouse Gas Emissions Dataset). Scope 1 means emissions from a site’s own fuel and processes, and Scope 2 means emissions from the electricity it buys.
At most open-cut mines, diesel haul fleets typically account for 30-80% of a site’s direct (Scope 1) emissions, and haul trucks alone for 30-50%, according to a June 2026 briefing by ConnectOre reported by ICA Australia. The same source says battery-electric haul trucks have moved from prototype to on-site trials. BHP, Rio Tinto and Caterpillar began trialling Cat 793 XE battery trucks at Jimblebar in Western Australia in late 2025, and Fortescue validated a 240-tonne battery truck with a 6 MW fast charger. The briefing finds that the hardest problems are now power supply, charging and grid connection, not the truck (ICA Australia, Haulage Electrification).
Trend 7: Recycling and scrap fill part of the gap
In the United States, copper recovered from scrap supplied about 30% of copper supply in 2025. Old scrap, from products at the end of their life, provided an estimated 160,000 tonnes, and new scrap from factories about 760,000 tonnes (USGS, Copper, 2026). Scrap does not remove the need for new mines, but it lowers the amount that has to be mined and refined.
Trend 8: Data and satellite screening before drilling
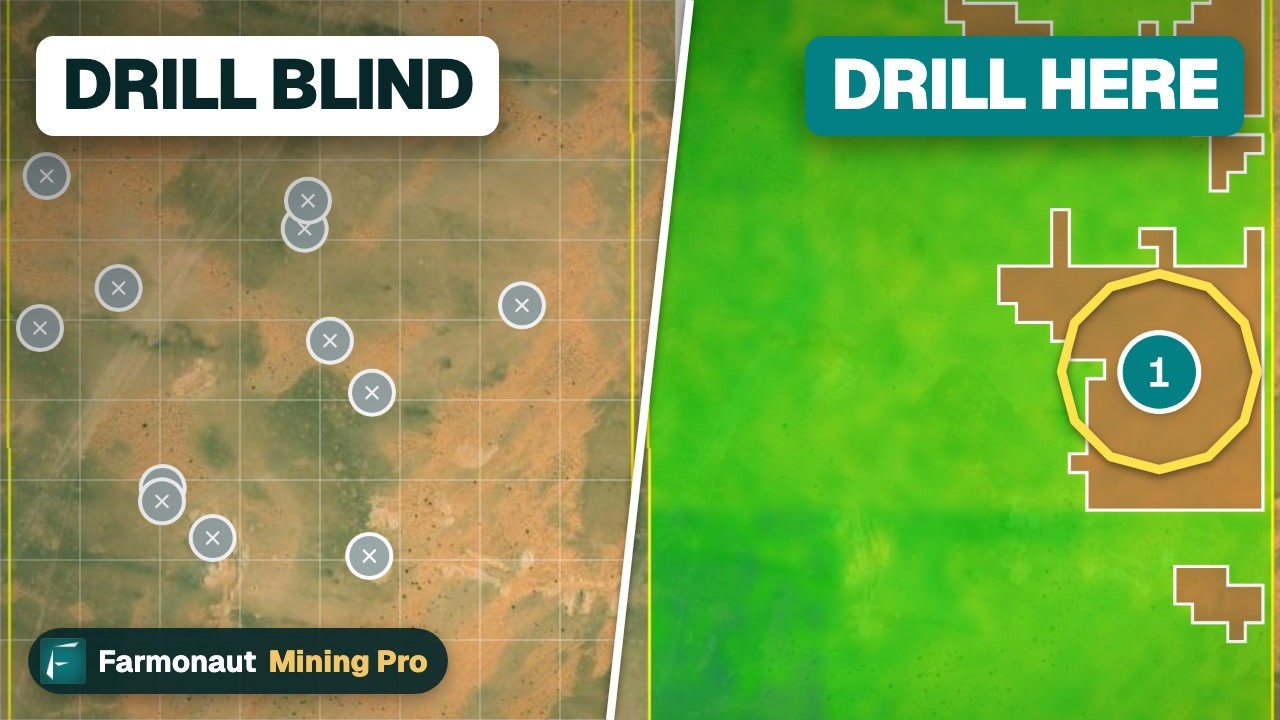
Because mines take decades, the first step, deciding where to look, is the one a team can shorten. Satellites cannot see ore at depth, but they map iron staining, clay minerals and fault patterns that guide where to sample. Farmonaut turns a licence boundary into a satellite mineral screening, normally in 5-20 business days, from a KML, KMZ or polygon file. The result is an exploration target that comes before a resource estimate, not a resource itself. You can send a licence area for a quote, or read how airborne surveys compare in cost and detail.
The video below explains what an AI mining app does and who builds one.

▶ What an AI mining app does, the three jobs it can do and who builds one. · 3:52
What a price move does to a copper mine’s revenue
The calculator below turns ore tonnes, grade, recovery and a price you choose into recovered copper and gross revenue. It shows that gross revenue moves one-for-one with price: a 20% price rise adds 20% to the revenue line. Use your own figures; the defaults are round examples.
Calculator
What is the copper in my ore worth?
Enter your own tonnage, grade, recovery and price.
- Gross metal value (US$ per year): $42,500,000
- Value per tonne of ore (US$): 42.50
Example values only, not a forecast or any mine’s figures. Use today’s price from the LME or your broker. Revenue is gross metal value before costs, royalties and smelter charges.
Risks that could change these trends
The World Bank’s April 2026 outlook assumes the worst disruptions in the Strait of Hormuz end in the second quarter. It warns that a longer conflict, or weaker growth in China, would move metal prices. The IEA warns that the policy choices of a few producers can reshape supply quickly, as the DRC cobalt quota did. Investors and licence holders should therefore test a project at several prices, not one. If you are raising money, our guide to where to meet mining investors and what they check covers what they will ask for.
What this means for a licence holder or consultant
- Price high does not mean price safe. Run your numbers at a lower price as well as today’s.
- Ask about refining. Where a concentrate is processed can change its value and its buyers.
- Plan for long lead times. A target found now is a decade-long path to a mine, so permitting and community work should start early.
- Collect your own data. Clean maps, samples and targets speed up every later step. For help, contact the Farmonaut team.
Frequently asked questions
What are the main trends in the mining and metals industry?
The main trends are record metal prices, rising demand from electric vehicles and data centres, supply concentrated in a few countries, long mine development times, strong central bank gold buying, cleaner haul fleets and more recycling.
Why are metal prices so high?
The IEA links the rise to tight supply: base metals such as aluminium, copper and tin rose by about one-third between January 2025 and April 2026. The World Bank adds strong demand from data centres, electric vehicles and renewable energy.
What is the copper price today?
The LME three-month contract closed at US$14,436 per tonne on 14 October 2026 (ICA Australia, 15 October 2026).
Will there be enough copper for the energy transition?
The IEA projects a supply gap of about 25% in 2035 based on the current project pipeline, down from 30% in its previous outlook. Forecasters disagree about the near-term balance: the ICSG sees a 2026 surplus and Goldman Sachs a deficit outside the United States.
How long does it take to open a new mine?
S&P Global found an average of nearly 29 years from discovery to production in the United States, 27 years in Canada and 34 years in Zambia, based on 268 mines that produce metals such as copper, gold, lithium and nickel (July 2024).
Why do central banks buy gold?
The World Gold Council survey found that 89% of respondent central banks expected global reserves to rise over the next year. Buying was uneven in the first half of 2026, with some banks selling and others adding, but the Council describes central bank sentiment towards gold as exceptionally strong.
How much of mining’s emissions come from trucks?
At most open-cut mines, diesel haul fleets typically cause 30-80% of a site’s direct (Scope 1) emissions, and haul trucks alone 30-50%, according to a 2026 ConnectOre briefing summarised by ICA Australia.
What are export controls and why do they matter?
They are limits a government puts on selling a material abroad. The IEA counts three times as many Chinese-controlled mineral tariff codes as in 2023, and says they turned supply concentration into an immediate economic risk.
How much copper comes from recycling?
In the United States, scrap supplied about 30% of copper supply in 2025 (USGS).
Can satellites find new mineral deposits?
Satellites map surface clues such as alteration minerals and faults. These help rank where to sample, but only drilling confirms a deposit. Satellite results are exploration targets, not resource estimates.
This page is for information only. It is not investment advice or legal advice. Prices and forecasts are dated; confirm current figures and the rules that apply to your licence with the regulator.
Farmonaut mining
Map your mining site from space
Consultants can send a licence boundary for a satellite mineral screening that gives exploration targets ahead of a resource estimate.

Mining Pro sample view, synthetic data
Keep reading
Sources
- IEA, Global Critical Minerals Outlook 2026: executive summary: iea.org
- World Bank, Commodity Markets Outlook, April 2026: price forecasts (Table 1): thedocs.worldbank.org
- World Bank, press release on the April 2026 Commodity Markets Outlook: worldbank.org
- IEA, Global EV Outlook 2026: iea.blob.core.windows.net
- USGS, Mineral Commodity Summaries 2026: Copper: pubs.usgs.gov
- World Gold Council, Gold Demand Trends Q2 2026: Central banks: gold.org
- ICA Australia, Copper Weekly Brief, 15 October 2026: copper.com.au
- ICA Australia, Material Movement: Haulage Electrification (ConnectOre, June 2026): copper.com.au
- ICMM, Global Mining and Metals Greenhouse Gas Emissions Dataset: icmm.com
- S&P Global, Mine Development Times: The U.S. in Perspective (July 2024): press.spglobal.com
Discussion
Questions, corrections or field experience? Share them below. First-time comments are reviewed before they appear, and your email is never published.
No comments yet. Be the first to add a question or your experience.

 Sahara Mining
 Sean Mining Limited
 NTS Group (Pty) Ltd
 Mine4Africa
 Lithspo Minerals Limited
 Tintina Mining Group
 Dalgety Minerals Pty Ltd
 Vortex Minerals Pty Ltd
 Faith At Work (Pty) Ltd
 Geotech Mining Solutions plc
 Vulcan International Limited
 Kidepo Associates
 GKY Mining
 Alkimy SARL
 Double A Trading
 GemSprout Metals Limited
 Qader Group
 Ileys General Trading
 SG Gold Mining LLC
 VRV Global Pte Ltd
 Omsri International FZE
 G.I.T.T.
 Jaunita Erss Ltd
 SRK Consulting
 Berks Gold Limited











