

Farmonaut AI Field Intelligence · Case Study · Georgia, USA
Precision Blueberry Farming Powered by Satellite AI Across Georgia’s Finest Farms
How 61 blueberry fields spanning ~518 acres in Appling & Bacon Counties, Georgia, are leveraging Farmonaut’s satellite monitoring and AI advisory platform to optimise yield, reduce input waste, and stay ahead of pest pressure — all in real time.
Executive Summary
A comprehensive look at how Georgia’s blueberry producers are transforming farm management through satellite intelligence and AI-driven decision support.
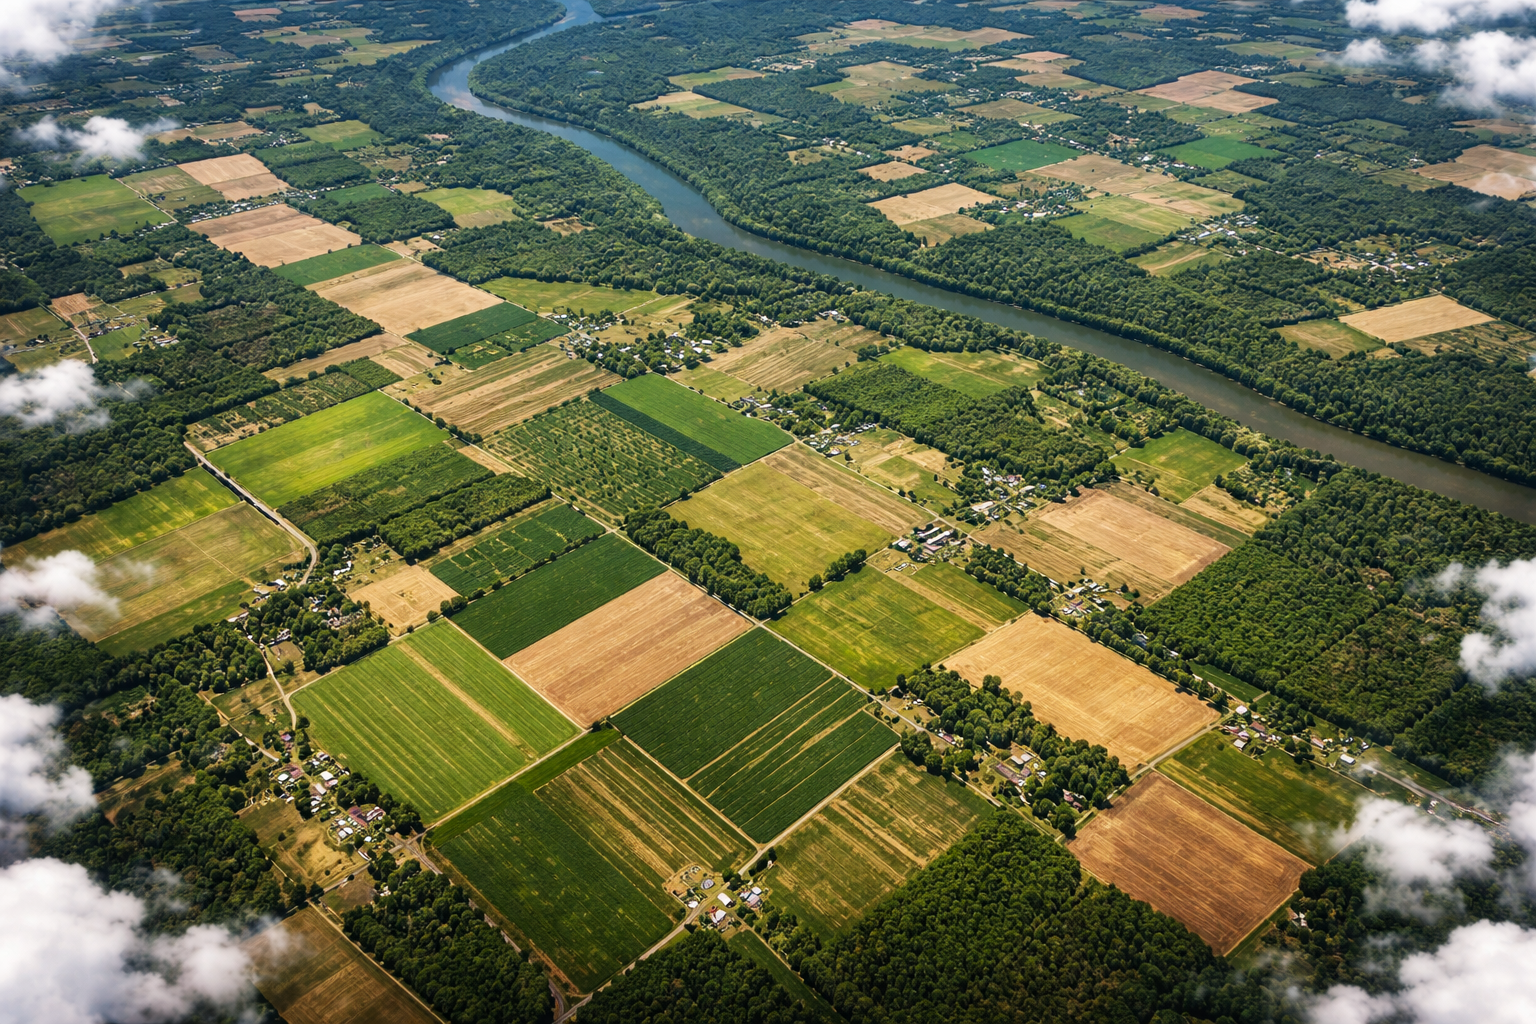
A group of blueberry growers in Appling County (the “Applin” and “Pine” farm clusters) and Bacon County (the “Field” and “Randy” farm clusters), Georgia, enrolled their entire blueberry operations — 61 distinct field plots covering ~518 acres — into the Farmonaut Satellite AI Advisory platform.
The platform delivers automated, field-specific advisories every 2–5 days by fusing multi-spectral optical imagery (Sentinel-2) with Synthetic Aperture Radar data (Sentinel-1) and regional weather models. Seven distinct advisory modules run simultaneously for each field: Pest & Disease, Irrigation, Fertilisation, Weed Management, Soil Health, Crop Health (NDVI/NDWI), and Growth & Yield Estimation.
For the 2026 blueberry season, fields are currently in the critical Bloom and Bud Swell stages (February–March 2026). Harvest is expected to begin April 2026 and run through July 2026, with farm-wide average yields projected at 3,650 kg per acre.
“Having satellite-based NDVI and irrigation recommendations arriving for every field, every few days, means we can catch problems before they become crop losses — something no scouting programme could match across 500+ acres.”
— Georgia Blueberry Producer, Appling County
| Farm Group | Fields | Area (ac) | County |
|---|---|---|---|
| Applin Farm | 19 | 97.5 | Appling |
| Pine Farm | 4 | 60.4 | Appling |
| Randy Farm | 10 | 67.8 | Appling |
| Field Farm (numbered) | 28 | 292.8 | Bacon |
| Total | 61 | ~518 | GA, USA |
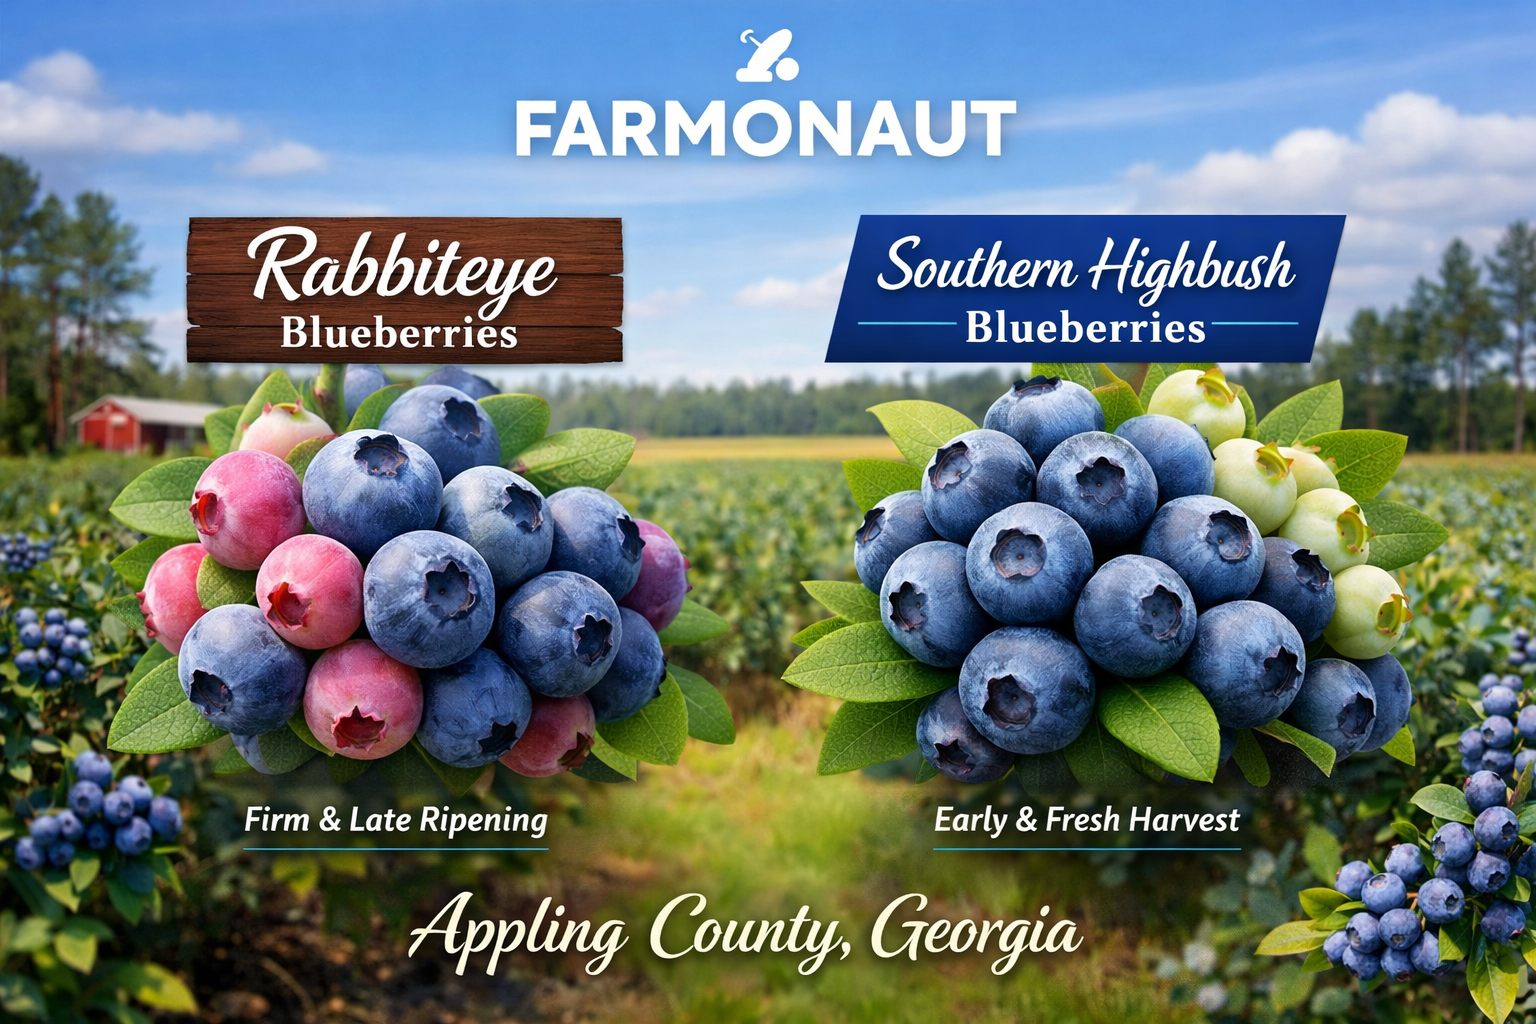
Mix of Southern Highbush (Optimus, Patrecia, Farthing, Legacy) and Rabbiteye (Brightwell, PowderBlue, Premier) varieties suited to Georgia’s climate.
The Farmonaut Technology Stack
Every field advisory is the output of a multi-layer data fusion pipeline combining space-borne remote sensing, agro-meteorological modelling, and AI-driven agronomic logic.

Farmonaut AI Dashboard — Field-level advisory reports, NDVI maps & irrigation schedules
Module 1 — Crop Health Monitoring
Sentinel-2 derived NDVI and five-class satellite imagery classify each field’s vegetation health on every available cloud-free overpass.
Crop Health Colour Classes (as of 18–21 March 2026)
Field-Level Crop Health Snapshot
Module 2 — AI Irrigation Advisory
Field-specific daily irrigation schedules computed from FAO-56 Penman-Monteith evapotranspiration, Sentinel-1 RSM, NDWI, and 7-day weather probability forecasts.
| Date | Method | Qty (mm) | Time | ET / Rain |
|---|---|---|---|---|
| 19 Mar | ✔ Drip | 3.5 | 05:00–08:00 | Mod · 0.0 mm · 10% |
| 20 Mar | ✔ Drip | 3.2 | 05:00–08:00 | Mod · 0.0 mm · 15% |
| 21 Mar | ✔ Drip | 3.5 | 05:00–08:00 | Mod · 2.1 mm · 30% |
| 22 Mar | ✔ Drip | 3.8 | 05:00–08:00 | High · 0.0 mm · 5% |
| 23 Mar | ✔ Drip | 3.5 | 05:00–08:00 | Mod · 0.0 mm · 10% |
| 24 Mar | ✔ Drip | 3.2 | 05:00–08:00 | Low · 1.5 mm · 25% |
| 25 Mar | ✔ Drip | 3.5 | 05:00–08:00 | Mod · 0.0 mm · 5% |
AI Irrigation Rationale (Mar 2026)
💡 How to Calculate Irrigation Run Time
Formula: Time (hrs) = (Qty mm × Emitter area m²) ÷ Flow rate (L/hr) Example: 3.5 mm × 0.4 m² ÷ 2 L/hr = 0.7 hours (42 minutes) This formula is included in every field advisory for easy on-farm calculation.
Module 3 — Smart Fertilisation
Nutrient application rates are computed per-field using satellite-derived NDVI, regional soil survey data, and UGA Extension Circular 1105 blueberry fertilisation guidelines.
| Nutrient | Current (ppm) | Ideal (ppm) | Status |
|---|---|---|---|
| N | 11.5 | 10.0–20.0 | Moderate |
| P | 38.0 | 30.0–60.0 | Low Gap |
| K | 50.0 | 60.0–100.0 | Moderate |
| S | 12.0 | 10.0–20.0 | Low |
| Zn | 1.2 | 1.0–3.0 | Moderate |
| Nutrient | Chemical Source | Rate (kg/ac) | Organic Alt. | Org. Rate |
|---|---|---|---|---|
| N | Ammonium Sulfate | 15.43 | Feather Meal | 26.75 kg/ac |
| P | Triple Superphosphate | 14.11 | Bone Meal | 42.33 kg/ac |
| K | Potassium Sulfate | 54.6 | Kelp Meal | 1365 kg/ac |
| S | Elemental Sulfur | 2.73 | Composted Pine Bark | 273 kg/ac |
| Zn | Zinc Sulfate | 1.97 | Poultry Litter (aged) | 71 kg/ac |
AI Fertiliser Reasoning
1. Nitrogen (N): Current NDVI of 0.45 at Bloom stage signals active uptake. The 3.24 kg/ac gap is bridged by 15.43 kg/ac Ammonium Sulfate (21% N) via fertigation through the existing drip system.
2. Phosphorus (P): Adjusted for Bloom stage to support root and flower development. Triple Superphosphate (45% P₂O₅) at 14.11 kg/ac meets the 6.35 kg gap.
3. Potassium (K): Critical for fruit set — the largest deficit. Potassium Sulfate (50% K₂O) at 54.6 kg/ac addresses the 27.3 kg gap. Co-applicable with N via fertigation.
4. Sulfur & Zinc: Elemental Sulfur (2.73 kg/ac) maintains pH stability; Zinc Sulfate (1.97 kg/ac) supports enzymatic activity critical for berry development.⚠️ Application Frequency
The AI recommends fertigation every 1–3 days during the bloom stage to prevent nutrient leaching and maintain steady availability. Ammonium Sulfate and Potassium Sulfate can be co-applied through the drip system. Elemental Sulfur should be soil-applied separately.
Reference: University of Georgia Extension Circular 1105 · Southern Region Small Fruit Consortium nutrient-removal guidelines
Module 4 — Pest & Disease Intelligence
The AI cross-references NDVI, NDWI, RSM, phenological stage, and regional IPM models to assign probability scores and solution pairs for every detected threat.
Disease Risk Detected (March 2026)
-
94% HIGHMummy Berry (Monilinia vaccinii-corymbosi)Organic: Mulch burial | Chemical: Indar 2F / Propiconazole
-
81% MODBotrytis Blight (Botrytis cinerea)Organic: Improve airflow | Chemical: Captan 80WDG / Fenhexamid
-
62% MODPhomopsis Twig BlightOrganic: Prune & destroy | Chemical: Topsin M
-
38% LOWExobasidium Leaf SpotOrganic: Copper soap spray | Chemical: Kocide 3000
-
45% LOWPhytophthora Root RotOrganic: Improve drainage | Chemical: Ridomil Gold
Pest Risk Detected (March 2026)
-
96% HIGHBlueberry Gall MidgeOrganic: Entrust SC (Spinosad) | Chemical: Movento spray
-
82% MODFlower ThripsOrganic: Spinosad / Neem oil | Chemical: Acetamiprid / Spinetoram
-
55% MODSpotted Wing DrosophilaOrganic: Kaolin clay | Chemical: Delegate WG
-
40% LOWScale InsectsOrganic: Horticultural oil | Chemical: Dinotefuran
-
32% LOWBlueberry Bud MiteOrganic: Sulphur dust | Chemical: Abamectin
🚨 Alert: High NDWI (0.40) and RSM (0.76) in March create ideal conditions for Mummy Berry and Botrytis Blight during the susceptible bloom window. Gall Midge pressure is at its seasonal peak due to emerging floral tissue. Immediate fungicide and insecticide applications are advised per field-level IPM calendar.
Module 5 — Weed Management
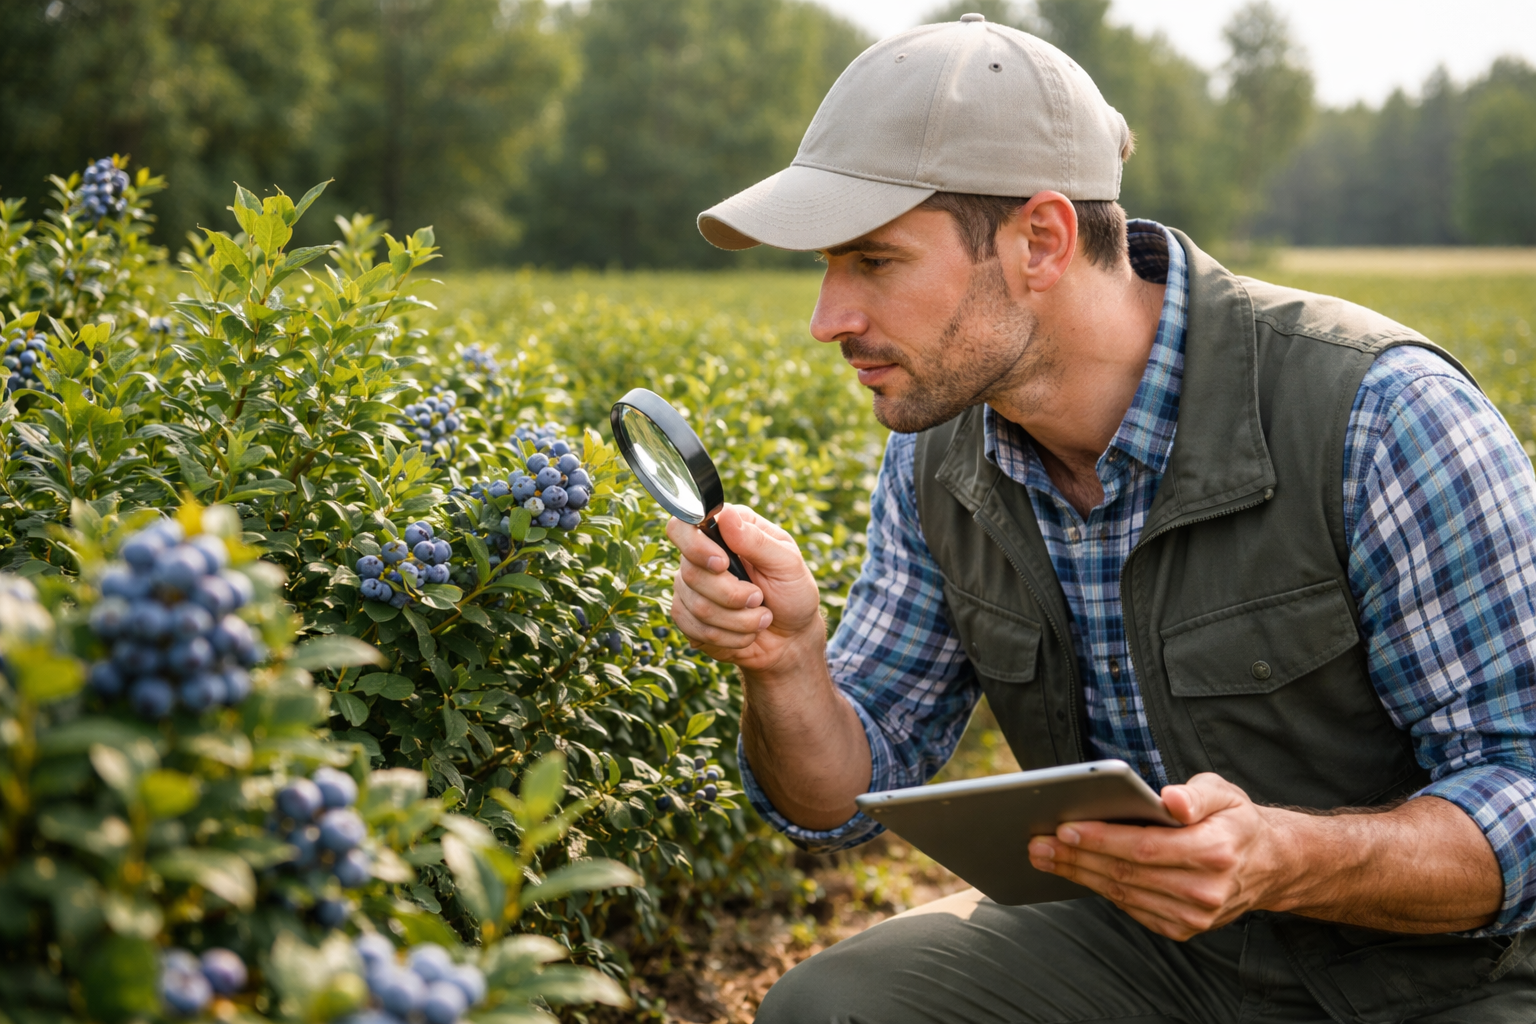
Canopy gap analysis from NDVI time series identifies weed emergence windows; soil moisture data from SAR calibrates germination risk for each species.
Module 6 — Soil Health Management
Soil Organic Carbon (SOC), pH, and salinity assessments derived from USDA NRCS surveys, fertiliser input modelling, and satellite-calibrated soil indices.
Soil Health Indicators — Representative Fields
SOC Range Across All 61 Fields
AI Soil Management Recommendations
Module 7 — Growth & Yield Estimation
Farmonaut’s yield forecasting engine combines satellite NDVI trajectories, phenological stage models, nutrient status, and historical regional yield benchmarks to generate field-level harvest forecasts updated with every satellite pass.
Yield by Farm Cluster
Yield Estimation Methodology
| Field Name | Area (ac) | Variety | NDVI (Mar) | Exp. Yield (kg/ac) | Local Min (kg/ac) | Local Max (kg/ac) | Harvest Period |
|---|---|---|---|---|---|---|---|
| Field 1 – Optimus | 9.87 | Optimus (SHB) | 0.45 | 3,450 | 2,268 | 4,536 | Apr–Jul 2026 |
| Field 2 – Patrecia | 10.12 | Patrecia (SHB) | 0.42 | 3,580 | 2,268 | 4,536 | Apr–Jul 2026 |
| Field 4 – Farthing | 8.84 | Farthing (SHB) | 0.48 | 3,750 | 2,268 | 4,536 | Apr–Jul 2026 |
| Field 57 – Farthing | 15.52 | Farthing (SHB) | 0.46 | 3,680 | 2,268 | 4,536 | Apr–Jul 2026 |
| Field 61 – Optimus | 7.18 | Optimus (SHB) | 0.50 | 3,980 | 2,268 | 4,536 | Apr–Jul 2026 |
| Field-61 | 94.43 | Mixed Rabbiteye | 0.55 | 4,050 | 2,268 | 4,536 | Apr–Jul 2026 |
| Applin 1 | 3.50 | SHB Mixed | 0.53 | 3,580 | 1,814 | 3,628 | Apr 2026 |
| Applin 10 | 8.25 | SHB Mixed | 0.40 | 3,350 | 1,814 | 3,628 | Apr–Jul 2026 |
| Randy 1 | 3.05 | SHB Mixed | 0.44 | 3,420 | 1,814 | 3,628 | Apr–Jul 2026 |
| Pine 3 | 17.21 | Rabbiteye | 0.38 | 3,150 | 1,814 | 3,628 | Apr–Jul 2026 |
| Field-55 | 18.53 | Mixed SHB | 0.47 | 3,720 | 2,268 | 4,536 | Apr–Jul 2026 |
| pine 2 | 19.44 | Rabbiteye | 0.36 | 3,080 | 1,814 | 3,628 | Apr–Jul 2026 |
Why Farmonaut Transforms Blueberry Production
Traditional scouting, manual soil testing, and calendar-based spray programmes cannot match the speed, coverage, or precision of satellite AI advisory at scale.
Measured Impact & Outcomes
Aggregate outcomes from the 2026 blueberry season advisory programme across all 61 monitored fields.
“The NDVI maps showed us that Field 2 was lagging behind the others by nearly two weeks in canopy development — something we would have missed until harvest. We applied extra N and K through the drip and watched the NDVI recover. That field is now tracking our best yield estimate.”
— Farm Manager, Bacon County Blueberry Operation
“We were applying irrigation based on weather station data at the county office, 12 miles away. Farmonaut showed our fields had 0.76 RSM when we thought they were dry. We cut irrigation by 25% that week and saved water and pumping costs without any stress to the crop.”
— Grower, Appling County
Projected Season Outcomes (April–July 2026)
How Farmonaut Works — Step by Step
Getting started is simple. From field registration to AI advisory in minutes.
Ready to Transform Your Farm with Satellite AI Advisory?
Join thousands of farmers across the world who are using Farmonaut’s precision agriculture platform to grow more, spend less, and farm smarter. Start monitoring your fields with satellite intelligence today.
Get Started with Farmonaut View Subscription Plans
 John Deere
 Progenseed
 SkyHarvest
 Polaris Digitech
 Teledarbas
 Wild Oak Farm
 SFX
SFX BACF Africa
 Doodlakine
 Exurbia Geospatial
 FieldZero
 Indico Company
 Kubota
