

Mine monitoring · Practical guide
AI for Environmental Monitoring in Mining Explained
AI flags change in tailings dams, water, ground and land cover so a site team knows where to look first. This guide covers four monitoring jobs with published cases, satellite revisit times, the rules that set what a mine must measure, and a budget calculator.
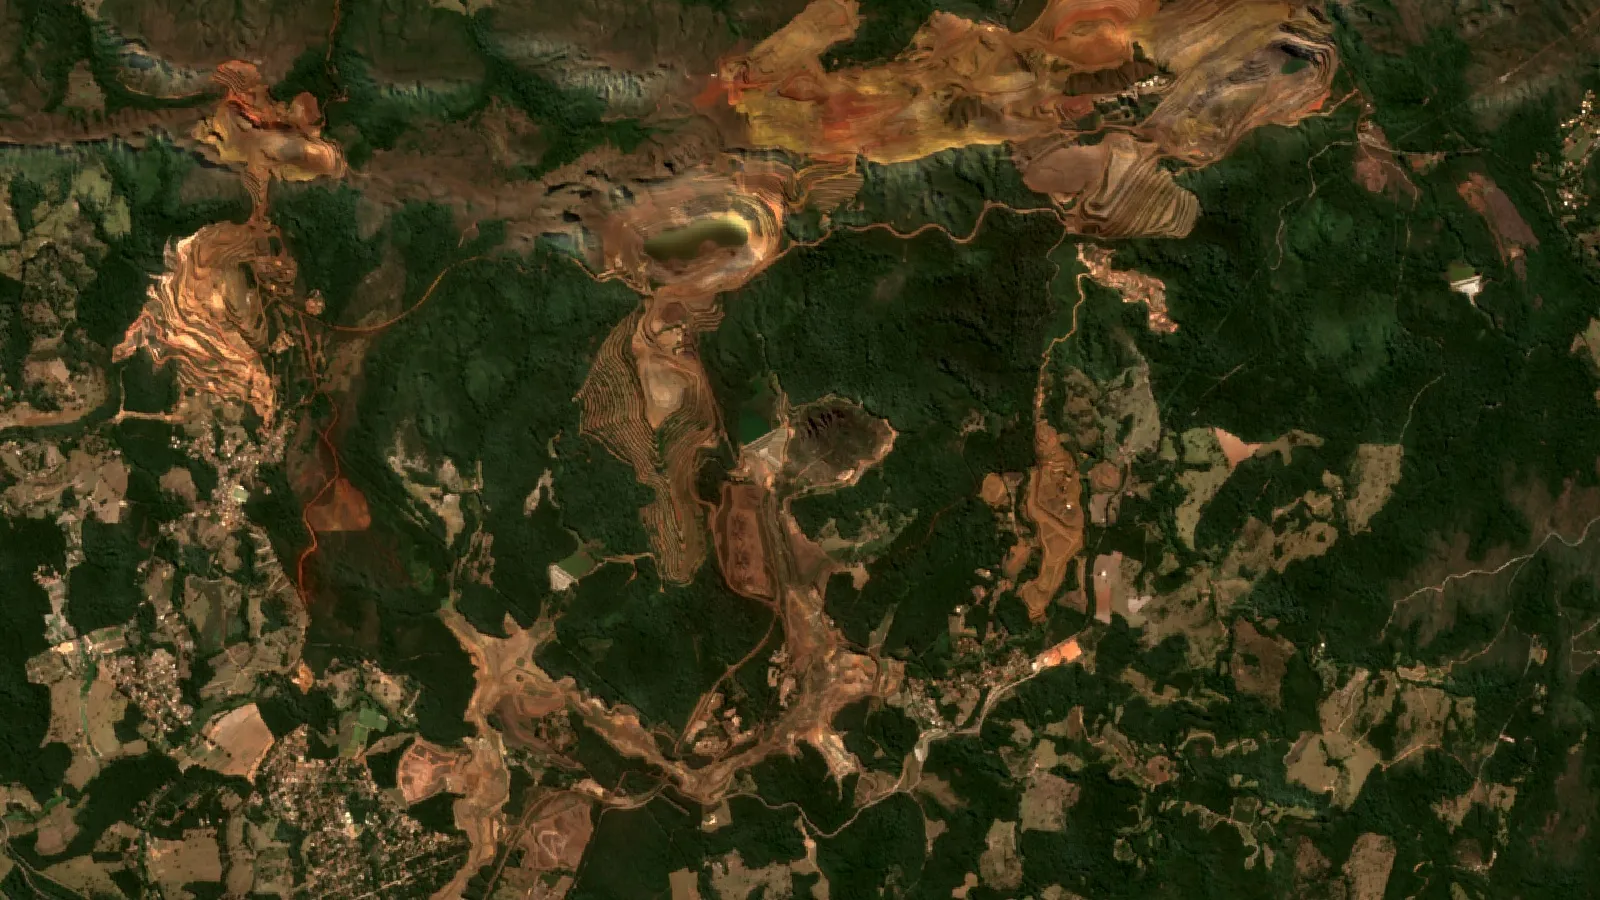
Key takeaways
- Three tailings failures (Mount Polley, Fundao, Brumadinho) released 24.4 (tailings and water), 43.7 and 12 million cubic metres; each was described as sudden (Marr, US National Academies presentation, 2019).
- A Brumadinho radar study found movement that did not fit normal settlement, and said the failure interval might have been forecast 75 days ahead; a reliable date could not be given (Grebby et al., 2021).
- Design revisit times are 5 days for Sentinel-2, 6 days for Sentinel-1 and 8 days for Landsat 8 and 9 together (ESA, NASA); real intervals vary by location and cloud.
- A USGS water network in the San Juan watershed sends pH, turbidity, temperature and conductance every 15 minutes from 12 sondes (EPA, April 2021).
- Canada’s metal and diamond mine effluent rules require biological monitoring studies and interpretative reports at 36-month intervals; AI helps with data checks, not with the studies themselves (SOR/2002-222).
In this article
- How we chose these jobs
- Tailings dam monitoring: sensors, radar and alerts
- Water quality and acid mine drainage monitoring
- Land disturbance and rehabilitation from space
- Ground movement, dust and air
- Which satellites watch a mine, and how often
- What the rules ask you to measure
- How to set up a monitoring programme in 6 steps
- Monitoring programme budget calculator
- Limits of AI monitoring
- Where satellite screening fits before monitoring starts
- Frequently asked questions
AI helps with mine monitoring by turning streams of sensor and satellite readings into early warnings: a dam wall that moves faster than before, a creek whose pH drops, a pit slope that creeps. It does not replace field sampling or a permit. It tells the site team where to look first. This guide covers four monitoring jobs where sensors, radar or optical satellites are already in use, the data each one needs, what the rules ask a mine to measure, and a budget calculator you can fill in with your own prices.
The four jobs are: (1) tailings dam movement, (2) water quality and acid mine drainage, (3) land disturbance and rehabilitation, and (4) ground movement, dust and air, plus the compliance reporting that ties them together. Every number below carries its source and date, and the examples come from published papers, regulators and space agencies rather than vendor brochures.
How we chose these jobs
We picked jobs that meet three tests. First, a regulator, an industry standard or a peer-reviewed paper describes the monitoring need. Second, the data can be collected on a licence area without a mine already being fully instrumented. Third, a published case shows what the data revealed. We left out broad claims such as fully autonomous mines and generic “digital twin” tools, because none of the sources we opened gives site-level results for them.
The page is written for mining business owners, licence holders and the consultants who advise them. It uses plain terms. A tailings dam is the embankment that holds the fine waste left after ore is crushed and processed. Acid mine drainage is acidic water formed when sulphide minerals in exposed rock meet air and water. InSAR (interferometric synthetic aperture radar) compares radar images from different dates to measure ground movement of a few millimetres.
Tailings dam monitoring: sensors, radar and alerts
Tailings dams are the clearest case for monitoring because failures come with little warning and the damage is large. A 2019 presentation to a US National Academies committee compared three modern failures: Mount Polley in Canada (2014), Fundão in Brazil (2015) and Brumadinho in Brazil (2019). The presentation lists spilled volumes of 24.4, 43.7 and 12 million cubic metres, and describes each failure as sudden. The chart below plots those volumes.
Chart
Volume spilled in three tailings dam failures
Million cubic metres of liquefied tailings (Mount Polley figure includes water)
On the ground, a monitoring set for a dam normally includes piezometers (instruments that read water pressure in the embankment and foundation), survey prisms or GNSS receivers for surface movement, inclinometers, and weather and rainfall gauges. Two general approaches are used on top of these readings (we did not find a published result from a named dam). Unsupervised models flag readings that depart from the usual pattern without needing labelled failures. Forecasting models compare expected pore pressure with the measured value after heavy rain, so a rising line is noticed earlier. The models are only as good as the sensors: a drifting piezometer produces a false alarm or hides a real trend.
What radar from space adds
InSAR adds a second view that does not depend on instruments installed on the dam. In a study of Brumadinho, researchers processed Sentinel-1 radar images from August 2017 to January 2019 and found movement patterns that did not fit ordinary settlement. They report that the failure interval might have been forecast as early as 75 days before the collapse, but that adding later observations would not have allowed a reliable failure date to be given. That is a retrospective result, not a working alarm. A separate preprint applied a statistical method to the same time series and reported signs of risk at least five months before the 25 January 2019 collapse; it has not been peer reviewed in the version we read.
A routine example is less dramatic. A 2023 paper measured the No. 4 tailings dam at the Dexing copper mine in China with Sentinel-1 and the SBAS-InSAR method. It found deformation rates between -46 mm/yr and +13 mm/yr along the line of sight, with the fastest movement near the dam crest. The authors link the movement to the stored deposits and the construction materials of the dam body. The value of such a map is that it shows which part of a structure moves differently from the rest, so engineers know where to put a prism or a piezometer.
Where industry standards place monitoring
The Global Industry Standard on Tailings Management, published in August 2020, has six topic areas, 15 principles and 77 auditable requirements. Its third topic area calls for a comprehensive monitoring system to support the observational method, in which a design is checked against measured performance throughout the life of the facility. The standard is directed at operators. Whether it applies to your site depends on your company membership, lender terms and local rules.
Water quality and acid mine drainage monitoring
Water monitoring has two layers. Continuous sondes (multi-parameter probes placed in a stream or discharge) read temperature, pH, turbidity and specific conductance every few minutes. Lab sampling confirms the metals, sulphate and other analytes that a probe cannot read. AI is useful where the stream of readings is large: it learns the normal daily and seasonal pattern at each station and flags departures, such as a pH drop after a storm.
The US Geological Survey shows how a threshold network works in the San Juan watershed of Colorado and Utah. The agency maintains 12 sondes that transmit temperature, pH, turbidity and specific conductance every 15 minutes, and users can subscribe to text or email alerts when a reading crosses a threshold they choose (EPA fact sheet EPA 841-F-21-004, April 2021). A mine can copy the pattern with its own stations upstream and downstream of the discharge.
Spotting acid mine drainage from the air
Acid mine drainage forms when sulphide minerals oxidise, producing sulphuric acid that frees metals such as arsenic, lead and cadmium. Imaging spectroscopy looks for minerals that mark pyrite oxidation, such as jarosite, and for the iron oxides that form afterwards. Czech Geological Survey researchers tested this at the Lítov post-mine dump in the Sokolov lignite basin. They report that a radial basis function support vector machine identified acid drainage hot spots better than the other machine learning methods tested, using both drone hyperspectral images and Sentinel-2 data, validated against X-ray diffraction mineralogy (IMWA 2025 conference paper). It is one site and one coal dump, so treat it as proof of method rather than a guarantee at your mine.
For a local example of how a mine’s land and water effects are reported, see our post on Sibanye-Stillwater’s Montana operations. Process chemistry matters as well; our explainer on cyanide heap leaching shows where solution ponds and leach pads need water checks. The video below explains seven ways mining changes land and water, in plain terms, and is a good primer for a board or community meeting.

▶ A plain-language claymation on the seven environmental impacts of mining. · 2:31
Land disturbance and rehabilitation from space
Satellites are the cheapest way to answer a simple question: how much ground has the operation disturbed, and how much has been rehabilitated? A mapping team used Sentinel-2 images for 2019 to inspect more than 34,000 mining locations and published 44,929 polygons covering 101,583 km2 of large-scale and artisanal mining, including open cuts, tailings dams, waste rock dumps and water ponds (Maus et al., Scientific Data, 2022). Our post on diamond mining’s environmental risks and fixes covers one commodity in more detail. The data set is a useful benchmark for any one site: you can overlay your licence on it to see what an independent map shows.
Chart
Mining area is concentrated in a few countries
Per cent of 145 countries with mapped mining, and per cent of mapped area (2019 imagery)
The same dataset shows how concentrated mining land is. Six countries (Russia, China, Australia, the United States, Indonesia and Brazil) hold 52% of the mapped area, the next 21 countries hold 39%, and the other 118 countries together hold 9%. Russia and China are close in total area, at about 11,771 and 10,365 km2, but China has 8,795 polygons against 2,825 in Russia, which points to many more small sites.
For a single licence, a typical workflow compares a vegetation index such as NDVI (a ratio of near-infrared to red light that rises with green plant cover) across dry seasons, and checks bare-ground area against the disturbance footprint in the approved plan. The satellite does not say whether a revegetated area meets a closure criterion. A site visit and the criterion in your permit still decide that.
Ground movement, dust and air
Ground movement outside the dam matters too. In the Salar de Atacama in Chile, where lithium brine is pumped, researchers combined PAZ and Sentinel-1 radar and found that land above depleted aquifers sank by about 1.5 cm over seven months (ESA Earth Online, January 2026). The same approach applies to open-pit slopes, waste dumps and underground workings. A mine that sees a settlement trend early can adjust pumping, backfill or the pit design before a haul road or a pipeline is damaged.
Dust, air and noise are monitored at the fence line and at the nearest homes. Typical instruments are optical particle counters for dust, gas analysers for combustion and blasting fumes, a weather mast for wind direction and speed, and sound level meters and seismographs for blast vibration. Which instruments you need, where they stand and which limits apply are set by your permit and local regulator, so start from the permit conditions rather than from a vendor catalogue. A data tool can line up a dust reading with wind direction and haul-road traffic. We did not find a published mine case with results for this, so treat it as general practice.
Which satellites watch a mine, and how often
Three public satellite programmes cover most mine monitoring: Sentinel-2 (optical, 10 m detail in four bands), Sentinel-1 (radar, works through cloud and at night) and Landsat 8 and 9 (optical and thermal, 30 m detail in most bands). The chart compares their design revisit times. Actual revisits vary by location, and cloud blocks optical images, so plan on fewer usable scenes than the headline figure.
Chart
Design revisit time of public satellites
Days between passes over the same place (design values)
The Sentinel-2 mission has twin satellites with 13 spectral bands (four at 10 m, six at 20 m and three at 60 m) and a nominal 5-day revisit at the Equator for the pair (ESA SentiWiki). Sentinel-1 is designed as two satellites that can image the entire Earth every six days (ESA). Over the Brumadinho site the Sentinel-1 revisit was 12 days in the study period, which is why site-specific checks matter. Landsat 9 joins Landsat 8 so that the pair observes the same location every 8 days (NASA).
Radar tells you the ground moved. Optical images tell you what changed on the surface. Neither tells you why, which is why the best set-ups combine them with a few ground instruments. The video below explains remote sensing for mining in about two minutes.
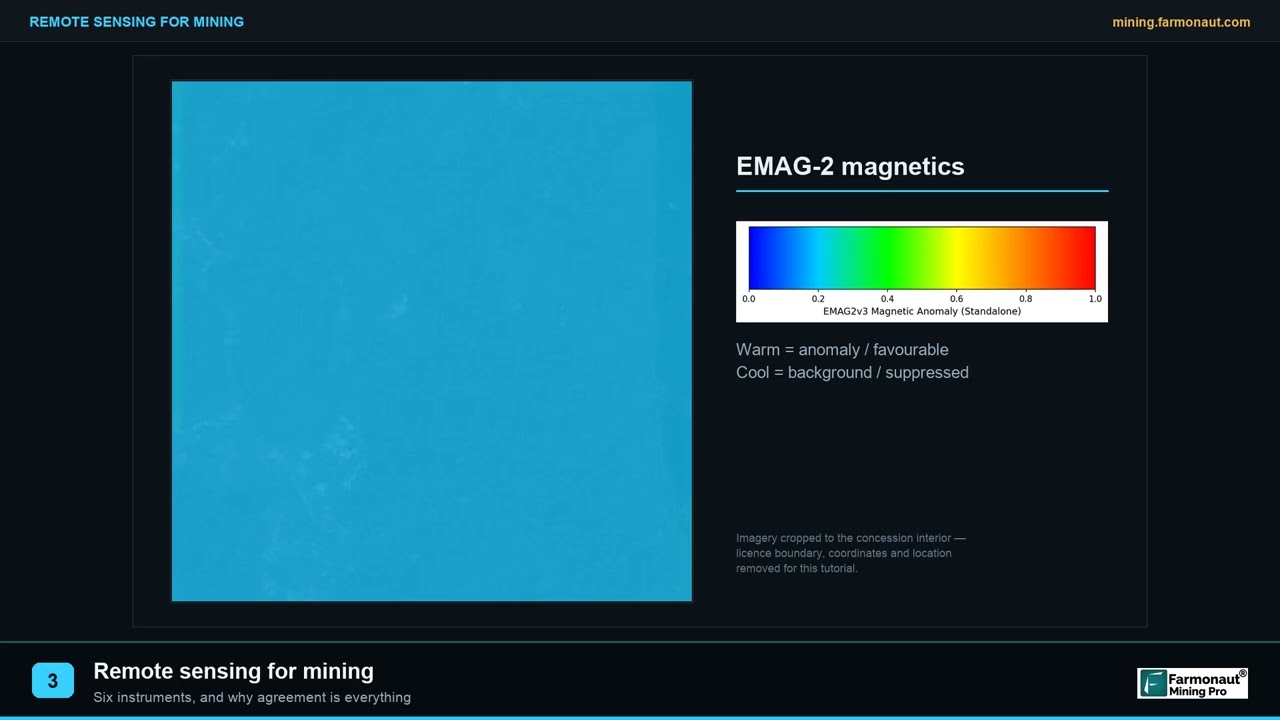
▶ Remote sensing for mining explained in about two minutes. · 2:01
What the rules ask you to measure
Rules differ by country, so the permit is the authority. Canada gives a clear published example. Under the Metal and Diamond Mining Effluent Regulations, environmental effects monitoring consists of effluent and water quality monitoring studies plus biological monitoring studies. In general, sublethal toxicity tests run in two calendar quarters per year for three years and then once per quarter, and interpretative reports are due 36 months after the previous one. A mine that has stopped discharging effluent for at least 36 months is not required to run the studies while that lasts (SOR/2002-222, current consolidation).
That structure shows what automation can and cannot do. Sensors and AI can collect and check the effluent and water quality records, flag gaps and draft the data tables. They cannot run the fish population or tissue studies, and they do not replace the signed reporting. For compliance reporting, the practical value is a clean audit trail: every reading with a timestamp, a calibration record and a note when a value was corrected.
How to set up a monitoring programme in 6 steps
Start with risk, not with technology. The order below keeps the spend tied to the hazards that a regulator or a lender will ask about.
Infographic
A monitoring programme in 6 steps
- 1List hazardsName each hazard and what it could harm.
- 2Read the permitTable every parameter, place, frequency and limit.
- 3Pick measurementsMatch satellite, radar, sonde or lab to each hazard.
- 4Set alertsGive every threshold a named responder.
- 5Run a baselineCollect a full year before calling a pattern normal.
- 6ReviewCheck alerts and sensor drift each quarter.
- List the hazards and the receptors. For each hazard (dam, discharge, dust, slope) name what could be harmed: a river, a village, a road.
- Copy the permit conditions into a table. Note each parameter, location, frequency and limit.
- Choose the cheapest reliable measurement. Use a satellite map for land, radar for slow movement, sondes for water that changes by the hour, and lab samples for metals.
- Set alert thresholds with a named responder. An alert that no one owns is noise.
- Run a baseline. Collect at least a full year of data before the pattern is treated as normal, because rainfall and temperature change readings with the season.
- Review and recalibrate. Check a sample of alerts each quarter, retire sensors that drift and update thresholds.
Monitoring programme budget calculator
Enter your own station counts and the prices from your own quotes. The calculator adds lab sampling, sensors (spread over their service life and with an annual service cost) and a satellite monitoring service. It uses no built-in prices.
Calculator
What could a monitoring programme cost per year?
Enter your own station counts and quotes.
- Lab sampling per year: $18,000
- Sondes per year (cost over life plus service): $12,400
- Lab share of total: 35.7 %
Example values only, not benchmarks or quotes. Prices are inputs: example, use today’s price in US$ from your own suppliers. Sensors are spread evenly over their service life; installation, staff time, travel and permits are not included.
Limits of AI monitoring
Four limits recur in the published work. First, a model learns what is normal from past data, so a new type of event may not be flagged. Second, optical satellites cannot see through cloud, and radar needs stable surfaces: vegetation and wet ground can lose the signal. Third, results from one site, such as the Czech acid drainage test or the Dexing dam, may not transfer to another climate or rock type. Fourth, the Brumadinho analyses were run after the event with knowledge of the outcome, which is much easier than giving a warning in real time.
A satellite or sensor alert is a prompt to inspect, not a finding of fault. Decisions on safety, discharge or closure should rest on engineers’ judgement and the regulator’s requirements. Nothing on this page is an environmental, safety or legal clearance for any site.
Where satellite screening fits before monitoring starts
Environmental monitoring is easier to plan when the early exploration phase has already limited ground disturbance. Farmonaut analyses satellite data over a licence boundary supplied as a KML, KMZ or polygon to flag exploration targets, with reports delivered in 5 to 20 business days. The company states that this can lower early-exploration cost by up to 80-85% and shorten work from months to days, with no ground disturbance in the exploration phase (Farmonaut company information). The results are exploration targets, not a resource estimate, and they are not an environmental clearance. You can read how the process works on the satellite-based mineral detection page or request a quote through the mining quote form.
The video below shows what the Farmonaut Mining Pro platform produces from a licence boundary.
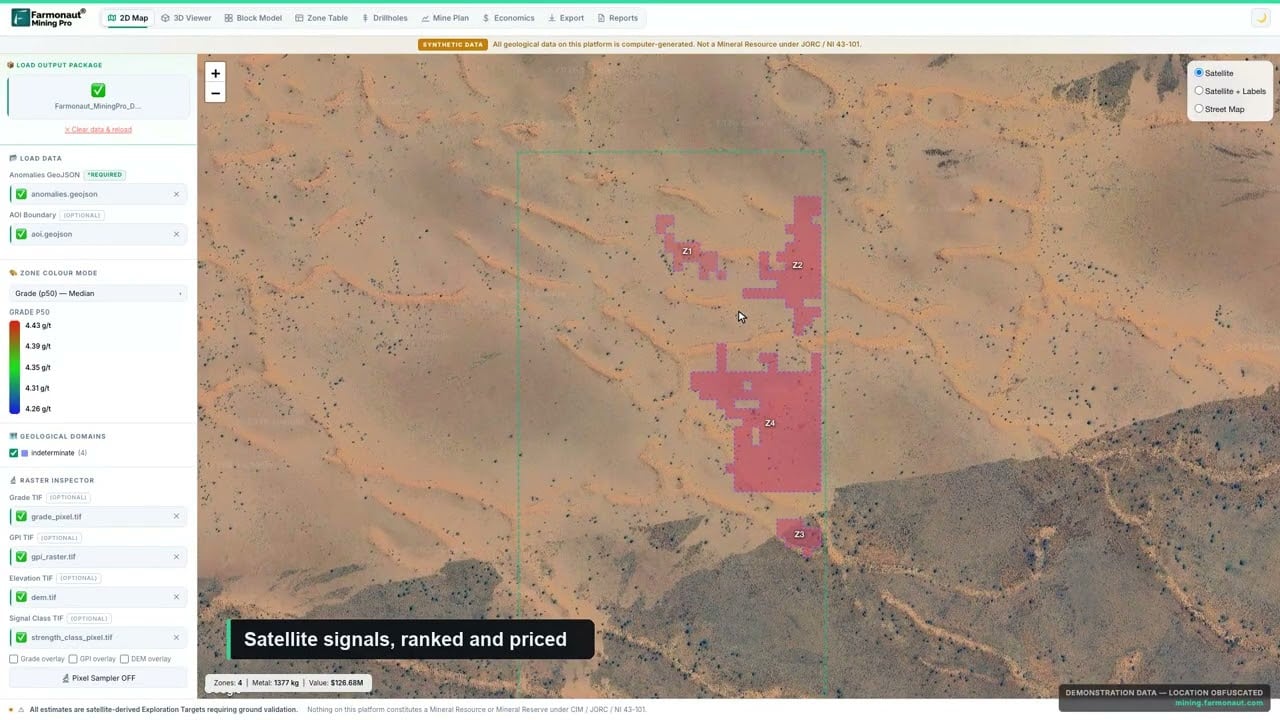
▶ What Farmonaut Mining Pro produces from a licence boundary. · 4:56
Frequently asked questions
What is AI used for in mine environmental monitoring?
It reads large streams of sensor and satellite data and flags readings that depart from the normal pattern. Published uses include tailings dam movement from radar, acid drainage hot spots from multispectral images and ground subsidence from radar time series.
Can satellites warn of a tailings dam failure?
Not reliably yet. A Brumadinho study found movement that did not fit normal settlement and said the failure interval might have been forecast 75 days ahead, but also said a reliable failure date could not be given. Treat satellite radar as one input to an engineer’s review.
How often do satellites revisit a mine?
Design revisit times are about 5 days for the Sentinel-2 pair at the Equator, six days for the Sentinel-1 pair and 8 days for Landsat 8 and 9 together. Cloud and orbit geometry make real intervals longer.
What does a continuous water quality sensor measure?
A typical sonde measures temperature, pH, turbidity and specific conductance. The USGS San Juan network sends those four readings every 15 minutes. Metals and other chemicals still need laboratory samples.
What is acid mine drainage and how is it detected?
It is acidic water formed when sulphide minerals oxidise in exposed rock. It is detected by measuring pH and metals in water, and, in research, by mapping iron-bearing minerals from drone and satellite images.
Which standard covers tailings monitoring?
The Global Industry Standard on Tailings Management, published by ICMM on 5 August 2020, has 77 auditable requirements, and its third topic area calls for a monitoring system that supports the observational method. National rules and permits also apply.
How much does a monitoring programme cost?
It depends on the number of stations, the lab prices and the sensor choices, so no single figure is useful. Use the calculator above with your own quotes: lab samples usually scale with stations and frequency, while sensors are a one-off cost plus service.
Does remote sensing replace field sampling?
No. Satellites cover wide areas and show change over time, but permits normally require samples and signed reports. Remote sensing helps decide where and when to sample.
Do satellite images show underground water or tailings seepage?
Not directly. They show surface effects such as wet ground, vegetation stress and surface movement. Seepage is confirmed with piezometers, wells and water samples.
Where should a small operator start?
Start with the permit conditions, a yearly satellite land-cover check and two water stations, one upstream and one downstream. Add sensors where the baseline shows the largest swings.
This page is for information only. It is not legal, engineering or environmental advice, and satellite or sensor results are not a clearance for any site. Confirm monitoring duties with your permit and regulator.
Farmonaut mining
Get a quote for your licence area
Mining business owners can request a quote for a satellite screening of a licence area as an exploration target, ahead of a resource estimate.

Mining Pro sample view, synthetic data
Keep reading
Sources
- W. A. Marr, Why mine waste impoundments experience stability failures, presentation to US National Academies committee (5 September 2019): nationalacademies.org
- Grebby et al., Ground deformation precursors to the Brumadinho tailings dam collapse, Communications Earth & Environment (2021): nature.com
- Das, Priyadarshana and Grebby, Spectral analysis of InSAR time series for tailings dam risk, arXiv preprint (2023): arxiv.org
- SBAS-InSAR deformation monitoring of the Dexing Copper Mine No. 4 tailings dam, Remote Sensing (2023): ncbi.nlm.nih.gov
- ICMM, Global Industry Standard on Tailings Management (5 August 2020): icmm.com
- Justice Laws Website, Metal and Diamond Mining Effluent Regulations, SOR/2002-222: laws-lois.justice.gc.ca
- ESA Earth Online, PAZ reveals how lithium extraction causes sinking land (13 January 2026): earth.esa.int
- Kopackova-Strnadova et al., Efficient Earth Observation System for Acid Mine Drainage, IMWA 2025: imwa.info
- US EPA, San Juan Watershed continuous water quality monitoring sondes, EPA 841-F-21-004 (April 2021): epa.gov
- Maus et al., An update on global mining land use, Scientific Data (2022): nature.com
- ESA SentiWiki, Sentinel-2 mission overview: sentiwiki.copernicus.eu
- ESA, Introducing Sentinel-1: esa.int
- NASA, Landsat 9 mission page: landsat.gsfc.nasa.gov
Discussion
Questions, corrections or field experience? Share them below. First-time comments are reviewed before they appear, and your email is never published.
No comments yet. Be the first to add a question or your experience.

 Swati Minerals
 Faith At Work (Pty) Ltd
 Geotech Mining Solutions plc
 Vulcan International Limited
 Kidepo Associates
 GKY Mining
 Alkimy SARL
 Double A Trading
 GemSprout Metals Limited
 Qader Group
 Ileys General Trading
 SG Gold Mining LLC
 VRV Global Pte Ltd
 Omsri International FZE
 G.I.T.T.
 Jaunita Erss Ltd
 Almosi SARL
 SRK Consulting
 Berks Gold Limited
 Mwerezi Minerals Company Limited
 Mining SARL
 SenGold Invest SAS

 Exploration consultancy · South Africa · Gold










