

Copper and DAP prices · Forecast check
World Bank Copper Price Forecast vs Actual Prices
The World Bank’s April 2026 outlook has copper at US$12,000 a tonne for 2026 and DAP at US$725. The monthly data already runs above the copper number. See the misses, the dates and a revenue calculator.
Key takeaways
- World Bank forecast (April 2026): copper US$12,000/t in 2026 and US$11,000/t in 2027; DAP US$725/t and US$650/t.
- LME copper averaged US$14,474/t in September 2026, the highest month in the Pink Sheet series since 1960; the January to September 2026 average is US$13,431/t.
- Past misses: forecasts for 2025 made in the April 2024 edition were 13% (copper) and 25% (DAP) off; same-year forecasts were within 4%.
- DAP averaged US$729/t from January to September 2026, close to the 725 forecast; Morocco holds about two thirds of world phosphate rock reserves (USGS, 2026).
- Freeport expects Grasberg at 80% of capacity in mid-2027, while the World Bank’s April report expects the phased restart to ease supply through 2026 and 2027.
In this article
- What the World Bank forecasts for copper and DAP
- How accurate are World Bank copper and DAP forecasts?
- Copper price month by month against the forecast
- Why the World Bank expects copper to ease
- Where the copper comes from: mine supply and ore grades
- DAP price outlook and the phosphate rock behind it
- How to read a World Bank commodity forecast
- Calculate mine revenue at the forecast copper price
- What licence owners and investors should check
- Frequently asked questions
The World Bank’s April 2026 Commodity Markets Outlook puts copper at US$12,000 a tonne for the 2026 average and US$11,000 for 2027, and DAP fertilizer at US$725 and US$650 a tonne (World Bank forecast table, April 2026). Market prices have run ahead of the copper number. The Bank’s monthly price file shows an LME copper average of US$14,474 a tonne in September 2026, the highest monthly figure in a series that starts in 1960 (Pink Sheet monthly data, updated 2 October 2026). This page puts the forecast next to what happened, shows how often earlier forecasts missed, and lets you test a mine’s revenue at the forecast price.
What the World Bank forecasts for copper and DAP
The Commodity Markets Outlook (CMO) is the Bank’s twice-yearly price forecast. It is published in April and October, and its forecast table gives annual average prices in nominal US dollars, meaning prices are not adjusted for inflation. The “f” after a year means forecast. The table below copies the rows that matter to mining and fertilizer buyers from the April 2026 edition, and the last column shows how far the Bank moved its 2026 number since the October 2025 edition.
Chart
2026 copper average: two forecasts and the nine-month actual
US$ per tonne, LME grade A settlement price
| Commodity (unit) | 2024 | 2025 | 2026f | 2027f | % change, 2026f vs 2025 | 2026f minus Oct 2025 forecast (price units) |
|---|---|---|---|---|---|---|
| Copper (US$/t) | 9,142 | 9,947 | 12,000 | 11,000 | +20.6% | +2,200 |
| Aluminum (US$/t) | 2,419 | 2,632 | 3,200 | 3,000 | +21.6% | +600 |
| Nickel (US$/t) | 16,814 | 15,162 | 17,000 | 17,500 | +12.1% | +1,500 |
| Zinc (US$/t) | 2,776 | 2,868 | 3,000 | 2,750 | +4.6% | +250 |
| Tin (US$/t) | 30,066 | 34,059 | 41,000 | 37,000 | +20.4% | +7,000 |
| Iron ore (US$/dry t) | 109.4 | 100.2 | 97.0 | 95.0 | -3.2% | +3 |
| Gold (US$/troy oz) | 2,388 | 3,442 | 4,700 | 4,300 | +36.6% | +1,125 |
| Silver (US$/troy oz) | 28.3 | 39.8 | 70.0 | 65.0 | +75.9% | +29.0 |
| DAP (US$/t) | 564 | 685 | 725 | 650 | +5.8% | +75 |
| Phosphate rock (US$/t) | 153 | 153 | 160 | 170 | +4.9% | 0 |
| Urea, Eastern Europe (US$/t) | 338 | 423 | 675 | 500 | +59.7% | +265 |
Source: World Bank, Commodity Markets Outlook, April 2026, Table 1. The same table says base metals as a group rise 19.2% in 2026, the fertilizer index rises 30.7%, and precious metals rise 42.4%. In per-pound terms, the copper forecasts are about US$5.44 for 2026 and US$4.99 for 2027, using 2,204.62 pounds to the tonne.
The Bank gives the reason in the report text: strong demand from data centers, electric vehicles and renewable power, set against tight supply, is expected to outweigh weak demand from construction. It expects copper, aluminum and tin to reach record annual highs in 2026 and to fall back in 2027 while staying near record levels (Commodity Markets Outlook, April 2026). The press release adds that overall commodity prices were forecast to rise 16% in 2026, with energy up 24% (World Bank press release, 28 April 2026).
How accurate are World Bank copper and DAP forecasts?
A forecast is only worth using if you know how far it can be wrong. The easiest test is to compare two older forecast tables with the annual averages that were later recorded. For copper, the Bank’s own annual figures show 9,142 for 2024 and 9,947 for 2025. In April 2024 it forecast 8,900 for 2024 and 8,800 for 2025 (CMO April 2024 forecasts). In October 2025 it forecast 9,700 for 2025 (CMO October 2025 forecasts).
Chart
Forecast against the annual average that followed
US$ per tonne; two copper and DAP forecast editions
- Copper 2024: forecast 8,900 in April 2024, actual 9,142. The actual was 2.7% higher.
- Copper 2025, previous-year edition (April 2024): forecast 8,800 in April 2024, actual 9,947. The actual was 13% higher.
- Copper 2025, same year: forecast 9,700 in October 2025, actual 9,947. The actual was 2.5% higher.
- DAP 2024: forecast 600 in April 2024, actual 564. The actual was 6% lower.
- DAP 2025, previous-year edition (April 2024): forecast 550 in April 2024, actual 685. The actual was 24.5% higher.
- DAP 2025, same year: forecast 710 in October 2025, actual 685. The actual was 3.5% lower.
The pattern is plain. A forecast made late in the year it covers is close, and a forecast made in the previous year’s edition can be 13% to 25% off. In all three copper checks the actual price came in above the forecast, and the 2026 forecast followed the same direction: the October 2025 edition had 9,800 for 2026, and six months later the Bank raised it by US$2,200 to 12,000.
These checks use two forecast editions and two commodities. They show typical error sizes for those cases, not a promise about every metal or every year.
Copper price month by month against the forecast
Annual forecasts hide the path. The monthly LME settlement series, which the Bank publishes in its Pink Sheet file, climbed from US$9,984 in September 2025 to US$13,012 in January 2026 and has stayed above US$12,500 in every month since. September 2026 was the high at US$14,474. The average for January to September 2026 is US$13,431 a tonne, 11.9% above the 12,000 forecast for the full year.
Chart
Monthly LME copper against the 2026 forecast
US$ per tonne, monthly average
That gap is large enough to do arithmetic on. For the full-year 2026 average to land at 12,000, the last three months would have to average about US$7,700 a tonne, which would be a collapse of roughly 47% from September. If October to December simply repeat September’s 14,474, the 2026 average comes out near US$13,700. A reader using the April number as a 2026 price deck is therefore working with a figure the data has already passed.
For a reference point on the day this page was updated, a commodity data service quoted copper at US$6.52 a pound on 15 October 2026, which converts to about US$14,370 a tonne (Trading Economics). That quote tracks a contract for difference (CFD), so treat it as a market reference, not an LME settlement. Check the LME or your broker before you use any price in a contract.
The next chart sets the monthly settlement price against the Bank’s April forecast for the 2026 annual average. The forecast is a single yearly number, so it is drawn as a flat line.
Why the World Bank expects copper to ease
The Bank does not forecast a collapse. It forecasts a drop of about 8% in 2027 to US$11,000, which would still be above any annual average before 2026. Its report names the reasons for the easing: production disruptions that unwind, and a tight market that loosens.
Supply: Grasberg and ore grades
The Bank’s report says copper mine output is expected to rise only modestly in the near term, limited by declining ore grades and disruptions at several large mines in Asia and South America. It expects the phased restart of the Grasberg mine in Indonesia to ease the squeeze through the rest of 2026 and 2027. Freeport-McMoRan’s operations update of 2 October 2026 gives the status: the mill ran at about 140,000 tonnes of ore a day in the third quarter, about 67% of pre-incident rates, with about 70,000 tonnes a day from the Grasberg Block Cave. The company still expects 80% of capacity in mid-2027 and near-full capacity by the end of 2027, and reported about 830 million pounds of copper production in the quarter (Freeport-McMoRan Form 8-K, 2 October 2026).
Inputs: sulfur and acid
Copper heap and dump leaching uses sulfuric acid. The Bank points to disruptions to Middle East sulfur exports and to China’s planned ban on sulfuric acid exports from May as cost and output risks for copper and nickel producers.
Demand: data centers, grids and China
The Bank lists investment in power capacity, transmission upgrades and AI data centers as the main demand drivers, and says China accounts for about half of global base metal consumption. A sharper slowdown there is its main downside risk. A faster build-out of data centers is the main upside risk.
Tariffs
US trade policy adds a separate risk. A July 2025 presidential proclamation put a 50% tariff on semi-finished copper products and copper-intensive derivatives. It also set a 30 June 2026 deadline for the Commerce Secretary to update the President on the copper market, so that the President could decide on a phased import duty on refined copper of 15% from 1 January 2027 and 30% from 1 January 2028 (Proclamation, 30 July 2025). The Bank’s April report treats a refined-copper tariff as an upside price risk because buyers might stockpile ahead of the duty. The rules have since changed: a proclamation dated 1 June 2026 further adjusted the aluminum, steel and copper tariff regimes, with most changes effective 8 June 2026 (Proclamation, 1 June 2026). The page we read does not mention a refined-copper duty, and we did not confirm a decision after the 30 June 2026 deadline. Rates may change again, so check the latest proclamation before you build a US cash-flow case on it.
Where the copper comes from: mine supply and ore grades
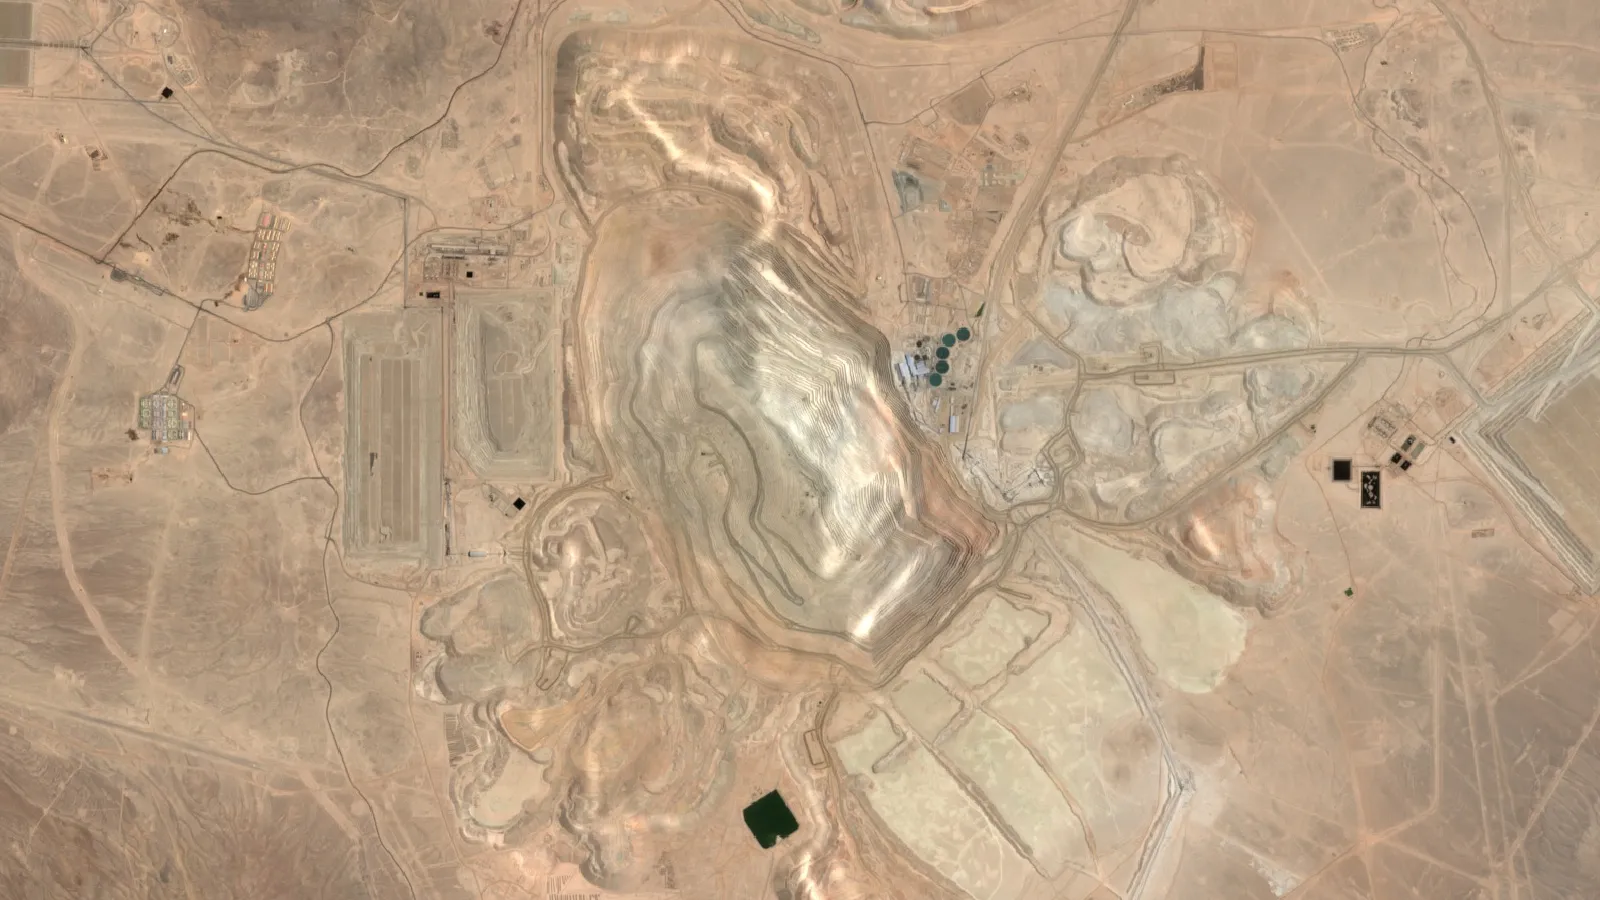
Price forecasts matter most to the places that supply the metal. The US Geological Survey estimates world copper mine production at 23 million tonnes in 2025, unchanged from 2024. Chile led with an estimated 5.3 million tonnes, followed by the Democratic Republic of the Congo at 3.2 million, Peru at 2.7 million, China at 1.8 million, Russia at 1.3 million and the United States at 1.0 million. USGS puts world copper reserves at 980 million tonnes and US net import reliance at 57% of apparent consumption in 2025 (USGS Mineral Commodity Summaries 2026, copper).
The Bank’s phrase “declining ore grades” has a practical meaning. Grade is the share of metal in the rock, shown for copper as percent copper (% Cu). A mine that digs lower-grade rock has to move more ore for each tonne of metal, which raises cost and slows output growth, however high the price. Our guides to copper deposit types and the top producing countries and to porphyry copper alteration, grades and discovery explain where this metal sits and how exploration teams look for it.
High copper prices also change what a company can afford to explore. For the budget side, see our data page on mineral exploration spending in Canada. The video below shows why electric vehicles pull so much copper out of a small number of mines.
▶ Copper mining explained: why electric vehicles start as a hole in Chile. · 6:03
DAP price outlook and the phosphate rock behind it
DAP (diammonium phosphate) is a fertilizer made from phosphate rock, ammonia and sulfuric acid. Phosphate rock and sulfur come from mining and refining, and ammonia comes from natural gas, so DAP prices follow mining and energy markets as much as farm demand. The Pink Sheet quotes DAP spot, f.o.b. US Gulf (the price at the loading point).
Chart
DAP annual average price
US$ per tonne, spot f.o.b. US Gulf; 2026 is the January to September average
The Bank forecasts a DAP average of US$725 a tonne for 2026, up 5.8%, then US$650 in 2027, down 10.3%. Its report says DAP prices fell almost 9% in the first quarter of 2026 on average compared with the fourth quarter, and says China’s easing of phosphate export restrictions limited price swings. The monthly series then rose: US$619 in January, US$725 in April and US$801 in September. The January to September average is US$729, almost exactly the 725 forecast, so for DAP the April number is holding up better than it is for copper, although September’s level points to a higher second half.
The Bank ties the risk to the Strait of Hormuz. Nearly 15% of global DAP exports pass through it, as do about one-third of global sulfur trade and around 15% of ammonia trade, and the Moroccan producer OCP has brought forward maintenance that is expected to cut second-quarter output (Commodity Markets Outlook, April 2026). Its forecast assumes that Middle East supply disruptions ease around mid-year.
On the rock itself, USGS estimates world phosphate rock mine production at 250 million tonnes in 2025. China produced about 110 million, Morocco 36 million, the United States 20 million, Russia 14 million and Jordan 12 million. Morocco holds 50 billion of the 73 billion tonnes of world reserves, about two thirds. USGS also notes that about 25% of US wet-process phosphoric acid output was exported as DAP, MAP and other products, and that US phosphate rock is mined in four states (USGS Mineral Commodity Summaries 2026, phosphate rock).
The chart below shows how DAP moved over six full years and the first nine months of 2026. The Bank’s report says the fertilizer price spikes of 2021 and 2022 were driven by export disruptions in Russia and Belarus and high input costs. DAP in 2026 has not matched its 2022 level.
How to read a World Bank commodity forecast
- Find the edition date. The April and October editions are separate documents, and the October one replaces the April one. Always write the edition next to the number you use.
- Check the unit and the price basis. Copper is the LME grade A settlement price, in US$ per tonne. DAP is spot f.o.b. US Gulf. Your own contract may sit at a different point in the chain.
- Remember it is an annual average. The 12,000 for 2026 is the mean of twelve months. It is not a price target for any one day.
- Read the revision columns. The last two columns of the table show how much the number moved since the previous edition. A rise of US$2,200 for one year in six months tells you how fast the market changed.
- Look at the assumptions. The Bank’s energy and fertilizer numbers assume Middle East disruption eases by mid-year. If your view differs, treat the forecast as a scenario, not a base case.
- Compare with the monthly file. The Pink Sheet updates early each month. Use it to see whether the year is running above or below the forecast.
- Run the price through your own numbers. The calculator below shows the revenue at several prices for a project you describe.
Calculate mine revenue at the forecast copper price
Use the calculator that follows to turn a price into a revenue figure for a copper project. It shows gross revenue only, before treatment and refining charges, transport, royalties, operating costs and tax, so it is a screening number and not a project valuation.
Calculator
What is a year of copper sales worth at your price?
Enter your own ore tonnes, grade, recovery and price.
- Payable copper per year (tonnes): 4,896
- Revenue at the 2027 forecast of US$11,000/t: $53,856,000
- Revenue change for each US$1,000/t move: $4,896,000
Example values only, not a benchmark or a forecast. Price is an input: use today’s price. The 2027 line uses the World Bank April 2026 forecast of US$11,000/t, fixed in the formula. Gross revenue only, before treatment and refining charges, royalties, costs and tax.
What licence owners and investors should check
If you hold a licence or follow copper projects, a forecast like this is one input among several. These checks keep it in proportion.
- Use a range, not a single deck. Test your project at the 2027 forecast of US$11,000, at the 2026 forecast of US$12,000 and at a lower price. A project that works only at the highest of these is a price bet.
- Match the price to the product. A mine that sells concentrate is paid on payable metal less treatment and refining charges, not on the LME price directly.
- Check the grade, not just the price. A higher price lowers the cut-off grade, which is the lowest grade that pays for mining and processing, but it does not create grade. The rock still has to be there.
- Treat resource and reserve language with care. Satellite and remote sensing results are exploration targets and sit ahead of any resource estimate.
For the exploration side, Farmonaut screens a licence area from space using satellite data, so a team can rank ground before it commits to field work. The process is described on our satellite mineral detection page, and you can request a quote for your area or contact us with questions. The video below is a short tour of the platform.
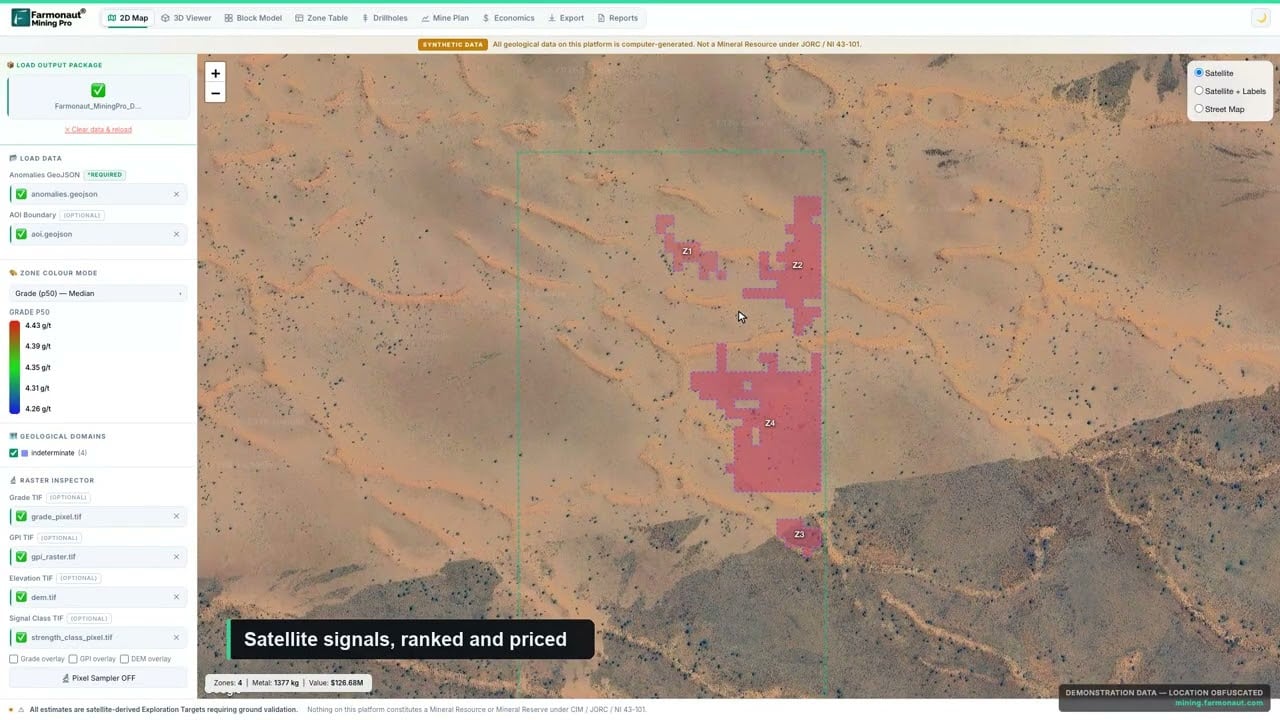
▶ A short tour of Farmonaut Mining Pro, which turns a licence boundary into a geological and economic picture. · 4:56
Frequently asked questions
What is the World Bank copper price forecast?
The April 2026 Commodity Markets Outlook forecasts an average of US$12,000 a tonne for 2026 and US$11,000 for 2027, up from US$9,947 in 2025. That is a rise of 20.6% followed by a fall of 8.3%.
What is the World Bank DAP price forecast?
The same edition forecasts DAP at US$725 a tonne for 2026 and US$650 for 2027, against US$685 in 2025. The 2026 figure is 5.8% above 2025 and the 2027 figure is 10.3% below 2026.
When does the World Bank publish its commodity forecasts?
The Commodity Markets Outlook comes out twice a year, in April and October. The monthly Pink Sheet price file is updated near the start of each month; the version used here was updated on 2 October 2026.
Are the forecasts in real or nominal dollars?
Nominal US dollars, so they are not adjusted for inflation. The monthly series is also available only in nominal dollars, according to the Pink Sheet file.
Where can I download the World Bank price data?
From the World Bank commodity markets page, which hosts the monthly and annual Pink Sheet files, the forecast table for each Outlook edition and the full report.
Why is the copper price above the World Bank forecast?
The forecast was set in April 2026. Since then the monthly price rose from about US$12,950 in April to US$14,474 in September. The Bank’s own report lists tight mine supply, strong demand from power and data center investment and trade policy as upside risks, and those factors have been in play.
How much is the copper forecast per pound?
US$12,000 a tonne is about US$5.44 a pound and US$11,000 a tonne is about US$4.99 a pound, using 2,204.62 pounds to the tonne. Futures on COMEX are quoted in US dollars per pound.
Does the World Bank forecast gold and silver?
Yes. The April 2026 table has gold at US$4,700 a troy ounce for 2026 and US$4,300 for 2027, and silver at US$70 and US$65. It expects the precious metals index to rise 42.4% in 2026.
Will the US tax refined copper imports?
A July 2025 proclamation left that decision open, asking for a Commerce update by 30 June 2026 before the President decides on a phased duty of 15% from 2027 and 30% from 2028. A proclamation dated 1 June 2026 later adjusted the wider copper, steel and aluminum tariff regimes but, on the page we read, does not mention refined copper. We did not confirm a refined-copper decision, and rates may have changed since, so check the latest proclamation. This is information only, not legal or trade advice.
Is a World Bank forecast a reason to buy a mining stock?
No. A commodity forecast says nothing about one company’s grade, costs, debt or management. This page gives data and sources only and is not investment advice.
This page is for information only. It is not investment, legal or trade advice. Forecasts are revised and prices change daily, so check current figures with the source before you use them.
Farmonaut mining
Screen your project area from space
Rank ground by satellite before you commit to field work, and test the result against the price range above.

Mining Pro sample view, synthetic data
Keep reading
Sources
- World Bank, Commodity Markets Outlook, April 2026 forecast table: thedocs.worldbank.org
- World Bank, Commodity Markets Outlook, October 2025 forecast table: thedocs.worldbank.org
- World Bank, Commodity Markets Outlook, April 2024 forecast table: thedocs.worldbank.org
- World Bank, Pink Sheet monthly price data (updated 2 October 2026): thedocs.worldbank.org
- World Bank, Commodity Markets (Outlook reports and price data): worldbank.org
- World Bank, Commodity Markets Outlook, April 2026 (full report): openknowledge.worldbank.org
- World Bank press release, Commodity Markets Outlook, 28 April 2026: worldbank.org
- USGS, Mineral Commodity Summaries 2026: copper: pubs.usgs.gov
- USGS, Mineral Commodity Summaries 2026: phosphate rock: pubs.usgs.gov
- Freeport-McMoRan, Form 8-K third quarter 2026 operating update (2 October 2026): sec.gov
- The White House, Adjusting Imports of Copper into the United States (30 July 2025): whitehouse.gov
- The White House, Further Adjusting the Tariff Regimes for Imports of Aluminum, Steel, and Copper (1 June 2026): whitehouse.gov
- Trading Economics, copper price (15 October 2026): tradingeconomics.com
Discussion
Questions, corrections or field experience? Share them below. First-time comments are reviewed before they appear, and your email is never published.
No comments yet. Be the first to add a question or your experience.

 Energy and Resources Ltd
 Mwerezi Minerals Company Limited
 Congo Mining Solutions
 Mining SARL
 SenGold Invest SAS
 Sania Corporation
 Sean Mining Limited
 NTS Group (Pty) Ltd
 Mine4Africa
 Lithspo Minerals Limited
 Tintina Mining Group
 Dalgety Minerals Pty Ltd
 Vortex Minerals Pty Ltd
 Faith At Work (Pty) Ltd
 Geotech Mining Solutions plc
 Vulcan International Limited
 Kidepo Associates
 GKY Mining
 Alkimy SARL

 Licence holder · Nigeria · Gold + lithium










