

Satellite Blueberry Crop Advisory: 124-Acre Proof

John Vansickle, a Citrus County blueberry grower running 25 separate blocks, reported that our satellite and AI-based farm advisory optimised both his irrigation and his fertiliser use by 30–50%. We went back into the advisory he was reading and reverse-engineered exactly which numbers produced that result.
Most precision-agriculture case studies work backwards from a happy quote. This one works backwards from the data. In June 2026, a commercial blueberry grower in Citrus County, Florida, completed the feedback form attached to his satellite blueberry crop advisory and reported that the report had helped him optimise irrigation by 30–50%, optimise fertiliser application by 30–50%, and take action on pest, disease and weed pressure. Those are large claims. So we opened the same advisory he had been reading — all 25 blocks of it — and asked a harder question: which specific lines in this report could plausibly produce savings of that size?
The answer turned out to be unusually clean, and it is not the answer most people expect. The savings did not come from a clever irrigation formula telling him to apply less water on the days he irrigated. They came from the advisory telling him, on nearly half of all farm-days, not to irrigate at all — and from telling him, on eight of his twenty-five blocks, not to apply any fertiliser at all. The value was in the zeroes.
Across the 11 June 2026 advisory, 78 of 175 block-days carried an explicit zero-irrigation instruction — 44.6% of the scheduled week. A grower irrigating on a fixed calendar would have run the system on every one of those days. That single mechanism accounts for a water reduction of the exact magnitude the grower reported.
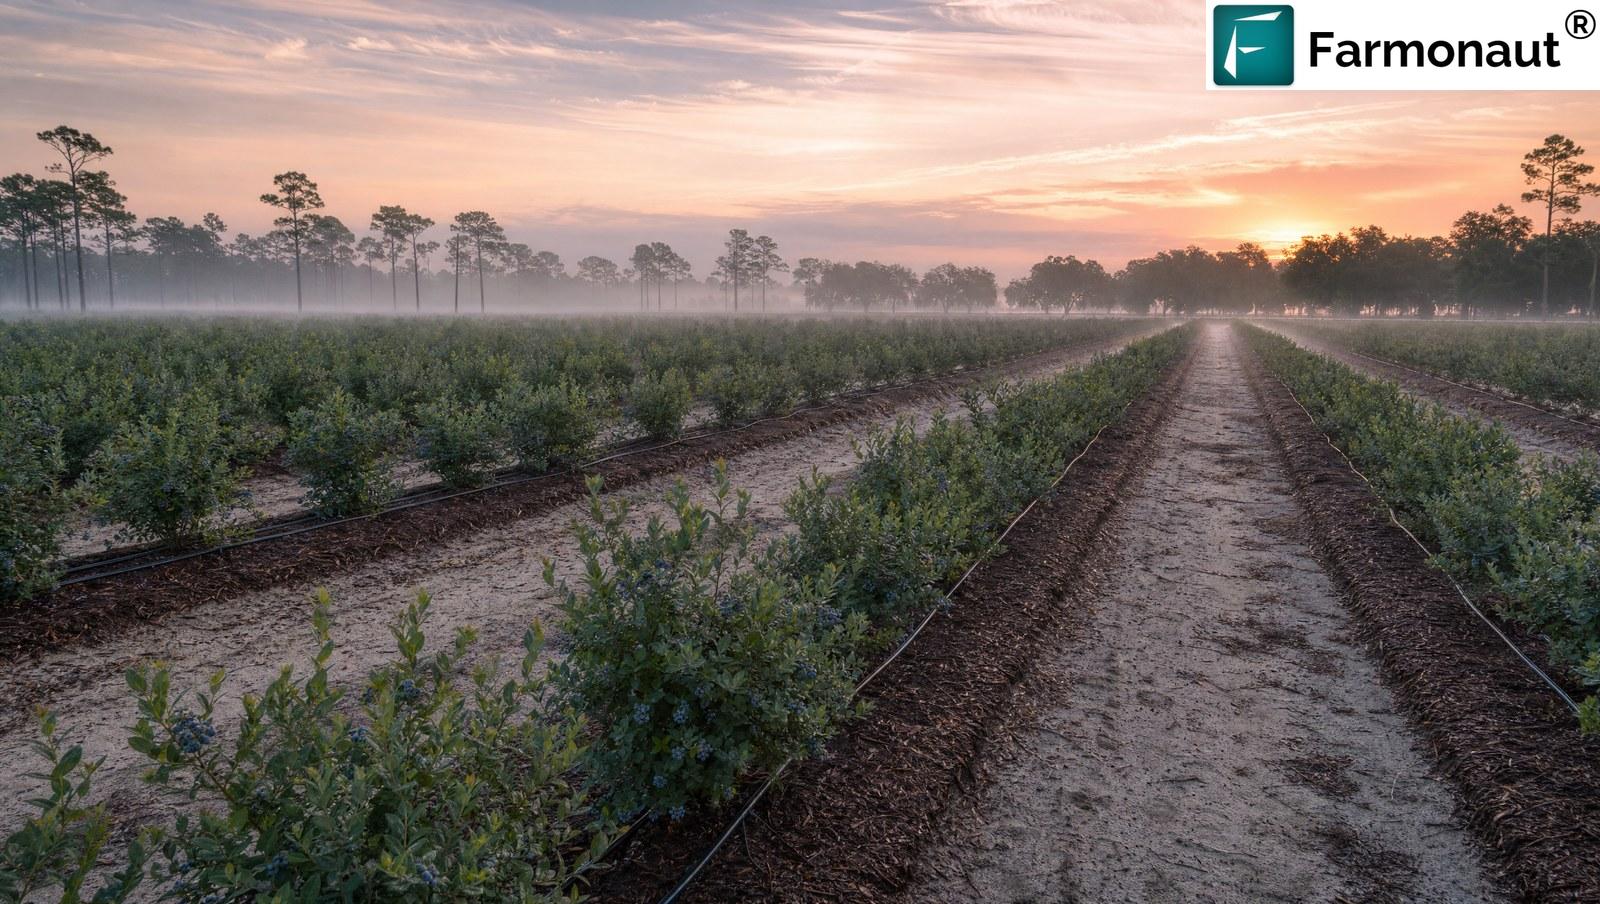
The operation: 25 blocks, four growth stages, one week
John Vansickle farms Southern Highbush blueberry (Vaccinium corymbosum) across 25 discrete blocks totalling 124.3 acres (50.3 hectares) in Citrus County, on Florida’s Nature Coast. Block sizes run from 1.77 acres to 11.29 acres. He onboarded onto our platform on 21 December 2025; his first advisory was generated the same day, drawing on a Sentinel pass captured three days earlier.
By the time he submitted the feedback that prompted this case study, the account had received 1,048 individual block advisories across 40 distinct satellite acquisition dates, at a median revisit interval of five days. This is the detail that makes the operation a useful test case: it is not a demo plot. It is a real commercial portfolio, monitored continuously for close to six months before the grower was asked whether any of it had been worth reading.

The complicating factor — and the reason a whole-farm average would have been useless to him — is that his 25 blocks were not in the same place in the season. On the week in question, the advisory placed them across four different phenological stages simultaneously.
Nearly half of all block-days in the week carried the same instruction: do not irrigate.
What the satellite blueberry crop advisory actually said
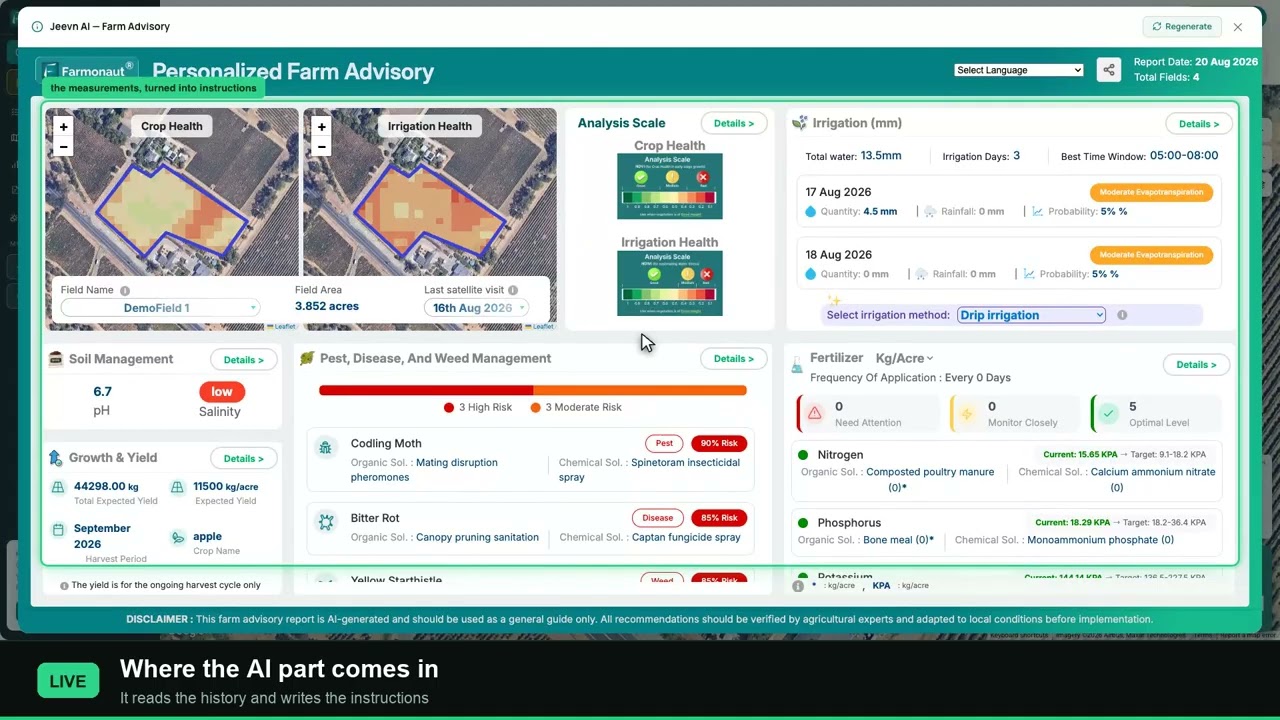
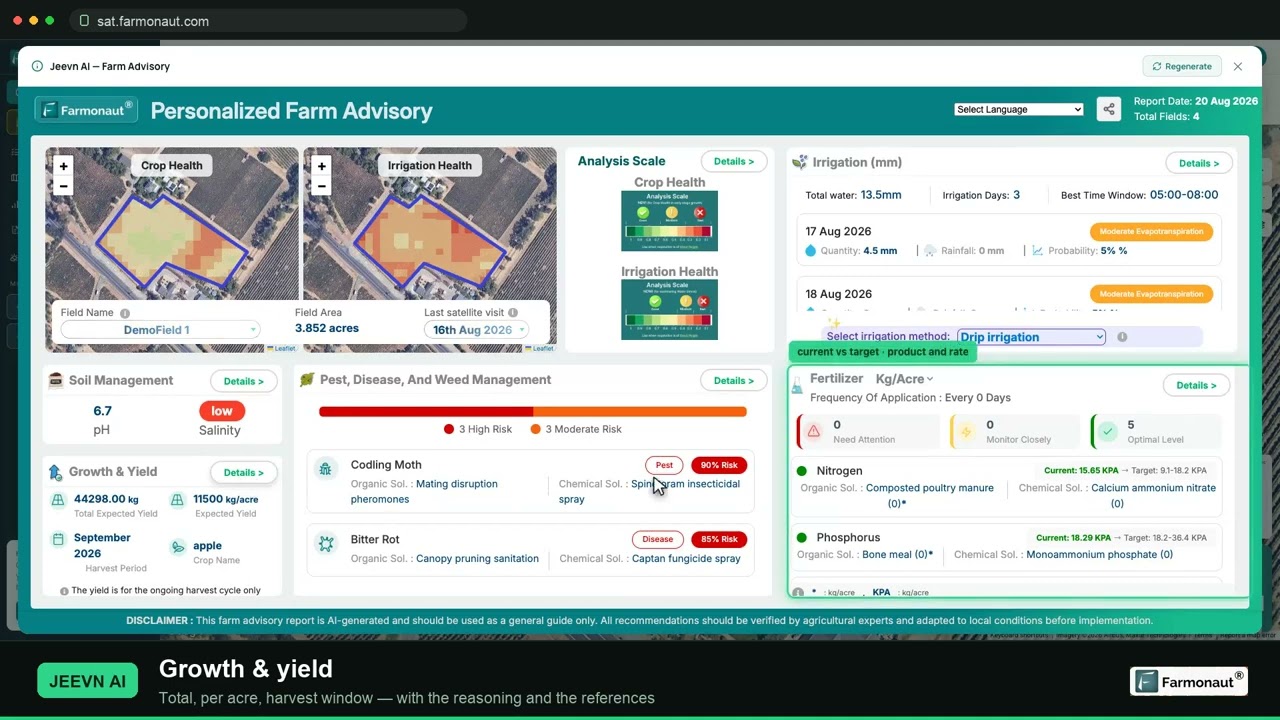
Our satellite blueberry crop advisory — delivered through JEEVN AI, our satellite and AI-based farm advisory product — issues a separate report per block per acquisition. Each report carries five working sections: irrigation, fertiliser, pest and disease, weed, and soil management, plus a growth and yield estimate. Below are the three sections the grower said had changed his decisions, shown as he saw them in the app.

Irrigation: the instruction was often “no water”
The irrigation section does not give a single weekly figure. It gives a day-by-day schedule for the seven days following the satellite pass, and for each day it publishes four things: the quantity in millimetres, the forecast rainfall, the probability of precipitation, and an evapotranspiration class. When forecast rain is sufficient, the recommended quantity drops to zero and the time window reads N/A.
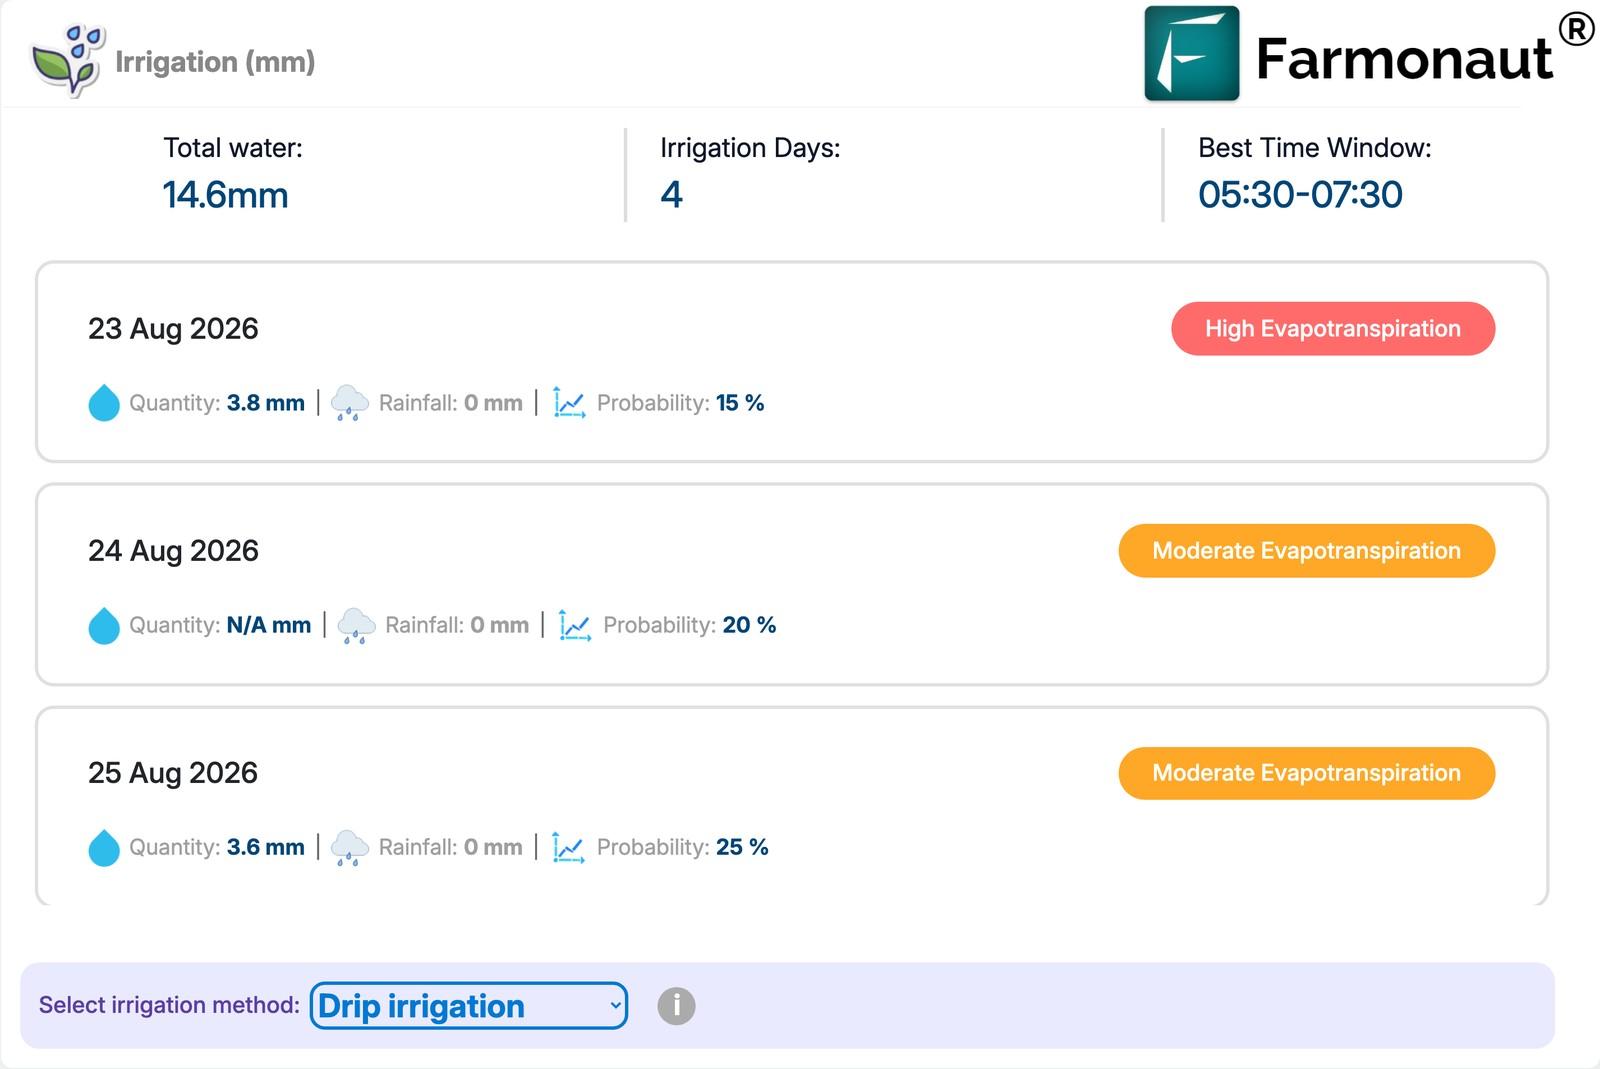
On one representative post-harvest block, the seven-day schedule for 12–18 June read: 3.5 mm, zero, 3.8 mm, zero, 4.0 mm, zero, 3.8 mm. The three zeroes were not omissions. They were issued against forecast rainfall of 2.0 mm, 1.5 mm and 0.5 mm at precipitation probabilities of 40%, 30% and 25% respectively. Total recommended irrigation for the week: 15.1 mm across four days, not seven.
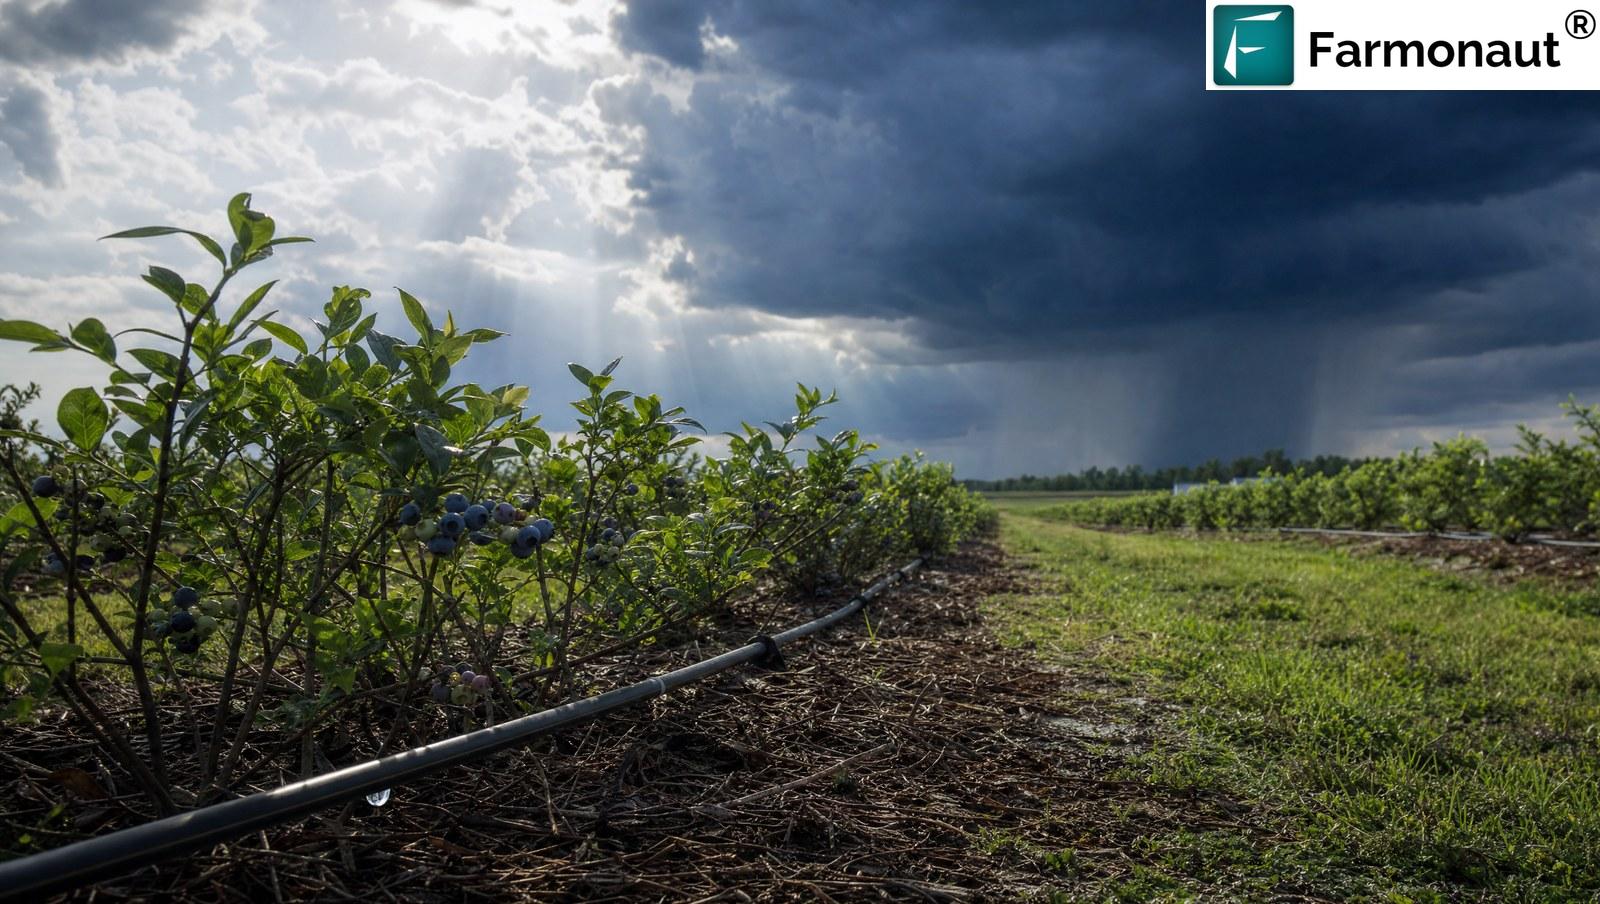
Two further details matter for the saving. First, the recommended window across the portfolio sat between 05:00 and 07:30 — pre-dawn, when evaporative loss is lowest. Second, where the advisory listed alternative delivery methods, drip was flagged as recommended at 3.8 mm while overhead sprinkler was listed at 4.5 mm and micro-sprinkler at 4.0 mm for the same day and the same crop demand. Choosing drip over overhead sprinkler is, on those numbers, roughly 16% less water for the same delivered requirement.
The number to watch on an irrigation card is not the millimetre figure — it is the irrigation-days count. A schedule that says “4 days” when your calendar says 7 is where the water saving lives. Set your controller from the schedule, not from the habit.
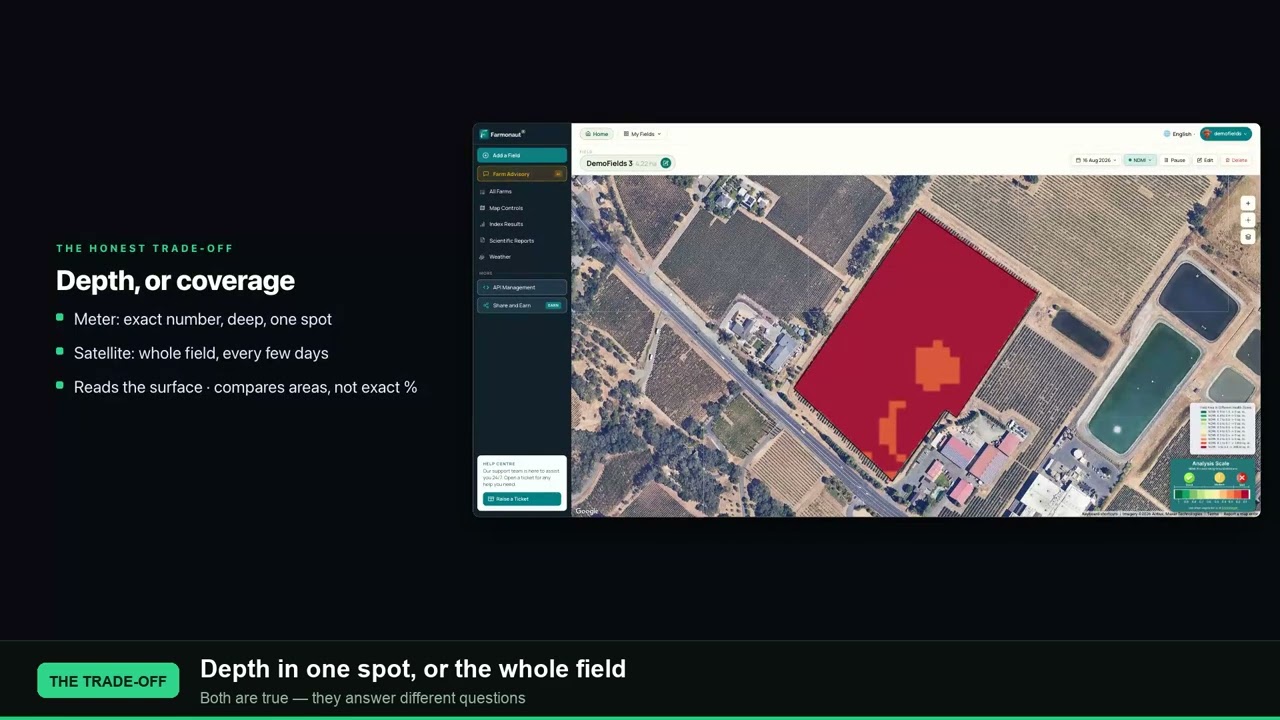
The obvious objection is that a satellite cannot know what a probe in the ground knows. It is a fair challenge, and the honest answer is that the two measure different things at different scales — a probe reads one point precisely, while the satellite reads the whole block approximately. For an irrigate-or-skip decision across 25 blocks, block-wide coverage is the more useful of the two.
Fertiliser: eight blocks were told to apply nothing
The fertiliser section reports five nutrients — nitrogen, phosphorus, potassium, sulphur and zinc — and for each one it publishes the current modelled soil composition, the ideal range for the crop, an application rate, and both an organic and a chemical source. Critically, when a nutrient already sits inside its ideal band, the application rate returns zero.
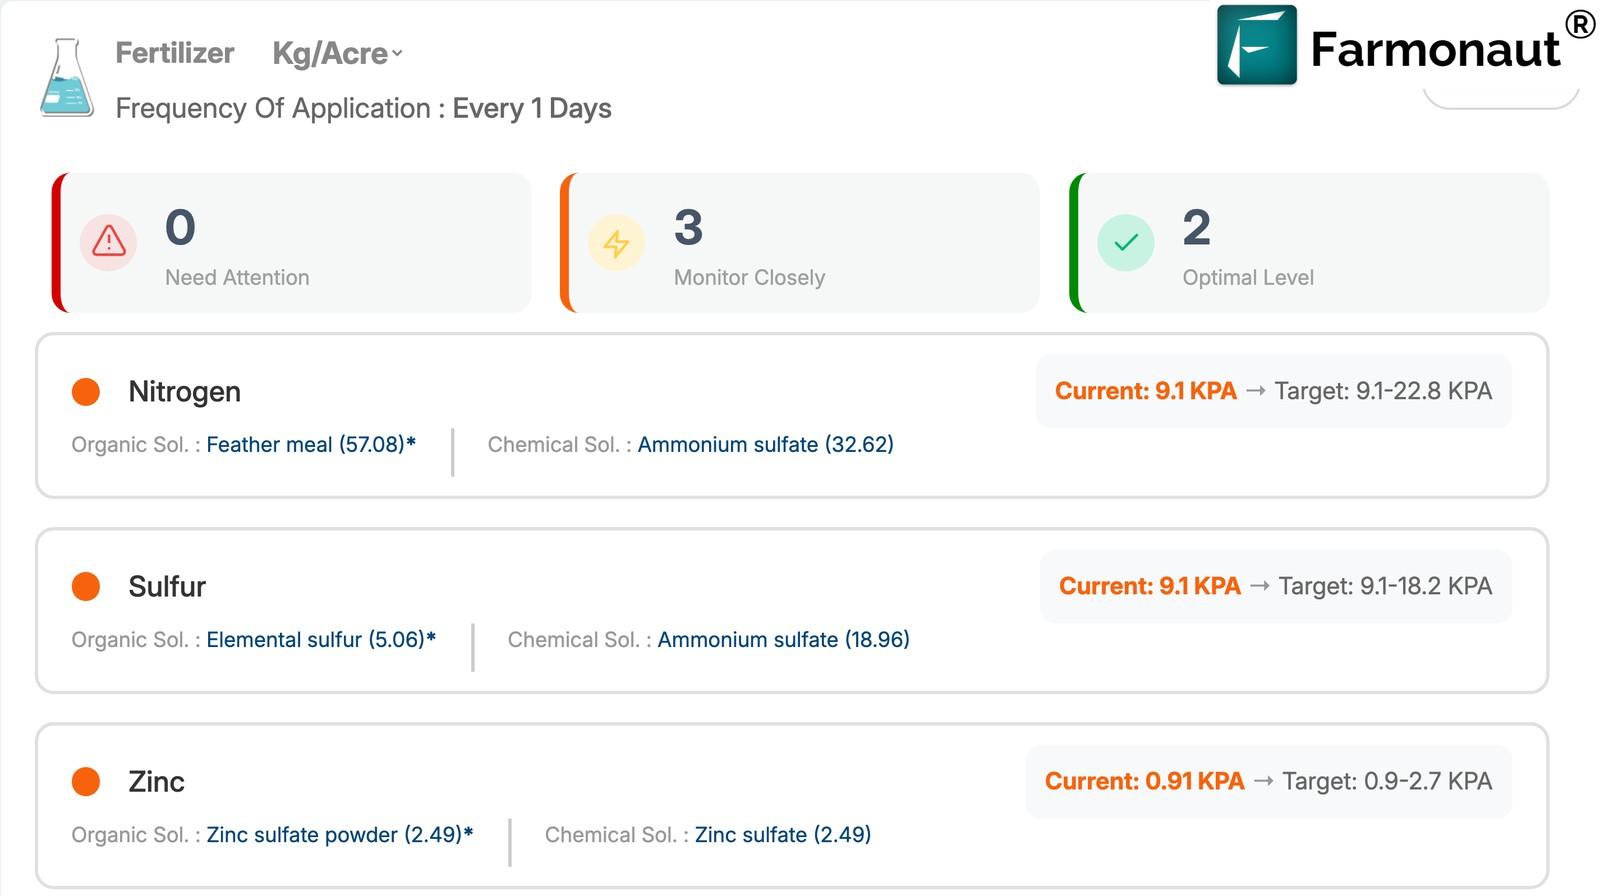
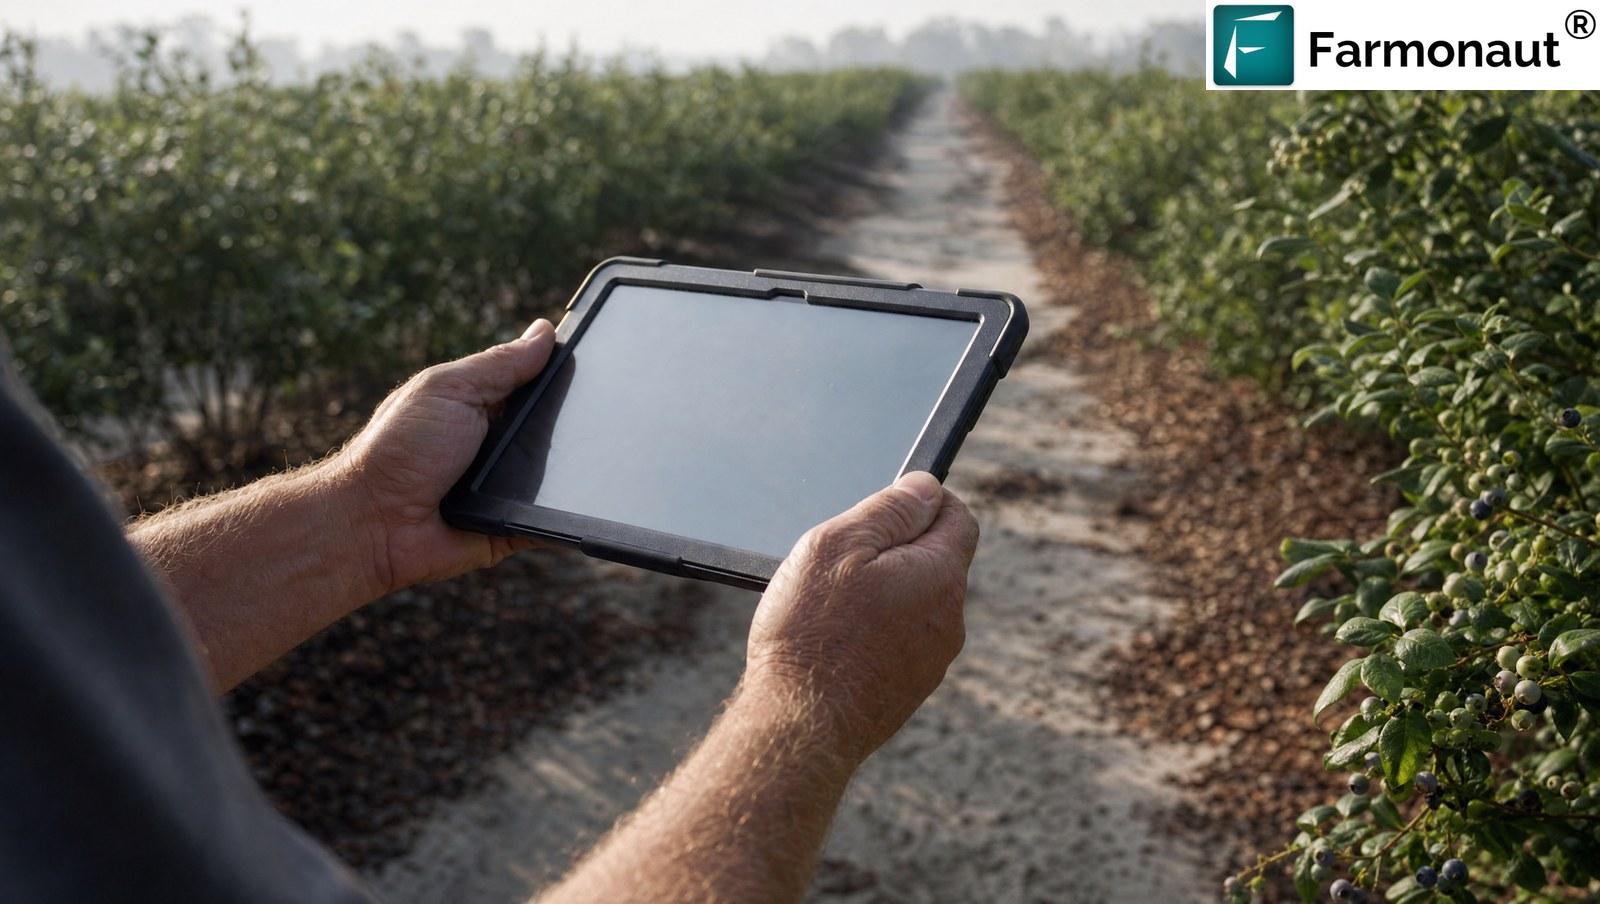
On the 11 June advisory, eight of the twenty-five blocks returned zero on all five nutrients at once — nitrogen, phosphorus, potassium, sulphur and zinc were all already inside their ideal ranges. For those eight blocks, covering roughly 30 acres, the correct action for the week was to spend nothing and apply nothing.
The remaining seventeen blocks did get rates, and the spread between them is the second half of the story. Prescribed nitrogen ranged from 6.5 to 46.9 kg/acre — a 7.2-fold difference across blocks of the same crop, on the same farm, in the same week.
Pest, disease and weed: stage-aware, not calendar-driven
The third section the grower credited is pest, disease and weed management. Across the 25 blocks, the 11 June advisory raised 36 separate high-confidence alerts — defined here as a modelled probability of 80% or above. Every alert carried both an organic and a chemical control option.
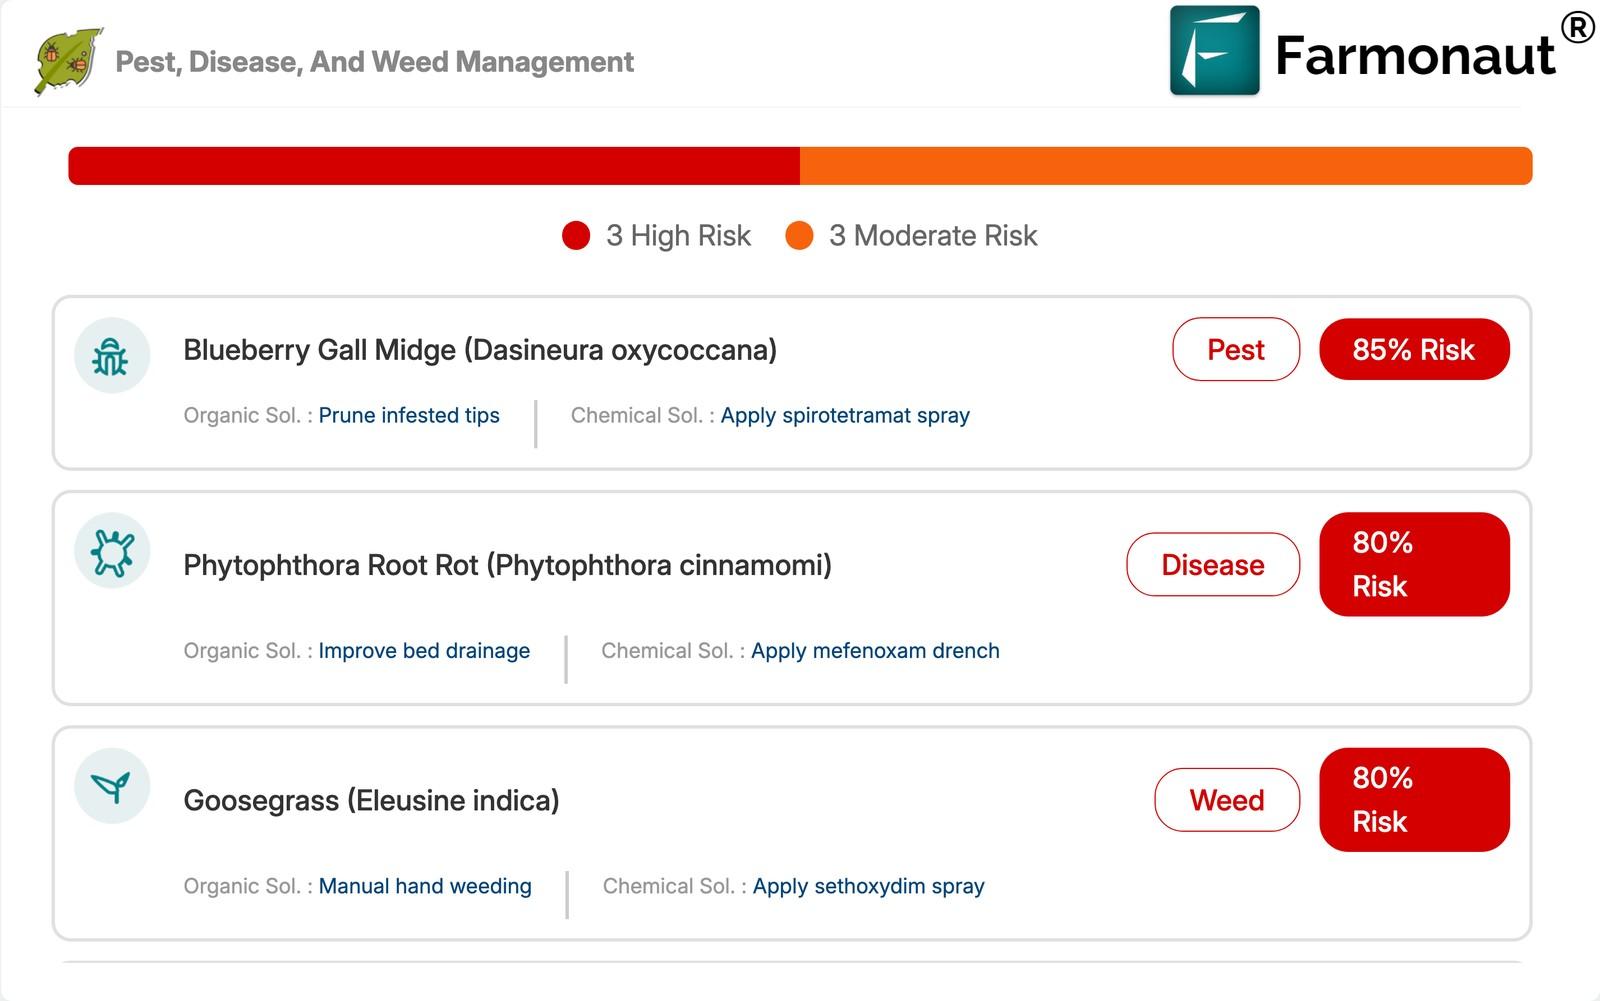
What makes this section credible rather than generic is that the alerts tracked growth stage. On the blocks at harvest, the dominant alert was Spotted Wing Drosophila (Drosophila suzukii) — a ripe-fruit pest — typically at 85%, peaking at 96% on one post-harvest block. On the three blocks still at bloom, the top alert was instead Flower Thrips (Frankliniella bispinosa) at 85% — a bloom-stage pest that would be meaningless on a harvested block. The advisory was not broadcasting one pest list across the farm.
On the weed side, Yellow Nutsedge (Cyperus esculentus) was flagged on 24 of 25 blocks and Crabgrass on 18, with probabilities reaching 92%. Bermudagrass and Goosegrass appeared on the remainder. Each weed alert, again, carried an organic option (heavy mulching, hand weeding) alongside a chemical one.
Treating a high probability as a confirmed infestation. These are modelled risk scores built from satellite indices, weather and regional pest pressure — they tell you where to scout first, not what you will definitely find. They tell you where to scout first, which is exactly how a 25-block portfolio should be walked.
Reverse-engineering the reported 30–50%
So: can the advisory above actually produce a 30–50% reduction in water and fertiliser? We tested both claims against the portfolio data rather than accepting them.
Where the water saving comes from
Across the 25 blocks, the week’s advisory covered 175 block-days. Of those, 97 carried a positive irrigation instruction and 78 carried zero. The saving therefore depends entirely on what the grower would otherwise have done on those 78 days.
We modelled two honest baselines. Against a grower irrigating every day at each block’s own average recommended rate, following the advisory delivers a 44.4% reduction in applied water. Against a grower irrigating every day at each block’s own peak rate, the reduction is 48.7%. Both land inside the 30–50% band the grower reported, from the upper half of it.
Advisory-following = 2,048 mm·acre
Baseline, daily @ mean = 3,680 mm·acre → saving 44.4%
Baseline, daily @ peak = 3,994 mm·acre → saving 48.7%
Grower-reported band = 30–50%
There is an independent sanity check available. University of Florida IFAS guidance holds that a mature blueberry planting may need more than one inch of water per week during fruit development and rapid shoot growth. The advisory’s portfolio mean for this week was 16.5 mm — about 0.65 inches. That is well under the peak-season benchmark, and it should be: twenty of the twenty-five blocks were at or past harvest, where the crop coefficient the advisory cites (Kc 0.7–0.8 for post-harvest Vaccinium corymbosum) is materially lower than at fruit development. The saving comes from stage-aware demand modelling, not from under-watering the crop.
On Florida’s sandy Nature Coast soils, water applied beyond the shallow blueberry root zone leaches — and takes dissolved nitrogen with it. Skipping irrigation ahead of forecast rain protects the nutrient investment as well as the water. The water saving and the fertiliser saving are the same mechanism seen twice.
Where the fertiliser saving comes from
The fertiliser claim resolves the same way. Summed across the portfolio, the advisory prescribed about 1,764 kg of nitrogen. A uniform blanket programme applying the portfolio’s mean rate to all 124.3 acres would have applied roughly 2,528 kg — 30.2% more. A blanket programme pitched at the highest block’s rate, which is how growers often protect against the worst case, would have applied about 5,829 kg — 69.7% more.
So the reported 30–50% fertiliser saving is bracketed by our two baselines: 30.2% at the conservative end, 69.7% at the wasteful end. The grower’s own estimate sits precisely in that range.

| Reported benefit | Grower’s answer | Mechanism in the advisory | Modelled effect |
|---|---|---|---|
| Irrigation optimised | Yes — 30–50% | 78 of 175 block-days issued a zero-irrigation instruction against forecast rain | 44.4–48.7% less applied water |
| Fertiliser optimised | Yes — 30–50% | 8 blocks required no nutrient at all; remaining 17 rated individually across a 7.2× range | 30.2–69.7% less nitrogen than a blanket programme |
| Pest / disease / weed action taken | Yes | 36 alerts at ≥80% probability, stage-matched, each with an organic and a chemical option | Scouting and spray effort directed to specific blocks |
| Delivery method | Not asked | Drip recommended at 3.8 mm where overhead sprinkler was listed at 4.5 mm | ~16% less water for equal delivery |
| Timing | Not asked | 05:00–07:30 pre-dawn windows throughout the portfolio | Lower evaporative loss per mm applied |
See the same advisory on your own blocks
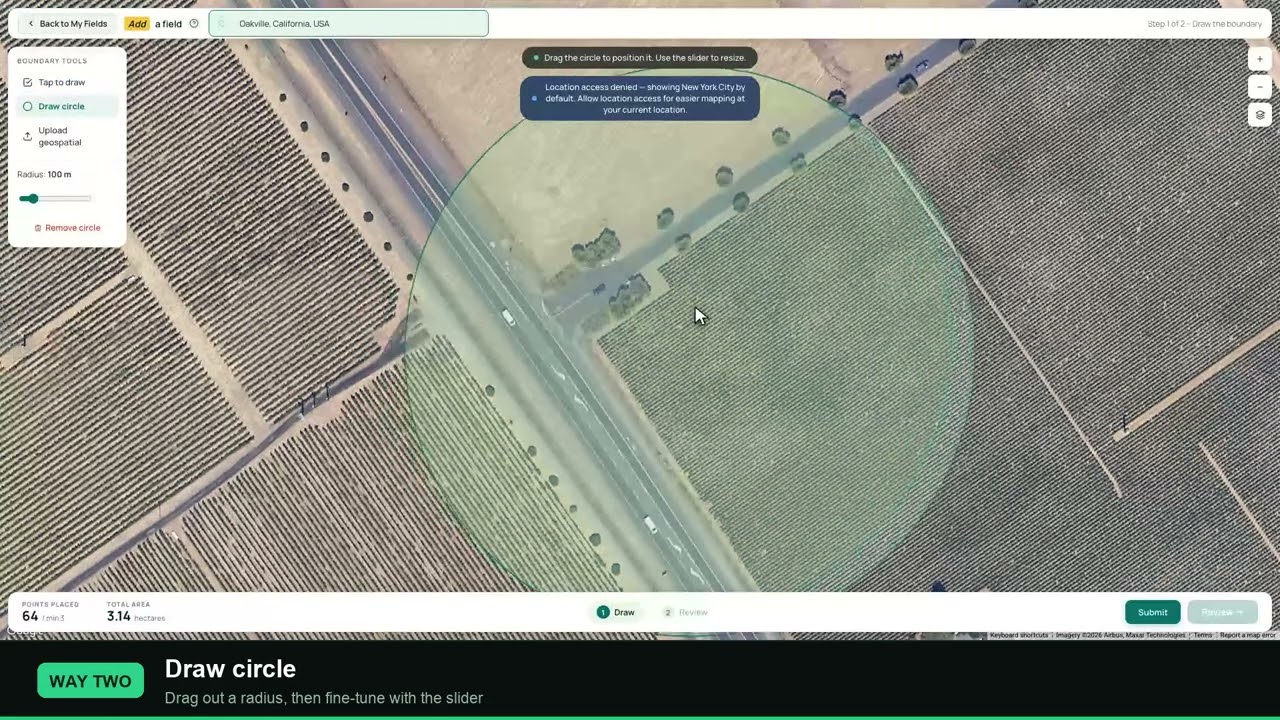
Draw your field boundary, pick your crop, and get per-block irrigation, fertiliser and pest advisories built from satellite passes over your own ground.
Grower-reported outcomes, as submitted
The four cards below reproduce John Vansickle’s answers to our in-app feedback questionnaire for the advisory dated 12 June 2026, exactly as recorded. They are structured survey responses, not paraphrases.
Eight of twenty-five blocks were told to apply no nitrogen, phosphorus, potassium, sulphur or zinc at all.
We should be straight about the limits of this evidence. These are the grower’s own estimates, given in a three-question form, not metered water volumes or invoiced fertiliser tonnages. What our portfolio analysis establishes is consistency: the advisory he was reading contained instructions capable of producing savings of the size he reported, through a mechanism we can point at line by line. That is a stronger claim than a testimonial and a weaker one than an audit.
The grower kept submitting feedback across successive advisories rather than once, and stayed on the platform through a full harvest cycle — 1,048 block advisories over 40 satellite acquisition dates. The phenological stage on every block is grower-editable, so the model sharpens as the season is confirmed from the ground. That combination, continuous satellite cadence plus grower-confirmed stage, is what keeps a 25-block portfolio accurate week to week.
Why zone-level satellite data beats a whole-farm average
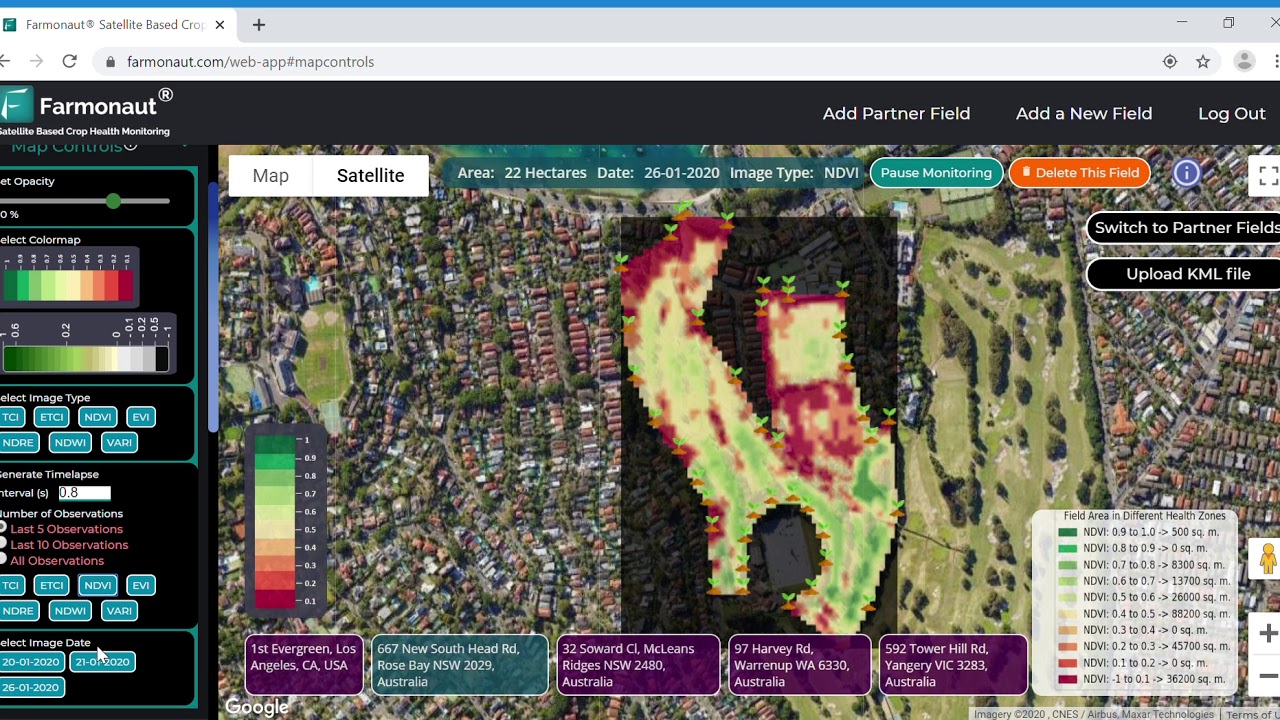
Underneath every section of a satellite blueberry crop advisory sits the same asset: a per-pixel read of the block from orbit. The advisory’s own references list the inputs — Sentinel-2 NDVI and NDWI for canopy vigour and water status, Sentinel-1 radar soil-moisture and vegetation indices, FAO-56 Penman–Monteith for reference evapotranspiration, and UF/IFAS blueberry crop coefficients to convert that into a blueberry-specific demand.

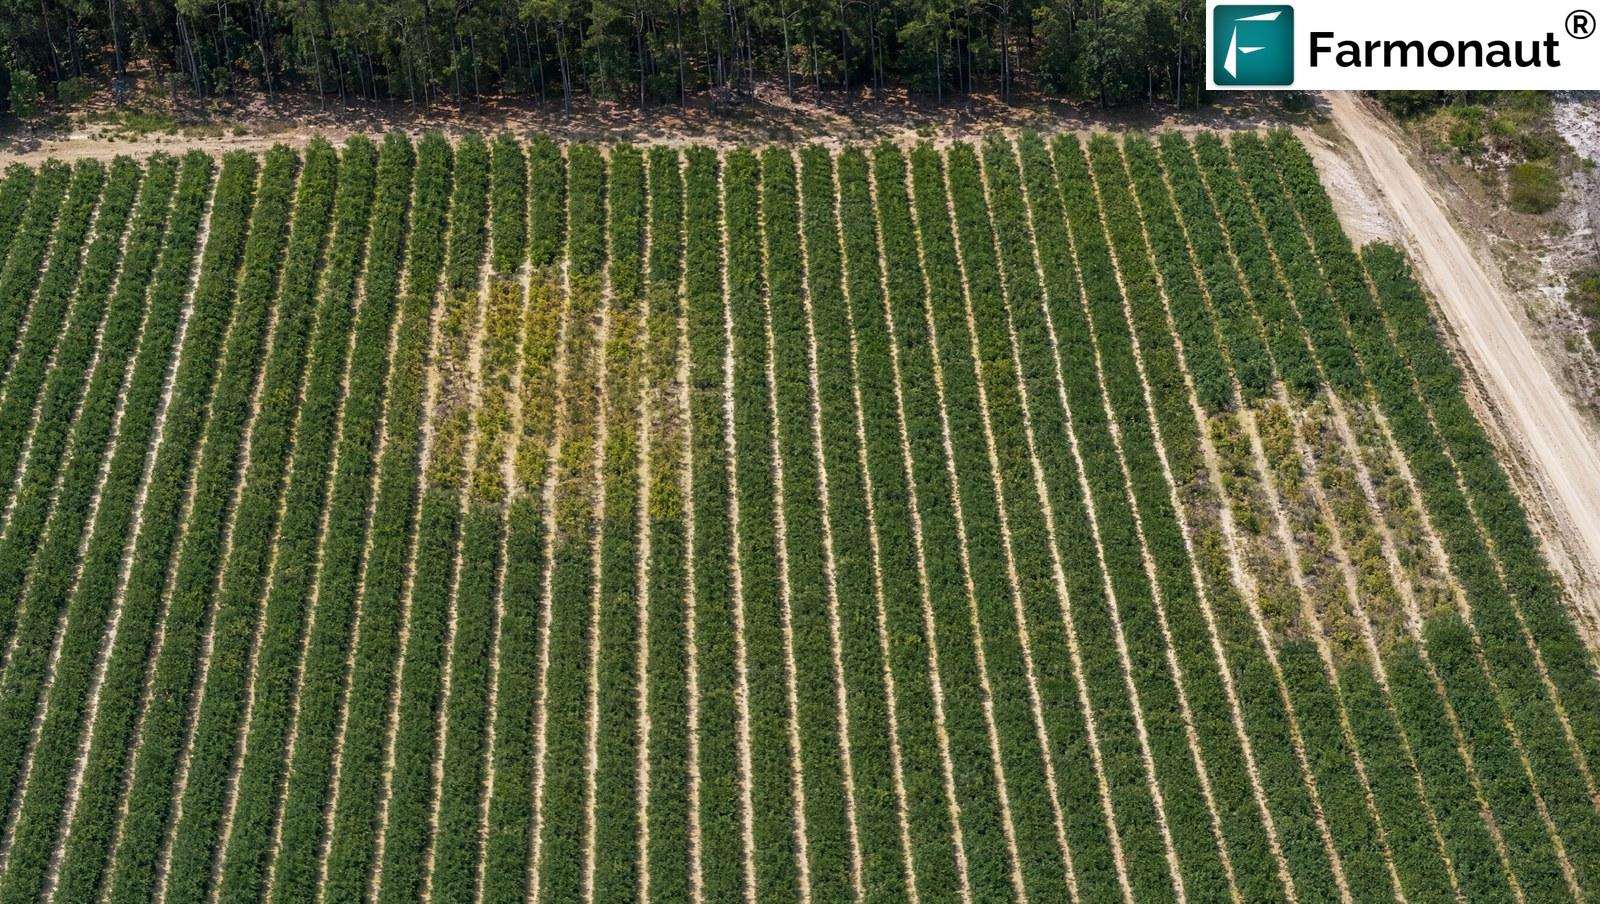
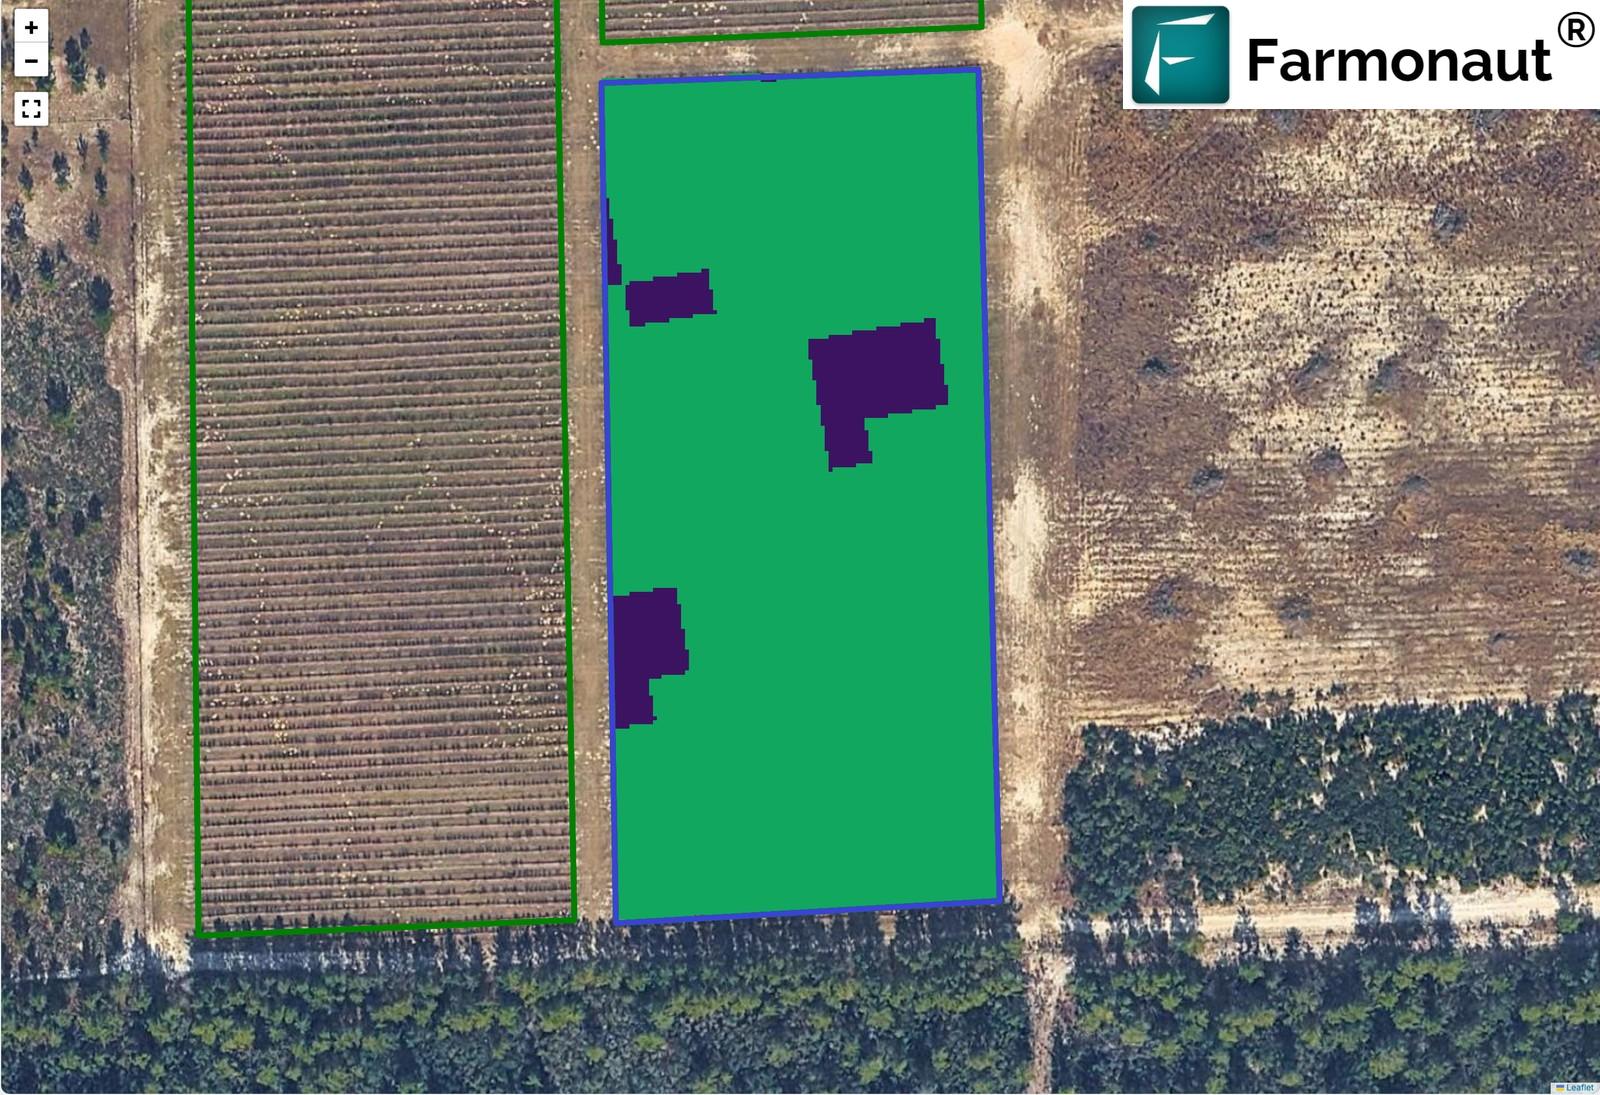
That 8.14% figure is the whole argument for zone-level monitoring in miniature. A block reported as “92% healthy” is a block where a targeted intervention on one-twelfth of the area is worth more than a blanket pass over all of it — and where a farm-level average, blended across 25 blocks, would have reported nothing actionable at all.
The soil section rounds out the picture and shows the model is not simply agreeing with the grower. Across all 25 blocks, pH ran 4.8 to 5.2 — comfortably inside the 4.5–5.5 band blueberry requires, and a genuine strength of the operation. But soil organic carbon came back 0.10–0.20%, flagged low on every block. Salinity was low throughout. So the advisory’s standing recommendation across the portfolio was organic-matter building — composted pine bark, the organic source it names for sulphur — rather than more mineral fertiliser.
Yield estimation as the cross-check
Each block advisory also carries a growth and yield estimate. Across the portfolio these ran 1,950 to 3,510 kg/acre expected, against a modelled local potential band of 1,814–3,628 kg/acre. The lowest expected figure belonged to the same post-harvest block carrying the 96% Spotted Wing Drosophila alert — which is the internal consistency you want to see. The block flagged hardest on pest pressure was also the block projected to yield least.
| Block | Acres | Stage | Irrigation days | Week’s water | Prescribed N | Top alert |
|---|---|---|---|---|---|---|
| p field 7 | 11.29 | Bloom | 5 of 7 | 20.5 mm | 15.4 kg/acre | Flower Thrips 85% |
| field 1 | 8.74 | Harvest | 3 of 7 | 12.7 mm | 6.5 kg/acre | Spotted Wing Drosophila 85% |
| field 6 | 8.21 | Post-harvest | 4 of 7 | 16.0 mm | None required | Spotted Wing Drosophila 85% |
| p field 12 | 7.78 | Harvest | 4 of 7 | 16.5 mm | 12.6 kg/acre | Spotted Wing Drosophila 85% |
| p field 16 | 6.70 | Harvest | 3 of 7 | 13.5 mm | 15.2 kg/acre | Spotted Wing Drosophila 85% |
| field 5 | 6.36 | Harvest | 4 of 7 | 17.0 mm | 38.8 kg/acre | Spotted Wing Drosophila 85% |
| p field 13 | 6.23 | Harvest | 4 of 7 | 17.8 mm | 15.5 kg/acre | Spotted Wing Drosophila 85% |
| p field 4 | 5.94 | Harvest | 4 of 7 | 17.0 mm | None required | Spotted Wing Drosophila 85% |
| p field 14 | 5.59 | Harvest | 4 of 7 | 18.6 mm | 15.3 kg/acre | Spotted Wing Drosophila 85% |
| p field 8 | 5.05 | Bloom | 4 of 7 | 15.4 mm | 37.1 kg/acre | Flower Thrips 85% |
| p field 5 | 4.88 | Fruit development | 4 of 7 | 16.5 mm | 46.9 kg/acre | Spotted Wing Drosophila 85% |
| field 9 | 3.30 | Post-harvest | 4 of 7 | 15.1 mm | None required | Spotted Wing Drosophila 96% |
| Portfolio (25 blocks) | 124.3 | 4 stages | 97 of 175 | 412.3 mm | ~1,764 kg total | 36 alerts ≥80% |
Twelve of the twenty-five blocks are shown, ordered by area, with the portfolio total. The pattern that matters is in the last three columns: no two blocks got the same combination of water, nutrient and alert. That is the difference between a farm advisory and a weather forecast.
How to get this running on your own farm
The workflow that produced everything above is the standard one, and it does not require any hardware in the field.
- Mark your blocks separately. This grower’s results depend on 25 boundaries, not one. Blocks at different stages need different advisories — draw them as they are actually managed.
- Set crop and sowing date per block. The crop coefficient and the phenological model both key off this, and it is what makes stage-aware pest alerts possible.
- Read the irrigation-days count, not just the volume. The skip days are where the water saving is.
- Act on the zeroes in the fertiliser card. A nutrient inside its ideal band is a cost you can decline this cycle.
- Correct the model when it is wrong. Stage labels and field data are grower-editable, and the feedback form is read — as the July correction in this case study shows.
Explore the platform at sat.farmonaut.com, read more about our satellite and AI-based farm advisory in the JEEVN AI overview, or contact our team for portfolio-scale onboarding. JEEVN AI is a paid product; plan detail is on the platform.
Frequently asked questions
What is a satellite blueberry crop advisory, in practical terms?
A satellite blueberry crop advisory is a per-block report generated from a satellite pass over your own field, translated into five working sections: a day-by-day irrigation schedule in millimetres, per-nutrient fertiliser rates for N, P, K, S and Zn, pest and disease risk with control options, weed risk, and soil pH, organic carbon and salinity. In this case study, 25 blocks each received their own report at a median five-day interval.
How can a satellite advisory reduce irrigation by 30–50% without stressing the crop?
Almost entirely by removing unnecessary irrigation events rather than by reducing the amount applied when you do irrigate. In this portfolio, 78 of 175 block-days were issued a zero-irrigation instruction because forecast rainfall covered the demand. The per-event rates stayed normal for the growth stage — the portfolio mean of 16.5 mm for the week is consistent with UF/IFAS crop coefficients for blueberry at harvest and post-harvest.
How much water do blueberries need per week in Florida?
UF/IFAS guidance indicates a mature planting may need more than one inch per week during fruit development and rapid shoot growth, with roughly 40 inches annually from irrigation and rainfall combined. Demand falls after harvest as the crop coefficient drops. The advisory in this case study recommended about 0.65 inches for the week across a portfolio in which 20 of 25 blocks were at or past harvest.
How does the fertiliser advisory reduce cost?
By rating each block separately and returning zero where a nutrient is already inside its ideal range. Eight of this grower’s 25 blocks required no N, P, K, S or Zn at all in the week analysed, and the 17 that did ranged from 6.5 to 46.9 kg/acre of nitrogen — a 7.2-fold spread. Against a uniform blanket programme, the prescribed total was 30.2% to 69.7% lower depending on the blanket rate assumed.
Are the pest probabilities confirmed infestations?
No. They are modelled risk scores combining satellite indices, weather and regional pest pressure, and they should be treated as a scouting priority list. The advisory pairs every alert with both an organic and a chemical control option so the decision stays with the grower. In this portfolio, 36 alerts crossed the 80% threshold, led by Spotted Wing Drosophila on harvest-stage blocks and Flower Thrips on bloom-stage blocks.
Does this work for crops and countries other than Florida blueberry?
Yes — the same pipeline runs on any mapped field boundary, with crop-specific coefficients and pest models. Blueberry in Citrus County draws on UF/IFAS crop coefficients and USDA APHIS regional pest alerts; a different crop and region draws on its own references. The mechanism that produced the savings here — stage-aware demand modelling plus rainfall-gated skip days — is not crop-specific.
Can I monitor many blocks under one account?
Yes. This account runs 25 blocks totalling 124.3 acres, each with an independent advisory, and had received 1,048 block advisories in under six months. Portfolio operators should map each managed block separately rather than drawing one boundary around the whole holding, because the per-block differences are where the savings are found.
Glossary
- NDVI / NDWI
- Satellite indices for canopy vigour and water content respectively, derived from Sentinel-2 reflectance. They drive the zone-level health map.
- Evapotranspiration (ET) and Kc
- ET is atmospheric water demand; the crop coefficient Kc scales it to a specific crop and growth stage. The advisory cites Kc 0.7–0.8 for post-harvest Southern Highbush blueberry.
- FAO-56 Penman–Monteith
- The standard method for computing reference evapotranspiration, named in the advisory’s own irrigation references.
- Phenological stage
- Where a block sits in its season — bloom, fruit development, harvest, post-harvest. It determines nutrient demand, water demand and which pests are relevant.
- Soil organic carbon (SOC)
- A measure of soil organic matter. Flagged low (0.10–0.20%) on every block in this portfolio, driving an organic-matter recommendation rather than a mineral one.
Case-study basis: JEEVN AI block advisories for a single Farmonaut account, satellite acquisition date 11 June 2026 (25 blocks), plus the account’s in-app feedback submission for the advisory dated 12 June 2026 and a public app-store review dated 22 December 2025. Grower name, crop, county, block count and area are reported with the account holder’s details as held on the platform. The 30–50% irrigation and fertiliser figures are the grower’s own estimates from a structured feedback form, not metered or invoiced measurements; the 44.4–48.7% water and 30.2–69.7% nitrogen figures are our modelled comparisons against stated baselines and are presented as ranges for that reason. Pest, disease and weed percentages are modelled probabilities, not confirmed infestations. Yield figures are estimates, not guarantees. Imagery: the four platform screenshots and the crop-health zone map are genuine captures of this account’s own advisory and satellite data; the five wider field photographs are AI-generated illustrative imagery, each labelled as such in its caption, and do not depict the grower, his blocks or his equipment. External agronomic benchmarks are attributed to University of Florida IFAS and the Florida Blueberry Growers Association as cited within the advisory. JEEVN AI is a paid product.
Discussion
Questions, corrections or field experience? Share them below. First-time comments are reviewed before they appear, and your email is never published.
No comments yet. Be the first to add a question or your experience.

 TVS Electronics
 BW Pipelines
 WICO
WICO Gen Chayat
 Chimera Innovation
 Hiteshi Infotech
 SkyHarvest
 Polaris Digitech
 Teledarbas
 Wild Oak Farm
 SFX
SFX BACF Africa
 Doodlakine
 Exurbia Geospatial
 FieldZero
 Indico Company
