Reviewed August 2026 against USDA’s National Agricultural Statistics Service (NASS) and Economic Research Service (ERS) irrigation data, EPA’s WaterSense program figures, and the Alberta Irrigation Districts Association’s economic study.
Try it: Smart Irrigation Water and Cost Savings Calculator →
Remote crop monitoring solutions use satellite imagery, drone flights, or in-field sensors to track crop and soil conditions without a truck windshield in between; smart irrigation systems take that same data, add a weather forecast, and decide when and how much to water. The two are why the average US irrigated acre now receives 1.5 acre-feet of water a season, down from more than 2 acre-feet in 1979, according to USDA’s Economic Research Service. This page breaks down what each type of monitoring and irrigation system actually measures, what US and Alberta farms are spending and saving, and ends with a calculator so you can run the numbers for your own acreage.
Remote Crop Monitoring and Farm Monitoring Solutions, Compared
“Remote crop monitoring solutions” and “farm monitoring solutions” get used interchangeably in marketing, but they cover four distinct technologies that solve different problems. The table below separates them by what each one measures and where it fits, which is the comparison an AI-generated summary tends to flatten into one paragraph.
| Monitoring method | What it measures | Update frequency | Best fit |
|---|---|---|---|
| Satellite-based crop monitoring | Vegetation-health index, moisture stress, field-level change over time | Every few days per field, weather and orbit permitting | Any field size; no on-site hardware to install or maintain |
| Drone/UAV imagery | High-resolution canopy detail, plant counts, localized stress zones | On demand, per flight | Scouting a specific problem area flagged by satellite data |
| Ground-based soil and weather sensors | Soil moisture, temperature, and rainfall at a fixed point | Continuous, real time at the sensor location | Irrigation-scheduling precision on a known field |
| Farm management / crop monitoring software | Combines the above into task lists, yield estimates, and risk flags | Continuous, as new data arrives | Multi-field or multi-site operations tracking several data sources at once |
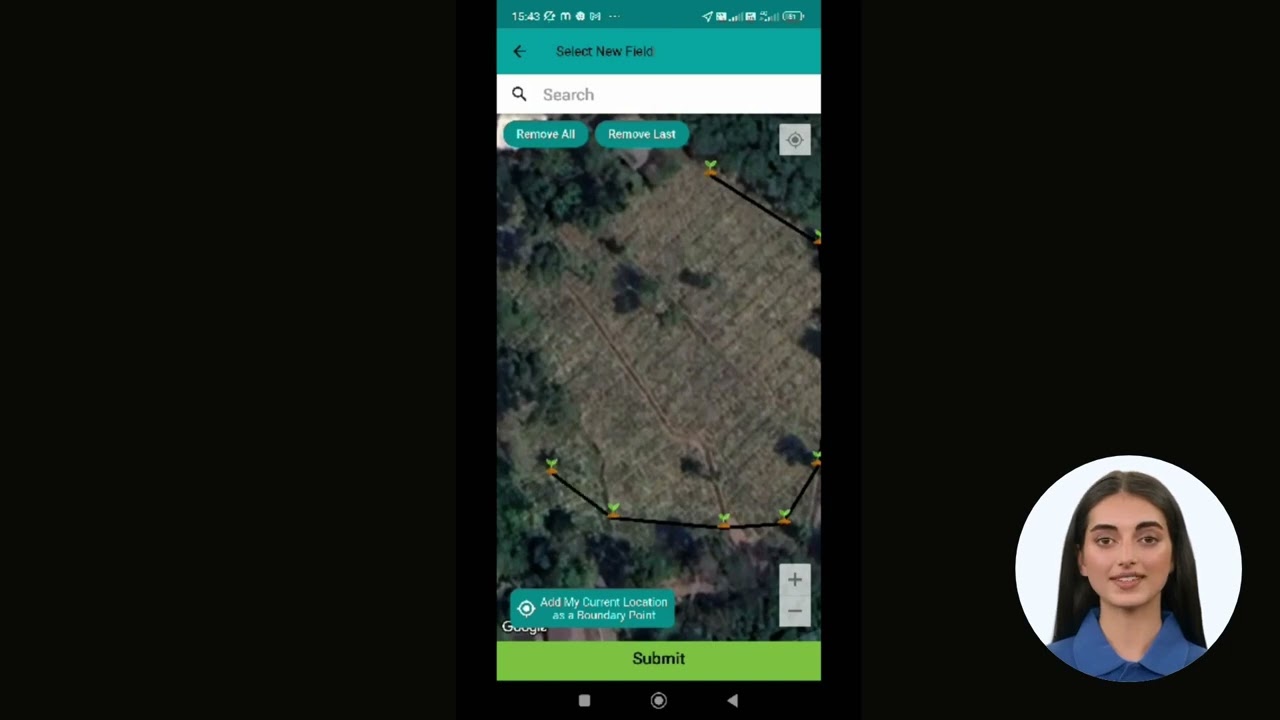
Farmonaut’s own platform sits in the satellite and software rows: it pulls vegetation-health imagery and combines it with weather data inside one app, an approach covered in more depth in this look at remote sensing advances in agriculture and in how precision agriculture technology affects crop health and yield.
Smart Irrigation Systems in Agriculture: System Types and What They Actually Save
“Smart irrigation systems in agriculture” and “agricultural irrigation systems” almost always refer to one of three delivery methods, made “smart” by adding sensors, weather data, or a controller that adjusts scheduling on its own. USDA’s National Agricultural Statistics Service counted 212,714 US farms irrigating 53.1 million acres and applying 81 million acre-feet of water in its 2023 Irrigation and Water Management Survey, published October 2024 — with sprinkler systems covering 12.6 million more acres than gravity irrigation nationwide. Five states, Arkansas, California, Idaho, Nebraska, and Texas, hold half of all US irrigated acres and more than half of the water applied, per that same survey.
| System type | 2023 US footprint | How water is applied | Best fit |
|---|---|---|---|
| Sprinkler (pressurized) | 12.6 million more acres than gravity systems nationwide (USDA NASS, 2023) | Overhead or near-ground spray on a timed or sensor-driven controller | Field crops, pasture, and variable terrain |
| Drip / micro (pressurized) | Part of the 75% pressurized-system share across the 17 Western states in 2023 (USDA ERS) | Slow, targeted delivery at or below the root zone | Orchards, vegetables, and vineyards; requires filtered water |
| Gravity / flood | Fell to under 9.8 million acres in the 17 Western states by 2023, down from 13.5 million in 2013 (USDA ERS) | Water moves by slope through furrows or basins | Rice and pasture where water rights make it cost-effective |
That shift toward pressurized systems is the continuation of a four-decade move away from gravity irrigation across the Western states, and it moves in five-year steps: NASS runs this survey after each Census of Agriculture, so USDA ERS’s Irrigation & Water Use topic page is the place to check for the next update. The geography is shifting too — between 1997 and 2022, California’s irrigated acreage slipped from 8.8 million to 8.2 million acres while Nebraska’s grew from 7 million to 8 million, per the same ERS data. Just over half the water applied nationally, 54%, comes from on-farm wells averaging 241 feet deep, which is exactly why soil-moisture sensors and satellite moisture indices matter most to well-water growers: there is no canal meter to check pumping against.
Sustainable Irrigation Solutions: What the Numbers Show
“Sustainable irrigation solutions” is usually shorthand for controllers that cut water use without cutting yield. EPA’s WaterSense program certifies irrigation controllers that use local weather and soil data to skip cycles a crop or landscape does not need, and its published case data gives three concrete benchmarks instead of a vague promise.
Controlled research trials averaged 50% water savings; real-world case studies on established landscapes averaged 30%; and one documented case, the 372,000-square-foot Granite Park office complex in Dallas, Texas, cut water use 40% (12.5 million gallons) in its first year with a WaterSense-labeled controller, per the EPA WaterSense program page. EPA also estimates that if every US home with an automatic sprinkler system used a properly maintained WaterSense controller, the country would conserve 390 billion gallons and $4.5 billion in water costs annually, because residential outdoor irrigation alone uses close to 8 billion gallons a day, with an estimated half lost to overwatering and inefficiency.
The farm-scale version of the same idea pairs a soil-moisture or weather-driven controller with the crop-monitoring layer above, so the system waters based on what the field needs that week rather than a fixed calendar. Reducing how much water a field needs in the first place is a separate lever — 10 ways to conserve soil covers the practices that cut that baseline demand.

What Smart Irrigation Costs vs. What It Saves
NASS’s 2023 survey put US farmers’ spending on irrigation equipment and infrastructure at $3.0 billion, against $3.3 billion spent on energy to pump that water. Set beside EPA’s $4.5 billion estimate of potential annual nationwide savings from universal WaterSense adoption, the payback case for upgrading a controller, rather than replacing pipe or drilling a new well, looks shorter than most farmers assume.
Smart Irrigation Water and Cost Savings Calculator

Crop Irrigation and Water Treatment in Alberta’s Irrigation Districts
Alberta’s 13 organized irrigation districts, plus private developments outside them, cover about 4.4% of the province’s cultivated land base — yet the Alberta Irrigation Districts Association’s economic study of the 2011–2018 period found that land contributed $5.4 billion a year to provincial GDP and supported about 46,000 full-time-equivalent jobs. That disproportion is exactly why water quality inside those districts gets scrutinized: most district water travels through open canals before it reaches a field, picking up sediment, algae, and organic debris a well rarely carries.
Whether that water needs treatment before irrigation depends on the delivery system, not the crop:
- Canal or reservoir source feeding drip or micro-sprinkler emitters: filtration is almost always required, since sediment and organic matter clog small emitter openings within a season.
- Deep-well source: well water carries far less sediment than canal water, but test for iron, manganese, and carbonate hardness, which foul emitters differently than sediment does.
- Center-pivot or sprinkler systems: tolerate more sediment than drip, so a coarser screen filter is often enough.
- Gravity/flood systems: need no filtration at all.
The standard fixes are sand-media filters for organic loads, screen or disc filters for sand and silt, and chlorine or acid injection for biological or mineral fouling — a district’s irrigation office or an Alberta Agriculture and Irrigation extension agronomist can test a specific water source and recommend which combination applies. Check the Association’s site directly for any update to the 2011–2018 study, since it is the kind of figure that gets revised, not the kind that expires.
Smart Farming Systems: Where Monitoring, Irrigation, and Data Meet
A “smart farming system” is not one product — it is the combination of remote monitoring, an irrigation controller, and a data layer that turns the first two into a decision. How that data layer builds predictive yield and risk models is covered in this look at agricultural data analytics trends. Developers building their own integration, rather than using the app directly, can pull the same satellite and weather feeds through the Farmonaut API, documented in the API developer docs.
Frequently Asked Questions
Q: Do smart irrigation systems work with the pivots and pipe I already have?
A: Most controllers retrofit onto existing sprinkler, pivot, or drip infrastructure — the controller and sensors replace or augment the timer, not the pipe or emitters, in the large majority of installations.
Q: How is “farm crop monitoring software” different from a monitoring device?
A: The software is the layer that combines satellite, drone, and sensor readings into one dashboard and task list; the device or satellite feed is just the raw data source feeding it. The comparison table near the top of this page shows how each source fits into that layer.
Q: Does remote crop monitoring make sense for a small farm, or only large operations?
A: Satellite-based monitoring scales down more easily than drone or ground-sensor networks, since it needs no on-site hardware — the tradeoff on a small farm is that field-level detail is coarser than a drone flight over the same acres.
Q: Where can I find more current irrigation figures than the ones on this page?
A: USDA’s National Agricultural Statistics Service republishes its Irrigation and Water Management Survey after every five-year Census of Agriculture; the October 2024 release cited above covers 2023, and the next edition follows the next Census cycle.
Getting Started
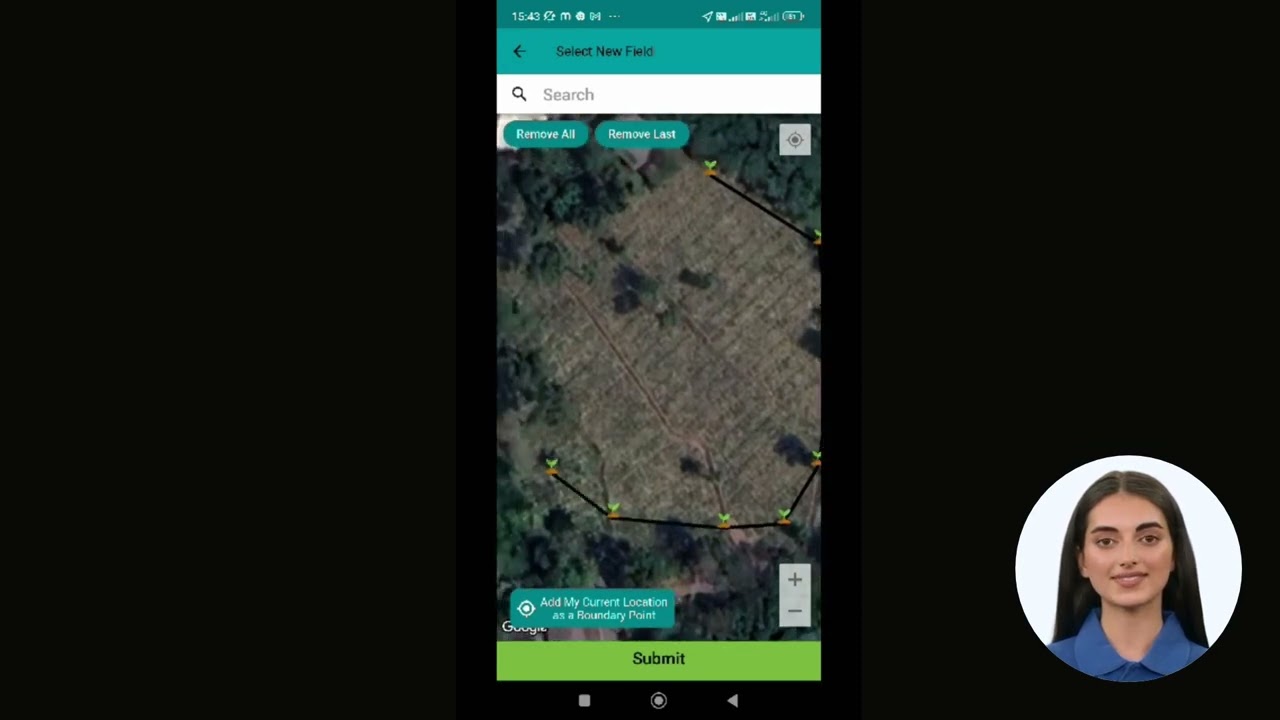
Download the Farmonaut app to start monitoring fields with satellite imagery, or check the subscription options below for irrigation-scheduling and crop-monitoring features at farm scale.