

Malaysia · Farm statistics guide
Malaysia Agriculture: Main Crops, Output and Exports
Farming made up 8.2% of Malaysia’s GDP in 2024 and grew 3.1%, with palm oil supplying 36.8% of the sector’s value added (DOSM). Crude palm oil then reached 20.28 million tonnes in 2025 (MPOB).
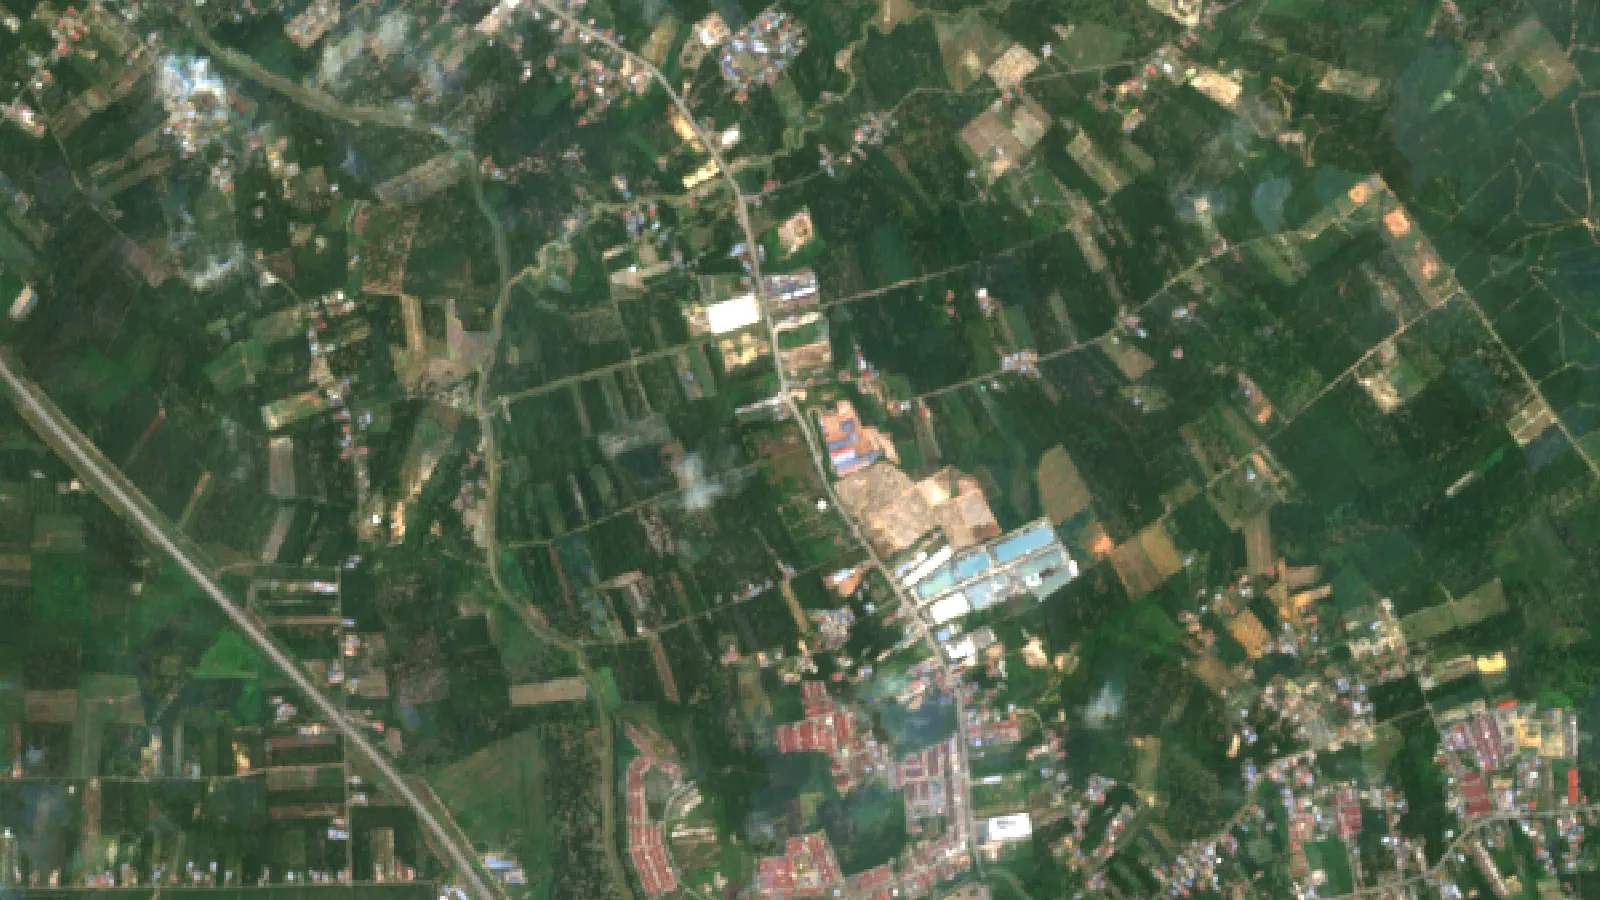
Key takeaways
- Agriculture was 8.2% of GDP in 2024, eighth of ten ASEAN members, and grew 3.1% after 0.2% in 2023 (DOSM).
- Oil palm is the largest crop: 5.70 million hectares and 20.28 million tonnes of crude palm oil in 2025 (MPOB).
- Estate FFB yield rose 6.4% to 17.77 tonnes per hectare in 2025 (MPOB). New palm land is limited, so yield drives growth.
- Palm oil exports fell 9.6% to 15.27 million tonnes in 2025, yet earnings from all palm products rose 2.8% to RM112.43 billion (MPOB).
- Rice is a staple with about 30% of need imported (US Commerce Department), and food imports were RM93.8 billion in 2024 (DOSM).
In this article
- Malaysia agriculture at a glance
- How big is agriculture in Malaysia's economy?
- Main crops in Malaysia and other farm products
- Crop and livestock growth by commodity
- Oil palm yields: what changed in the latest figures
- Calculator: oil palm income per hectare
- Exports, imports and palm oil prices
- Key challenges for farming in Malaysia
- Sustainable agriculture in Malaysia
- Smart farming in Malaysia
- Government policy for the farm sector
- How to track Malaysia agriculture statistics
- FAQ
Malaysia agriculture made up 8.2% of national GDP in 2024 and grew 3.1% that year, up from 0.2% in 2023, according to the Selected Agricultural Indicators 2025 report from the Department of Statistics Malaysia (DOSM). Palm oil is the largest part by far: it supplied 36.8% of the sector’s value added. The other main products are rubber, cocoa, rice, fruit, vegetables, poultry and fish.
This guide sets out the numbers behind that summary: output and growth by commodity, oil palm yields by region for 2024 and 2025, trade, labour, and the farm technology in use. It also includes an oil palm income calculator you can run with your own figures. Each number carries its source and year.
Malaysia agriculture at a glance
| Measure | Latest figure | Period | Source |
|---|---|---|---|
| Share of GDP | 8.2% | 2024 | DOSM |
| Sector growth | 3.1% | 2024 | DOSM |
| Palm value added | RM38.1 billion | 2024 | DOSM |
| Oil palm area | 5.70 million ha | 2025 | MPOB |
| Crude palm oil | 20.28 million t | 2025 | MPOB |
| Palm oil exports | 15.27 million t | 2025 | MPOB |
| Agri-food exports | RM179.2 billion | 2024 | DOSM |
| Farm jobs share | 9.2% | 2025, modelled | World Bank / ILO |
| Farmland share | 24.8% of land | 2024 | World Bank |
DOSM and MPOB (the Malaysian Palm Oil Board) are the national sources. Their years and definitions differ, so compare like with like. DOSM’s report released in December 2025 covers 2024. MPOB’s overview for 2025 is newer, but it covers only oil palm.
How big is agriculture in Malaysia’s economy?
Farming is a smaller part of the economy than in several neighbours. DOSM’s 8.2% share ranked Malaysia eighth of ten ASEAN members. Myanmar was highest at 20.8%, followed by Laos at 16.8%, Cambodia at 16.6%, Indonesia at 12.6% and Vietnam at 11.9%, as the Malaysian Palm Oil Council’s report on the DOSM release shows.
Chart
Value added by group
RM billion, 2024
Within the sector, three groups stand out in the value-added figures. Palm oil brought in RM38.1 billion. The group DOSM calls “other agriculture” brought in RM29.7 billion. Livestock brought in RM17.4 billion. The chart above shows those three; the remaining share of the sector is not plotted because the summary does not itemise it.
The long-run share has barely moved in a decade. In World Bank national accounts data, agriculture, forestry and fishing stood at 8.9% of GDP in 2014 and 8.2% in 2025, with a low of 7.2% in 2019 and a high of 9.6% in 2021. That series differs slightly from DOSM’s and shows 8.1% for 2024 rather than 8.2%. Jobs tell a different story. The modelled ILO estimate of farm employment fell from 12.6% of all jobs in 2014 to 9.2% in 2025. A steady GDP share with a falling job share points to more output per worker.
History puts this in context. A review by researchers at the Malaysian Agricultural Research and Development Institute (MARDI) notes that farming was more than half of GDP in the 1960s, before the country industrialised. The same review splits the sector into two branches, and that split is still the clearest way to read it: export commodities such as oil palm and rubber on one side, and food crops such as paddy on the other.
Chart
Farming’s share of GDP and of jobs
Percent, 2014 to 2025
Main crops in Malaysia and other farm products
By volume, fresh fruit bunches (FFB) from oil palm are the largest crop in Malaysia. DOSM’s report puts 2024 output at about 100 million tonnes, up 5.5%. No other commodity in the release comes close. Here are the main products in turn.
▶ The real difference between a plantation and a farm, explained in plain terms. · 4:29
Oil palm
Oil palm covered 5.70 million hectares in 2025, up 1.6% from 5.61 million hectares in 2024, according to the MPOB overview for 2025. Peninsular Malaysia had 2.54 million hectares, Sarawak 1.66 million and Sabah 1.50 million. MPOB says the rise came mainly from more immature palm area after replanting.
Crude palm oil output hit 20.28 million tonnes in 2025, up 4.9% and the highest in a decade, by MPOB’s account. Peninsular Malaysia produced 11.38 million tonnes, Sarawak 4.50 million and Sabah 4.41 million. Worldwide, the October 2026 USDA oilseeds circular puts Malaysia second to Indonesia for the 2025/26 marketing year, at 20.2 million tonnes against 46.7 million, out of 81.4 million tonnes in all. That is about a quarter of world output.
The US Commerce Department’s country guide says extra land for palm is not available because of deforestation policies and international commitments, so further growth has to come from yield and productivity. This is why the yield numbers in the next section matter. Readers comparing farm systems may also want this overview of plantation crops and rotation.
Rubber and cocoa
Both crops posted large gains in 2024. Natural rubber output rose 11.1% in 2024 and cocoa beans rose 33.3%, the largest gain of any crop in the release. A large percentage on a small base does not mean a large crop, so check the tonnage in the full DOSM tables before you draw conclusions about market size.
Malaysia’s rubber and wood products still count among the main farm and forestry outputs. The US guide says palm oil, rubber, cocoa and wood products make up around half of the combined output of agriculture, fisheries and forestry.
Rice
Rice is a staple, grown for the home market rather than export. The US guide says Malaysia imports about 30% of what it needs, and that the government supports paddy through price support, input subsidies and consumer subsidies. World Bank data show a cereal yield of about 3,540 kg per hectare in 2024, down from about 4,630 kg in 2014. That indicator covers all cereals, not rice alone.
Paddy has its own management issues. The MARDI review cites a study of farmers in Sungai Petani, Kedah, which found 80% used unsustainable practices, under pressure to hit yield and profit targets. That is one local study, not a national rate, but it shows why input use on paddy gets policy attention.
Fruit, vegetables and spices
Selected vegetables rose 11.8% in 2024, kenaf (dry stalks) 11.5%, pepper 7.5% and selected fruits 4.5%, per DOSM. Tropical fruit is also a notable product in the US guide’s summary. Well-known examples include durian, rambutan and papaya. These crops are small next to palm, but they are where some growers look when they want to spread risk away from one commodity price.
Livestock and fisheries
The chicken population rose 3.5% to 327.3 million birds in 2024, from 316.2 million in 2023. Chicken meat output grew 13.7%, beef and buffalo meat 9.6% and fresh milk 5.7%. The US guide calls poultry the dominant protein in the country. On the water, marine fish landings rose 9.6% and freshwater aquaculture 5.7%, while brackishwater aquaculture fell 0.4% to 392,400 tonnes.
Crop and livestock growth by commodity
The 3.1% sector average hides a wide spread. The chart below ranks the crop and livestock products that the DOSM summary gives a growth rate for. Fisheries are covered above. Palm oil’s value added grew 5.1% in 2024, against 0.2% in 2023, and because it is the biggest part of the sector, it moved the average more than any of the faster-growing small crops.
Chart
Output growth by product
Percent change in production, 2024 on 2023
When you read these figures, keep the basis in mind. The output percentages are changes in physical production. The sector’s 3.1% is growth in value added. They are not the same measure, so the crop percentages will not average to 3.1%.
Oil palm yields: what changed in the latest figures
Yield is the number to watch, given the limits on new land. MPOB reports FFB yield of 17.77 tonnes per hectare in 2025 for oil palm estates, up 6.4% from 16.70 tonnes in 2024. The MPOB overview for 2024 had already shown a 5.8% rise from 15.79 tonnes in 2023. MPOB credits better labour supply in both years, which shortened harvest intervals in 2024.
Chart
Estate FFB yield by region
Tonnes per hectare, 2024 and 2025
All three regions gained about one tonne per hectare in 2025, and the gap between them stayed about the same. Peninsular Malaysia was about 3.5 tonnes ahead of Sarawak in both years. Age of palms, soil, rainfall and harvest timing all play a part, so a regional average says little about one block.
Oil extraction rate (OER) is the other half of the sum. It is the share of FFB weight that ends up as crude palm oil. The national OER was 19.74% in 2025, up from 19.67% in 2024, and MPOB links the small gain to more ripe fruit reaching the mills. In 2024 the OER had fallen from 19.86%, a fall MPOB tied to fewer ripe bunches and to heavy rain and flooding.
Calculator: oil palm income per hectare
Use this to test your own block or estate. Enter your area, yield, price and cost. The default values are examples set close to break-even, not benchmarks or forecasts. For reference, MPOB’s 2025 average mill-gate FFB price was RM930 per tonne, and its 2025 estates yield was 17.77 tonnes per hectare. Replace these with your own figures, as both move through the year.
The result is a planning estimate only. It does not allow for immature palms, replanting or seasonal swings in yield. Get professional advice before making a financial decision on it.
Try the numbers for your own farm below.
Calculator
Oil palm income estimator
Enter your own area, yield, price, extraction rate and cost.
- FFB harvested: 1,700 t
- Crude palm oil equivalent: 335 t
- FFB sales: 1,581,000 RM
- Break-even FFB price: 912 RM/t
Example values set near break-even, not benchmarks or forecasts. All numbers are your inputs. The FFB price is an example, use today’s price. MPOB’s 2025 figures for comparison: estates yield 17.77 t/ha, national OER 19.74%, mill-gate FFB RM930/t. Costs are your own; no cost benchmark is built in. Amounts in Malaysian ringgit (RM).
Exports, imports and palm oil prices
Malaysia runs a farm trade surplus in DOSM’s figures. Exports of agri-food and selected agricultural products rose from RM160.7 billion in 2023 to RM179.2 billion in 2024. Imports rose from RM135.4 billion to RM154.4 billion, and food imports alone came to RM93.8 billion in 2024. So the country earns a lot from commodities and still buys much of its food. The US guide lists wheat, rice, protein meal, dairy, beef and most deciduous and citrus fruit among products it relies on imports for.
Palm oil exports fell 9.6% in 2025 to 15.27 million tonnes, from 16.90 million in 2024. Export earnings for all palm products still rose 2.8% to RM112.43 billion, which MPOB ties to firmer prices. Palm oil on its own earned less, down 1.8% to RM71.63 billion; palm kernel oil and oleochemicals earned more. Seven major markets took 51.5% of palm oil exports in 2025. Among them, the European Union bought 1.03 million tonnes, China 0.90 million, Türkiye 0.75 million and Japan 0.59 million.
Prices below are MPOB annual averages for 2025, not today’s market prices. Crude palm oil averaged RM4,292.50 per tonne, up 2.7% from RM4,179.50. Palm kernel averaged RM3,424.50, up 29.4%. Palm oil stocks ended 2025 at 3.05 million tonnes, up 78.6% on a year earlier, as output rose while exports fell.
Key challenges for farming in Malaysia
- Labour. MPOB’s reports show how directly labour supply feeds into yield. The share of jobs in farming has also been falling for a decade.
- Land. Palm expansion is limited, per the US guide, and World Bank data show agricultural land slipping from 26.3% of land area in 2019 to 24.8% in 2024.
- Weather. MPOB linked the lower extraction rate of 2024 partly to heavy rain and floods in June, July and the last quarter of the year.
- Price swings. Palm and rubber earnings follow world benchmarks that local growers do not set. In 2025, exports of all palm products fell 7.2% by volume, yet their revenue rose 2.8%.
- Food dependence. Rice imports and an RM93.8 billion food import bill keep food security on the policy agenda.
- Uneven access to technology. Large plantation groups and small growers do not start from the same place on capital, training or connectivity, and MSPO, for one, has separate parts for smallholders.
Sustainable agriculture in Malaysia
For palm oil, sustainability mostly means certification. Two schemes matter. The Roundtable on Sustainable Palm Oil (RSPO) is a voluntary global scheme, formed in 2004 by founders including WWF and the Malaysian Palm Oil Association. Malaysian Sustainable Palm Oil (MSPO) is the national standard. MSPO’s revised version, MS 2530:2022, replaced the 2013 text, and it has separate parts for independent and organised smallholders with under 40.46 hectares. Check the current scheme rules and your buyer’s requirements before you plan for either.
On the farm, a few methods come up again and again. Our page on core sustainable farm practices explains how they work in general.
- Targeted inputs. Fertilizer and water go where the crop needs them, rather than at one rate across a block. Always check the product label and local rules.
- Mixed systems. Grazing or intercropping under palm or rubber can add income and return nutrients to the soil, depending on palm age and shade.
- Agroforestry. Trees planted among crops can add soil cover and habitat within a block.
- Carbon records. Buyers may ask for emissions data along with a certificate, so farms keep measured records rather than estimates.
- Traceability. Some buyers want to trace fruit back to the plantation block.

▶ A guide to carbon farming and what it means for soil and farm practice. · 5:30
Smart farming in Malaysia
Oil palm is where most remote sensing work has been done. The MARDI review on precision agriculture in Malaysia says the technique in oil palm centres on remote sensing of trees, soil and conditions across large areas. It describes three uses that a plantation manager will recognise:
- Mapping. Telling oil palm canopy apart from forest, buildings, bare ground and other plants, to fix plantation boundaries and track area over time.
- Disease detection. Spotting the fungal disease Ganoderma boninensis, which rots trunks and leaves palms prone to falling in high wind. Early detection makes it easier to remove and isolate infected trees.
- Yield and palm age estimates. Researchers have compared 12 years of yield records with satellite vegetation indices. Overhead images cannot see ripe bunches under the crown, so these models also rely on palm age, rainfall, soil and harvesting records.
For paddy, the same review looks at precision methods across the cultivation cycle, including site-specific soil nutrient mapping that cuts down on manual sampling and lab work. Drones and field sensors extend the same idea to smaller areas.
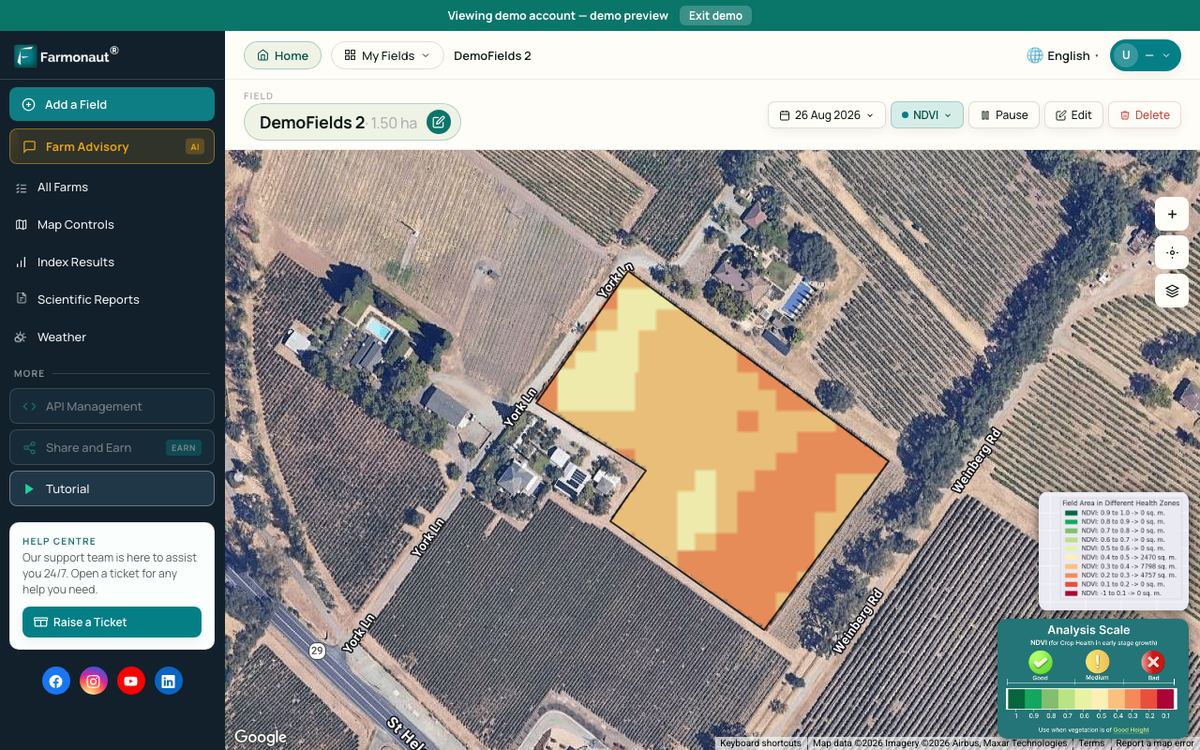
For a manager, the practical test is simple. Does the tool find a problem early enough to change what you do this round, and does it cover the area your staff cannot walk in time? Satellite services such as the Farmonaut Satellite + AI Farm Monitoring System are one way to compare vegetation maps across blocks, then send field staff to the ones that lag. A map shows where to look, not what is wrong, so a field check should still confirm the cause.

▶ A step-by-step tutorial on monitoring crops with satellite imagery on the web. · 8:43
Government policy for the farm sector
Policy follows the sector’s two branches. On food, the US guide describes subsidies for paddy. On commodities, it says nearly all new meaningful farm investment goes to palm plantations, and that research and extension are strong, particularly in palm. Many of the country’s largest plantation companies also have state ownership. National direction now sits in the Thirteenth Malaysia Plan published by the Ministry of Economy, which readers can check for sector targets.
For exporters selling into Malaysia, the same guide notes that beef, poultry and dairy products need halal certification, and that foreign dairy producers and exporters must register with the government. Some lenders and insurers also use satellite records; this is a summary of satellite-based crop loan and insurance solutions. Check local rules and get professional advice for any import, finance or legal decision.
How to track Malaysia agriculture statistics
These figures will date. Three checks keep your numbers current:
- DOSM. See the Selected Agricultural Indicators release page for the newest edition and the full tables, including crop tonnages not listed here.
- MPOB. Its yearly overview gives area, output, yield, OER, exports and prices for oil palm, and comes out sooner than the all-sector data.
- USDA. The monthly oilseeds circular gives forecasts of Malaysian output and exports, side by side with other countries. Forecasts get revised, and they use a marketing year rather than a calendar year.
When a new release lands, ask three questions. Is growth spread widely or led by one or two products? Is the estate FFB yield holding at or above 17.77 tonnes per hectare? And did exports fall while stocks rise, as they did in 2025?
Related pages on our site: supply-chain traceability, carbon footprint tracking, fleet and machinery management, large-scale farm management, the monitoring app, satellite and weather data API and API developer documentation.
FAQ
Is Malaysia an agricultural country?
Not mainly. Farming was 8.2% of GDP in 2024 (DOSM) and about 9.2% of jobs in 2025 (modelled ILO estimate). It still matters a great deal for exports, through palm oil, and for food supply.
What are the main crops in Malaysia?
Oil palm is the largest by far, at about 100 million tonnes of fresh fruit bunches in 2024. Other main crops are rubber, cocoa, paddy rice, pepper, kenaf, tropical fruits and vegetables.
What are Malaysia’s main agricultural products for export?
Palm oil and palm products lead, with RM112.43 billion in export earnings in 2025 (MPOB). Rice is grown for the home market, and imports cover about 30% of need, per the US Commerce Department guide.
How fast is agriculture in Malaysia growing?
The sector grew 3.1% in 2024, up from 0.2% in 2023 (DOSM). Within that, palm oil value added rose 5.1%, cocoa output 33.3% and chicken meat output 13.7%.
How much of Malaysia’s land is used for farming?
World Bank data put agricultural land at 24.8% of land area in 2024. Oil palm alone covered 5.70 million hectares in 2025, per MPOB.
How can oil palm growers use satellite data?
Mainly to compare blocks, track canopy changes and direct field checks. Research covers mapping, disease detection and yield estimates. Yield estimates need ground records as well, because ripe bunches are hidden under the crown.
Farmonaut crop monitoring
Compare your blocks from space
Draw your blocks once and Farmonaut shows satellite vegetation maps for them through the season, on web, Android or iOS.



Keep reading


Sources
- Malaysian Palm Oil Council, report on DOSM Selected Agricultural Indicators 2025 (December 2025): mpoc.org.my
- DOSM, Selected Agricultural Indicators, Malaysia 2025, release page: dosm.gov.my
- MPOB, Overview of the Malaysian Oil Palm Industry in 2025: bepi.mpob.gov.my
- MPOB, Overview of the Malaysian Oil Palm Industry in 2024: bepi.mpob.gov.my
- USDA FAS, Oilseeds: World Markets and Trade (October 2026): apps.fas.usda.gov
- US International Trade Administration, Malaysia Country Commercial Guide: Agricultural Sector: trade.gov
- Bujang and Abu Bakar (MARDI), Precision Agriculture in Malaysia, FFTC-AP (2019): ap.fftc.org.tw
- World Bank, agriculture, forestry and fishing value added (% of GDP), Malaysia: data.worldbank.org
- World Bank, employment in agriculture (modelled ILO estimate), Malaysia: data.worldbank.org
- World Bank, agricultural land (% of land area), Malaysia: data.worldbank.org
- World Bank, cereal yield, Malaysia: data.worldbank.org
- RSPO, Who we are: rspo.org
- MSPO, Certification standards (MS 2530:2022): mpocc.org.my
- Ministry of Economy Malaysia, Thirteenth Malaysia Plan (RMK13): rmke13.ekonomi.gov.my
Discussion
Questions, corrections or field experience? Share them below. First-time comments are reviewed before they appear, and your email is never published.
No comments yet. Be the first to add a question or your experience.

 KhetiBuddy
 Agro La Gándara
 Global Agrifood
 HIPSAC
 ZOL Zimbabwe
 Juligerm
 AdBio
 MISE Maroc
 NWNS
 Red August Group
 Farm Inc
 WeMe Global
 Agrotoken
 Blue BearX
 Insignito
 Croptimum
 DnCubed
 Field Capacity
 Indosistim Teknologi

 Licence holder · Niger · Gold
 Licence holder · Nigeria · Gold + lithium










