

Smart agriculture · Presentation outline
Smart Agriculture PPT: 12-Slide Outline With Sourced Facts
Build a smart agriculture PPT in 12 slides: the problem, the tools, who uses them, what they cost and what holds farmers back. Most slides below have a dated fact from USDA, FAO, the UN or GAO, plus mission and rule facts from ESA, NASA and the FAA, that you can cite on screen.
Key takeaways
- Only 22% of US farms used precision agriculture practices in 2025, down from 27% in 2023 (USDA NASS, 2025).
- Use varies widely by state: 50% of North Dakota farms used precision practices in 2025, against 14% in Texas (USDA NASS, 2025).
- Automated guidance covered 58% of US corn acres in 2016; drones, aircraft and satellite imagery covered 7% (USDA ERS, 2023).
- About 13% of US irrigating farms that reported a scheduling method used a soil moisture sensor in 2023 (USDA NASS).
- Replacing a guidance system cost soybean farms about $20,165 on average in 2018 (USDA ERS, 2023), so test returns on your own numbers.
In this article
- The smart agriculture PPT outline at a glance
- Slide 1: Why farming needs better data
- Slide 2: What smart agriculture means
- Slide 3: The smart farming toolkit
- Slide 4: How many farms use precision agriculture
- Slide 5: Which tools farmers use most
- Slide 6: Connectivity, the base layer
- Slide 7: Satellites and crop monitoring
- Slide 8: Sensors, IoT and smart irrigation
- Slide 9: Drones in the field
- Slide 10: What the tools cost and what they return
- Slide 11: Barriers to adoption
- Slide 12: Summary and source slide
- Variations: precision, IoT and digital agriculture decks
A good smart agriculture PPT tells one story in about 12 slides: why farming needs data, which tools exist, how many farms use them, what they cost, and what holds farmers back. The strongest opening number is a surprising one: only 22% of US farms said they used precision agriculture practices in 2025, down from 27% in 2023, according to USDA NASS Technology Use report (August 2025).
This page gives you a slide-by-slide outline you can copy into PowerPoint or Google Slides. Each slide has the points to show, one or two facts with the named source, and a short speaker note. You also get four charts built from public data, a cost table, and a calculator that tests whether a precision tool could pay for itself on a farm you name.
The smart agriculture PPT outline at a glance
Use this table as your agenda slide or as a checklist while you build. The order moves from the problem, to the tools, to the evidence, to the limits. That order keeps a farm audience with you, because the “does it pay?” question comes after they know what each tool does.
| Slide | Title | Key fact to show | Source |
|---|---|---|---|
| 1 | Why farms need data | World population expected to peak near 10.3 billion in the mid-2080s | UN, 2024 |
| 2 | What smart agriculture means | Climate-smart agriculture has three pillars | FAO, 2013 |
| 3 | The toolkit | Guidance, yield maps, soil maps, variable rate, sensors, imagery | USDA ERS, 2023 |
| 4 | Who uses it | 22% of US farms in 2025 | USDA NASS, 2025 |
| 5 | Which tools lead | Guidance on 58% of corn acres in 2016 | USDA ERS, 2023 |
| 6 | Connectivity | 85% of US farms had internet access in 2025 | USDA NASS, 2025 |
| 7 | Satellites | Sentinel-2: up to 10 m pixels, 5-day revisit (two satellites) | ESA |
| 8 | Sensors and irrigation | 13% of irrigating farms that reported a method used soil moisture sensors in 2023 | USDA NASS, 2023 survey |
| 9 | Drones | Spray drones need an FAA Part 137 certificate | FAA |
| 10 | Costs and returns | Guidance replacement cost about $20,000 | USDA ERS, 2023 |
| 11 | Barriers | Up-front cost, data ownership, missing standards | GAO, 2024 |
| 12 | Summary and sources | Three take-home points and your source list | Your own |
Slide 1: Why farming needs better data
Open with the pressure on food supply, not with technology. The audience should feel the problem before they see a sensor or a satellite.
- Show: a world population line or a single large number.
- Fact: the UN World Population Prospects 2024 projects that world population will peak at about 10.3 billion in the mid-2080s and ease to about 10.2 billion by 2100.
- Fact: in its 2013 climate-smart agriculture sourcebook, FAO estimated that farm production would need to rise by 60% by 2050 to meet food and feed demand if income and consumption trends continued.
Speaker note: say the year of each projection out loud. Projections change with every revision, and a sharp audience will ask.
Slide 2: What smart agriculture means
Many people mix up three terms. Put them side by side on one slide.
- Precision agriculture: managing each part of a field by its needs, using tools such as GPS guidance, yield maps, soil maps and variable rate application. USDA’s Economic Research Service uses these tools to track adoption.
- Climate-smart agriculture: an approach FAO defined in 2010 with three main pillars: raise productivity and incomes in a sustainable way, adapt and build resilience to climate change, and cut or remove greenhouse gas emissions where possible.
- Digital or smart agriculture: the wider use of data, connected devices, imagery and software on the farm. It includes precision tools and adds things like farm records, market apps and remote monitoring.
Speaker note: tell the audience which meaning your deck uses. Most of the data in this outline measures precision tools, because that is what US surveys count.
▶ Six plain steps to start precision farming without buying a robot · 4:18
Slide 3: The smart farming toolkit
One table slide works better than six photo slides. Keep it to what each tool measures and what decision it helps with.
| Tool | What it records | Decision it supports |
|---|---|---|
| GPS guidance | Machine position in the field | Fewer skips and overlaps when planting or spraying |
| Yield monitor and map | Grain flow, moisture and location at harvest | Which zones pay and which do not |
| Soil map | Soil type or sampled nutrients by zone | Where to change seed or fertilizer rates |
| Variable rate | Rate applied at each point | Putting inputs where the map says they are needed |
| Soil moisture sensor | Water in the root zone | When to irrigate |
| Satellite imagery | Crop reflectance over time | Where to scout first |
| Drone | Close-up images, or spraying | Spot checks and targeted application |
The ERS report Precision Agriculture in the Digital Era (February 2023) describes yield monitors as a mass flow sensor, a moisture sensor and a GPS receiver working together. That one line makes a clear caption under a yield map.
Slide 4: How many farms use precision agriculture
This is the slide that surprises people. Since 2021, NASS has asked farm operators whether they used precision practices such as GPS guidance, yield monitoring, soil mapping, variable rate, drones, electronic tagging or robotic milking in the last 12 months. The national share was 25% in 2021, 27% in 2023 and 22% in 2025.
The share is much higher in the grain states. In 2025 it was 50% in North Dakota and 42% in both Iowa and Illinois, against 14% in Texas. The question counts farms, not acres, and NASS counts any place that sold, or would normally sell, $1,000 or more of farm products as a farm. The GAO review of precision agriculture (January 2024) also quotes the 27% figure for 2023.
Speaker note: NASS does not give a reason for the fall from 2023 to 2025. Say so, rather than guess.
Chart
Farms using precision agriculture, 2023 vs 2025
Percent of all farms; the seven states NASS reports, and the US total (excl. AK, HI)
Slide 5: Which tools farmers use most
Acres tell a different story from farm counts. ERS found that in 2019 roughly 12% of US farms used GPS for field work, but those farms held 40% of farm and ranch acres. ERS also finds that larger row-crop farms adopt these tools at higher rates. ERS also found that automated guidance was used on 5.3% of planted corn acres in 2001 and 58% in 2016. In 2019 it covered 72.9% of sorghum acres and 64.5% of cotton acres.
Drones, aircraft and satellite imagery were the least used tools in the ERS survey: 7.0% of corn acres in 2016 and 9.8% of soybean acres in 2018. That gap is a good discussion point for your audience.
Chart
Corn acres managed with each precision tool
Percent of US planted corn acres, 2016 survey
Slide 6: Connectivity, the base layer
Every smart tool needs data to move from the field to a screen. US farm internet access has risen steadily in the NASS series, from 62% of farms in 2011 to 85% in 2023 and 2025. In 2025, 55% of farms used a broadband connection and 74% used a cellular data plan, and 82% had a smartphone.
Chart
US farms with internet access
Percent of farms, survey years 2011 to 2025
Speaker note: NASS changed the questions in 2021, so treat the jump between 2019 and 2021 with some care. The remaining 15% without access is your opening for a discussion on rural broadband.
Slide 7: Satellites and crop monitoring
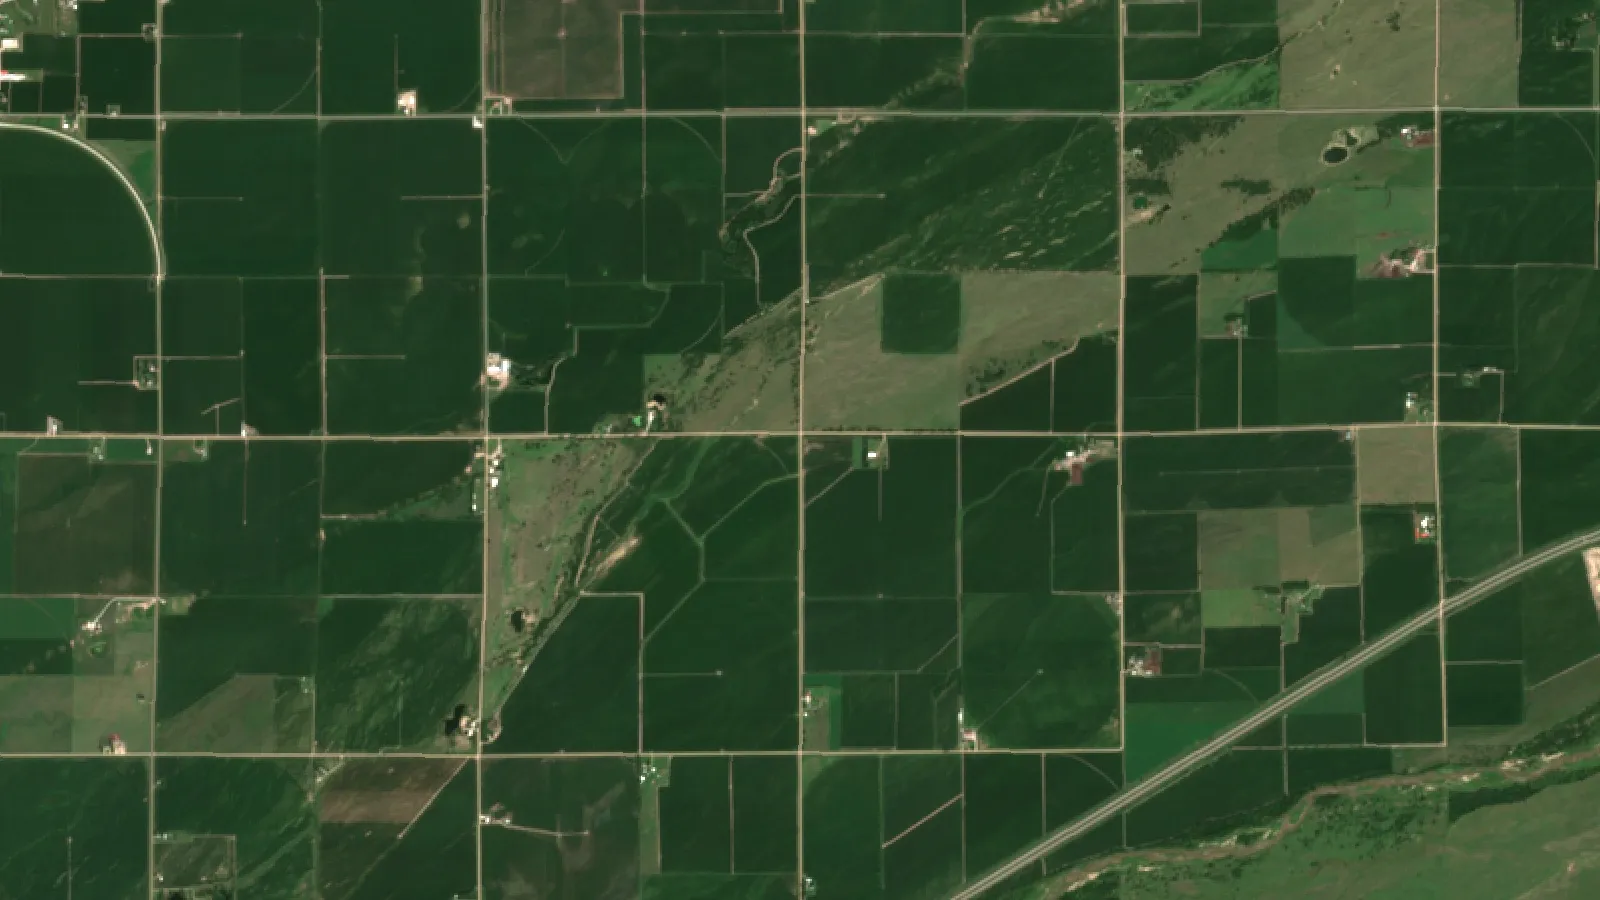
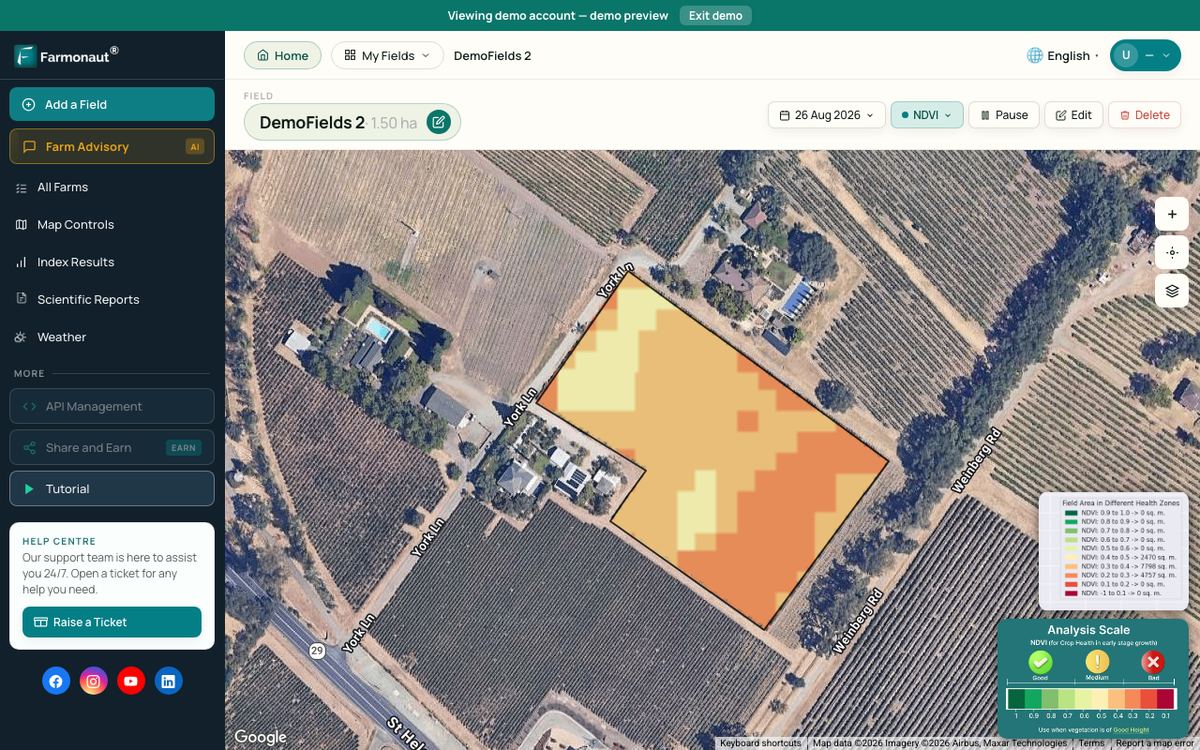
Satellite imagery is the easiest smart tool to show, because the pictures speak for themselves. Put one field on the slide as a true-colour image next to a vegetation index map, and explain that greener means more active growth, not a known cause.
- Sentinel-2: the European Space Agency lists up to 10 m resolution, 13 spectral bands, a 290 km swath and a 5-day revisit with its two satellites.
- Landsat 8 and 9: NASA lists 30 m multispectral bands and a 16-day revisit for each satellite, or 8 days for the pair. Standard Landsat data products are available at no cost to users.
Services such as Farmonaut turn these images into field-level crop health maps, so a grower can see which part of a field to walk first. If you want screenshots for your own slides, the Farmonaut web app shows the same index maps on your own fields.
▶ Tutorial: monitoring crop health on satellite index maps in the Farmonaut web app · 8:43
Slide 8: Sensors, IoT and smart irrigation
If your audience searched for “smart agriculture using IoT”, this is the slide they came for. IoT simply means sensors that send readings over a network. Irrigation timing is one use that USDA measures.
The USDA 2023 Irrigation and Water Management Survey asked irrigating farms how they decide when to water; 212,714 farms reported at least one method. Most (77%) looked at the crop, and 40% felt the soil. Only 27,831 farms, about 13%, used a soil moisture sensing device, and fewer than 1% used computer simulation models. Farms could tick more than one method.
Speaker note: this is a clear “room to grow” message. A sensor gives a number where a hand test gives a feeling.
Chart
How US farms decide when to irrigate
Percent of the 212,714 irrigating farms that reported any method, 2023. Farms could report more than one.
Slide 9: Drones in the field
Split drones into two uses: scouting and spraying. Scouting drones take images; spraying drones apply products and face stricter rules.
- In the US, the FAA treats drone spraying of pesticides, fertilizer or seed as an agricultural aircraft operation under 14 CFR Part 137.
- Drones under 55 pounds, including the load, can fly under Part 107 but need exemptions. Heavier drones fly under Parts 91 and 137. Operators also need a Remote Pilot Certificate and a registered drone.
- Always follow the product label and local rules for any product applied by drone.
Slide 10: What the tools cost and what they return
Farm audiences will ask about money, so give real numbers with their year. ERS reported average replacement costs and fees from its farm surveys.
| Tool | Soybean farms, 2018 | Cotton farms, 2019 |
|---|---|---|
| Guidance | $20,165 to replace; $1,154 annual fee | $25,168 to replace |
| Yield monitor | $8,051 to replace; $1,041 annual fee | $13,775 to replace; $1,772 annual fee |
| Variable rate | $5,630 premium for equipment | $10,319 premium for equipment |
| Drones, aircraft or satellites | $2,610 to replace | Sample too small |
On returns, ERS cites a study of 2010 US corn farms that found GPS mapping raised operating profits by almost 3% and variable rate technology by 1.1%. These are survey-based estimates for corn farms. Your result depends on field variability, input prices and how the data is used. The calculator below lets your audience test their own numbers.
Try the numbers for your own farm below.
Calculator
Could a precision tool pay for itself on your farm?
Enter your own acres, costs and expected gains. Use the result as a worked example on slide 10.
- Benefit per acre: $14
- Tool cost per acre: $10
- Acres needed to break even: 370 acres
Example values only, not a benchmark or a forecast. Enter the yearly cost of the tool (purchase spread over its life plus fees). For scale, USDA ERS (EIB-248, 2023) reported average replacement costs of $20,165 for guidance and $8,051 for a yield monitor on soybean farms in 2018. The saving and yield gain are your own estimates. The 3% saving default is an example; it is not the ERS operating-profit estimate.
Slide 11: Barriers to adoption
A balanced deck earns trust. The GAO report lists high up-front costs, concerns over farm data sharing and ownership, and a lack of common standards that stops machines and software from working together. ERS adds that adoption follows farm size: at least half of larger row-crop farms use yield maps, soil maps, variable rate or guidance, while fewer than 25% of the smallest farms use any of the four (except for cotton).
- Cost: show the table from slide 10.
- Skills: data is only useful if someone reads it.
- Connectivity: 15% of US farms still reported no internet access in 2025.
▶ The real advantages and disadvantages of precision agriculture, shown on an actual field · 2:39
Slide 12: Summary and source slide
End with three short points the audience can repeat, then a slide listing every source with its year. For example:
- About one US farm in five used precision practices in 2025, and adoption is much higher on large grain farms.
- Guidance is the most used tool; imagery and drones are the least used, so there is room to grow.
- Costs are real, so test each tool on your own numbers before you buy.
Variations: precision, IoT and digital agriculture decks
The same 12 slides work for the related decks below. Change the weight, not the structure.
- Precision agriculture PPT: expand slides 3, 5 and 10. Add a yield map and a variable rate prescription map from one field.
- Smart agriculture using IoT PPT: expand slides 6 and 8. Add a simple diagram: sensor, gateway, cloud, phone alert. Name the power and network source for each part.
- Digital agriculture PPT: add a slide on farm records and supply chains, for example product traceability, carbon footprinting, fleet management and crop loan and insurance checks (Farmonaut’s pages: product traceability, carbon footprinting, fleet management, crop loan and insurance).
- Agriculture PowerPoint for students: keep slides 1, 2, 4 and 7, and add a class exercise: compare two satellite images of the same field one month apart.
Common mistakes in smart farming presentations
- Numbers with no year. Adoption and price figures change every survey. A figure without a year looks out of date even when it is not.
- Mixing farms and acres. 22% of farms and 58% of corn acres are both true, but they measure different things. Label each one.
- Vendor claims as evidence. A yield gain quoted in a sales brochure is not a trial result. Use survey data or published trials, and name them.
- Too many tools. If the deck covers ten technologies in ten minutes, the audience remembers none. Pick the three that matter most to the people in the room.
- No local example. One field from your own region, shown on a satellite image or a yield map, does more than any global statistic.
How to build your agriculture PowerPoint in five steps
- Pick one audience. Farmers want costs and steps; students want definitions; investors want adoption trends.
- Write the three closing points first. Every slide should support one of them.
- Collect the data. Download the tables you need from the sources listed below and note the year of each.
- Make one chart per slide. Put the source and year in small text under the chart.
- Rehearse with the notes. Aim for about one to two minutes per slide, and cut any slide you cannot explain in one sentence.
Infographic
Build the deck in 5 steps
- 1Pick one audienceFarmers, students and investors need different slides.
- 2Write the close firstThree take-home points that every slide supports.
- 3Collect dated dataDownload tables and note the year of each figure.
- 4One chart per slidePut source and year under each chart.
- 5Rehearse with notesCut any slide you cannot explain in one sentence.
Slide design rules for farm audiences
Many talks happen in sheds, halls and field days with poor projectors. Design for the back row.
- The University of Illinois Springfield accessibility guide sets a minimum of 18-point text, a sans serif font, and a unique title on every slide.
- The same guide says not to use colour alone for emphasis, and to keep alt text for images to 150 characters or fewer.
- Use units your audience uses: acres and bushels in the US, hectares and tonnes in most other markets.
- Show one idea per slide. If a chart needs a paragraph to explain, split it into two slides.
Where to find data for your slides
- US farm statistics: USDA NASS reports and the Quick Stats database (yields, prices, technology use).
- Adoption and costs: USDA ERS reports on precision agriculture.
- Global crop and land data: FAOSTAT from FAO.
- Satellite images: Copernicus (Sentinel) and USGS EarthExplorer (Landsat). Check each provider’s licence before you publish screenshots.
- Rules: the FAA for drones, and your state or national pesticide regulator for spray products.
If you coordinate field teams across many farms, Farmonaut also has an admin app for agribusinesses, and developers can read the satellite and weather API documentation.
How we checked the numbers
Every figure on this page comes from a public document we opened in October 2026: the NASS Technology Use reports (2015 to 2025 editions), the NASS 2023 Irrigation and Water Management Survey table, the ERS report EIB-248 (February 2023), the GAO report GAO-24-105962 (January 2024), the UN population page (WPP 2024), the FAO climate-smart agriculture sourcebook summary (2013), and mission pages from ESA, NASA and the FAA. Survey figures are estimates with sampling error. Where a source counts farms rather than acres, we say so.
FAQ
What should a smart agriculture PPT include?
The problem (food demand and climate), a clear definition, the main tools, adoption data, costs and returns, barriers, and a source slide. The 12-slide outline above covers each of these with a dated fact.
How many slides should a smart agriculture presentation have?
For a 15 to 20 minute talk, 10 to 12 content slides is a workable range at one to two minutes each. Cut slides rather than speed up.
What is the difference between smart agriculture and precision agriculture?
Precision agriculture manages each part of a field by its needs, with tools like guidance, yield maps and variable rate. Smart or digital agriculture is wider and also covers connected sensors, farm software and data sharing. Climate-smart agriculture is an FAO approach with three pillars: productivity, adaptation and emission cuts.
What share of US farms use precision agriculture?
22% of US farms in 2025, according to USDA NASS, down from 27% in 2023. The share varies widely by state, from 14% in Texas to 50% in North Dakota among the states NASS reports, and USDA ERS finds that larger row-crop farms adopt these tools at higher rates.
Can I use satellite images in a presentation?
Yes. NASA says standard Landsat data products are available at no cost to users, and Sentinel-2 images are published through the EU Copernicus programme. Check each provider’s licence and credit line before you share the slides.
Are drones legal for crop spraying?
In the US, yes, with the right approvals. The FAA requires a Part 137 certificate, exemptions, a Remote Pilot Certificate and a registered drone. Your state pesticide agency may also require an applicator licence. Other countries have their own rules. Always follow the product label and local rules.
Farmonaut crop monitoring
Get satellite crop maps for your own slides
Farmonaut shows vegetation index maps of your own fields, which you can use as real examples in a smart farming talk.



Keep reading
Sources
- USDA NASS, Technology Use (Farm Computer Usage and Ownership), August 2025: esmis.nal.usda.gov
- USDA NASS, Technology Use, August 2023: esmis.nal.usda.gov
- USDA NASS, Farm Computer Usage and Ownership, August 2021: esmis.nal.usda.gov
- USDA NASS, Farm Computer Usage and Ownership, August 2019: esmis.nal.usda.gov
- USDA NASS, Farm Computer Usage and Ownership, August 2017 (corrected): esmis.nal.usda.gov
- USDA NASS, Farm Computer Usage and Ownership, August 2015: esmis.nal.usda.gov
- USDA NASS, 2023 Irrigation and Water Management Survey, Table 25: data.nass.usda.gov
- USDA ERS, Precision Agriculture in the Digital Era: Recent Adoption on U.S. Farms, EIB-248 (2023), report page: ers.usda.gov
- USDA ERS, EIB-248 full report PDF (2023): ers.usda.gov
- US GAO, Precision Agriculture: Benefits and Challenges for Technology Adoption and Use, GAO-24-105962 (2024): gao.gov
- United Nations, Global issues: Population (World Population Prospects 2024): un.org
- FAO, Climate-Smart Agriculture Sourcebook, executive summary (2013): openknowledge.fao.org
- ESA, Sentinel-2 mission page: esa.int
- NASA Science, Landsat 9 mission page: science.nasa.gov
- FAA, Dispensing Chemicals and Agricultural Products (Part 137) with UAS: faa.gov
- University of Illinois Springfield, Microsoft PowerPoint accessibility: uis.edu
Discussion
Questions, corrections or field experience? Share them below. First-time comments are reviewed before they appear, and your email is never published.
No comments yet. Be the first to add a question or your experience.

 Innomick
 Juligerm
 AdBio
AdBio MISE Maroc
 Drift-Sense
 NWNS
NWNS Red August Group
 Farm Inc
 WeMe Global
 Agrotoken
 Blue BearX
 Insignito
 Croptimum
 DnCubed
 Field Capacity
 Indosistim Teknologi
 Liquify Digital
 Licence holder · Niger · Gold
 Licence holder · Nigeria · Gold + lithium










