

Blueberry farming rewards close attention, and a Florida grower knew what satellite monitoring could do for a berry crop. So when a grower in the foothills of the Romanian Carpathians went looking for answers, the introduction crossed the Atlantic. A 10.9-hectare plantation has now been watched from orbit through a full growing season.
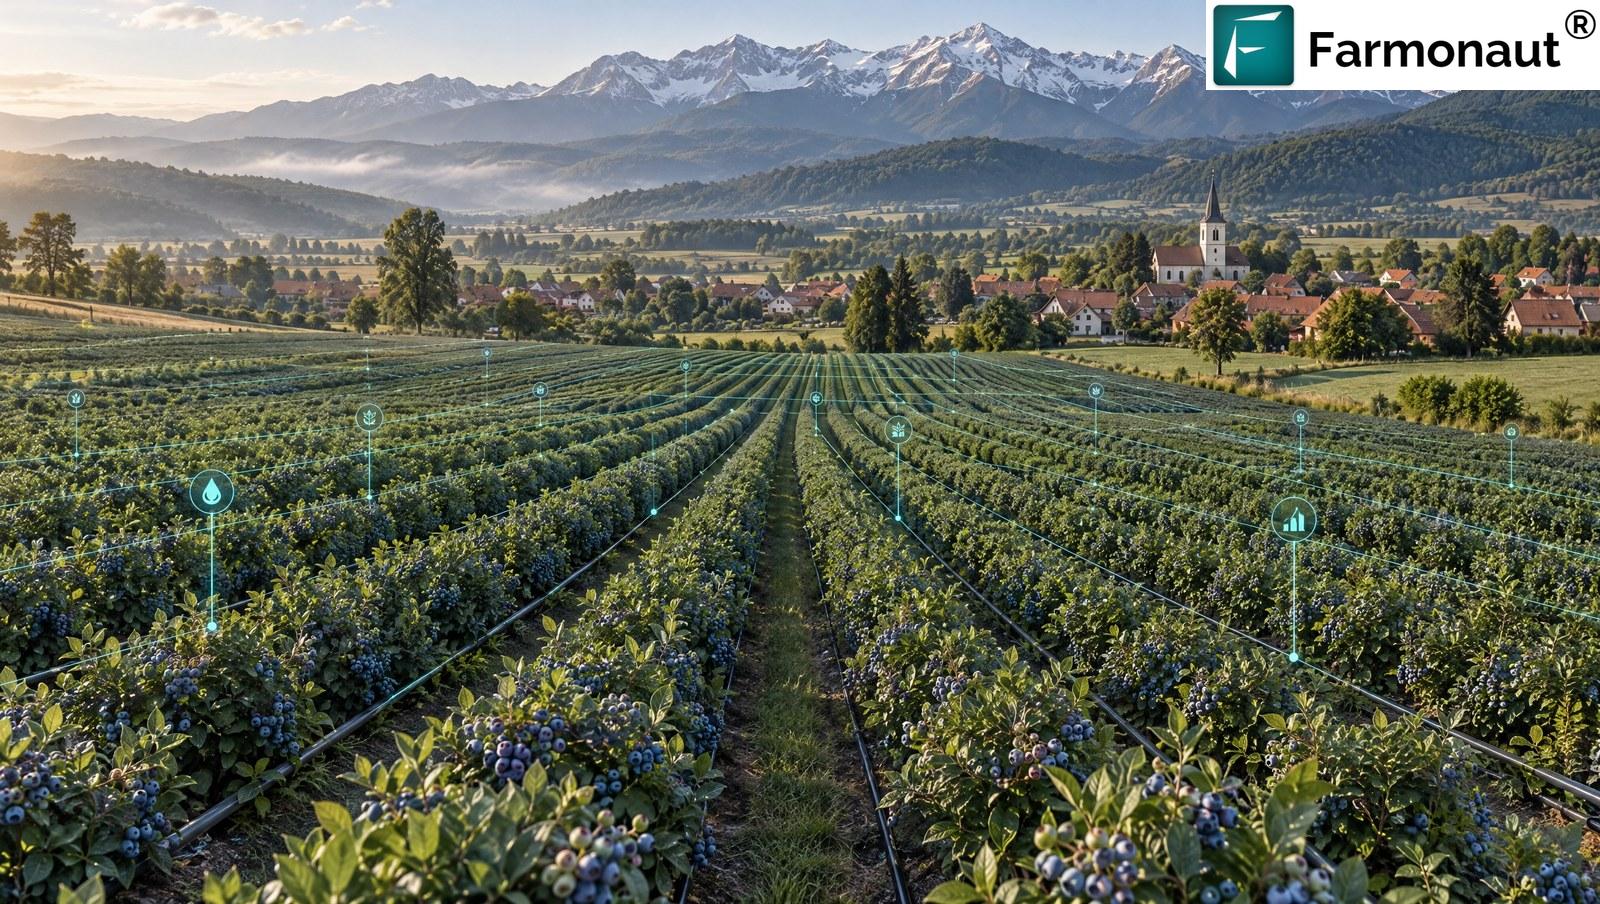
The most trusted recommendation in blueberry farming is another farmer. A grower who has run a tool for a season and kept it is worth more than any brochure. This story begins with exactly that: one blueberry grower telling another, across 9,000 kilometres and an ocean, that satellite monitoring is worth putting on the ground.
The first grower runs a large blueberry operation in Citrus County, Florida. They already use the Farmonaut Satellite + AI Farm Monitoring System across 25 blocks, and our published Florida blueberry case study describes what it delivers for them. It is one layer of precision agriculture, and it works alongside farm management software. As a Farmonaut affiliate partner they hold a personal promo code, and they shared it with a grower in Romania who farms the same crop in a very different place. This is the story of what happened on the Romanian ground.
“A Florida grower recommended it. A Transylvanian plantation put it to work.”
The strongest endorsement for satellite blueberry monitoring is a working grower who recommends it to a peer. This referral did not come from an advert. It came from someone who knows blueberries and trusts what the satellite shows.
A Florida grower’s recommendation crosses the Atlantic
Florida and Transylvania could hardly be more different. One is subtropical, flat and sandy, with a long season and heat as the main enemy. The other is a temperate valley below the Southern Carpathians, with cold winters, spring frost risk and a shorter, sharper season. Yet blueberry is blueberry. Both plantations are made of the same kind of shallow-rooted bush that wants acid soil, steady moisture and a nutrient plan matched to its stage.
That shared crop is what made the referral natural. A grower who has watched their own blocks move through bloom, fruit set and ripening on a satellite map knows what the same maps will show another grower. The Florida grower did not have to explain a new technology. They only had to say that it worked, and give their code.
The Romanian grower placed their first order on 13 April 2026, and satellite coverage of the plantation began the day before. From then until mid-September the block was looked at, read and recorded through the whole of the growing season.
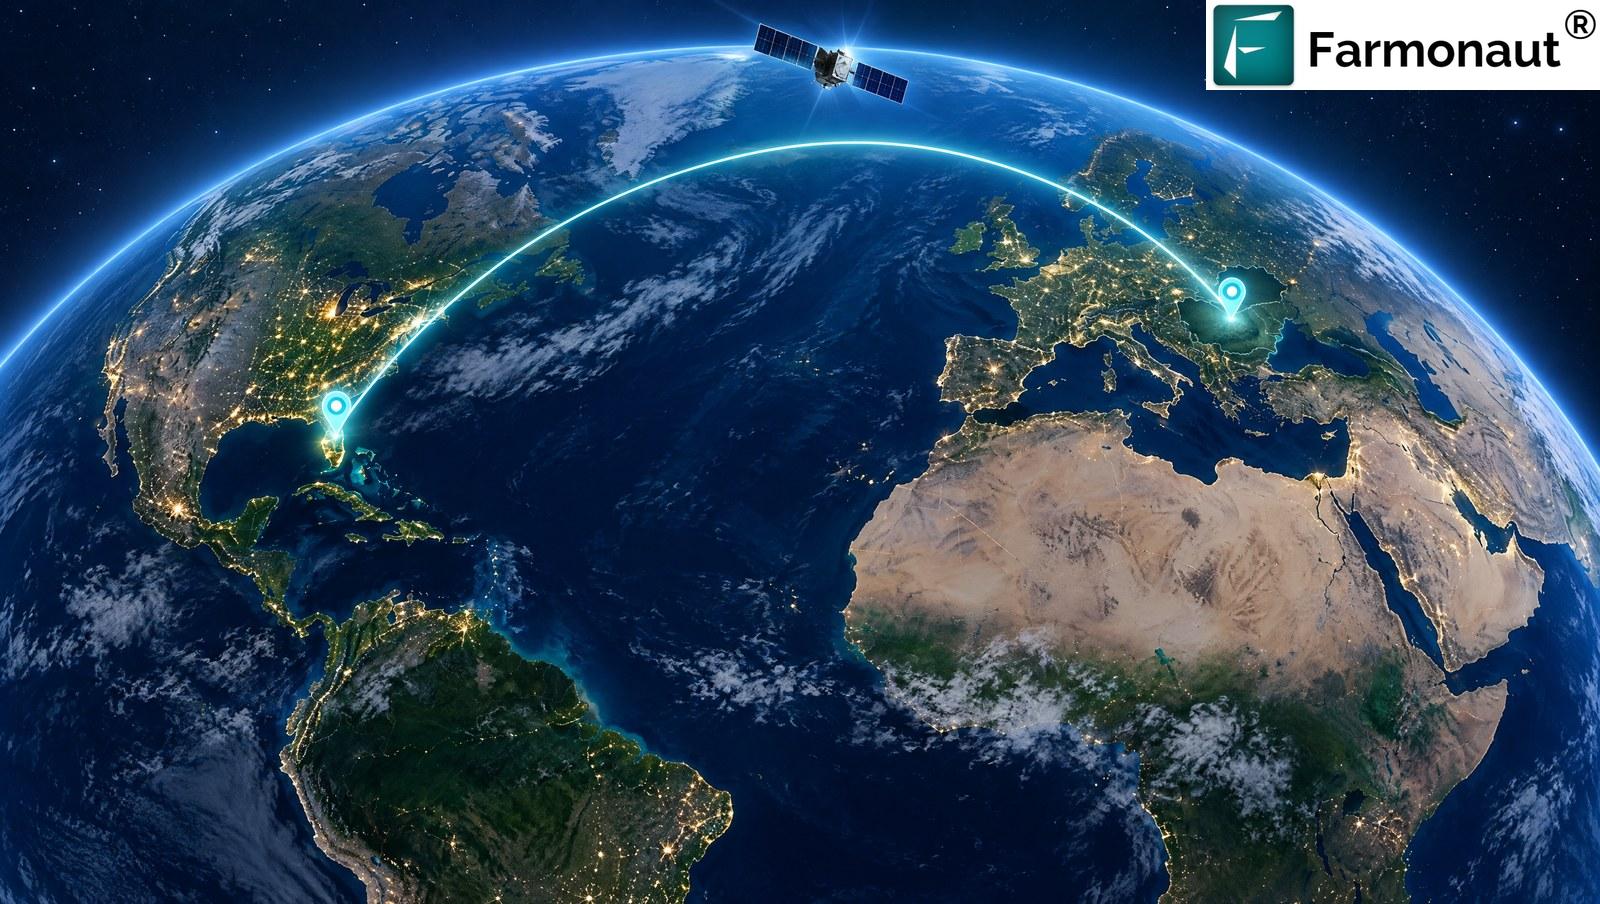
Two climates, one crop: blueberry farming in Florida and Transylvania
It is worth setting the two plantations side by side, because the contrast is the point. The crop is the same. The conditions are not, and the satellite system adapts to both.
| Florida (the referring grower) | Transylvania (the referred grower) | |
|---|---|---|
| Climate | Subtropical, long warm season | Temperate, cold winters, shorter season |
| Main stress | Heat and water management | Spring frost, summer dry spells |
| Soil | Sandy, naturally acid, needs steady water | Acid-managed soils below the Carpathians |
| Typical harvest window | Spring | Summer |
| Monitoring | 25 blocks, 124 acres | 1 block, 10.9 hectares |
| System | Farmonaut Satellite + AI | Farmonaut Satellite + AI |
A tool that reads vigour, moisture and weather works the same way in both places. What changes is what the grower does with the reading. In Florida the question is often how to keep the bush cool and watered. In Transylvania it is how to protect early growth from a late frost and how to carry the crop through a dry July.
The Romanian plantation at a glance
The account covers a single large block of highbush blueberries in the commune of Viștea, in Brașov County, at the foot of the Făgăraș Mountains. The block is 10.9 hectares, about 27 acres, and the planting record dates from December 2020, which makes it a mature, fully productive plantation rather than a young one finding its feet.
| Detail | Record |
|---|---|
| Crop | Highbush blueberry |
| Block size | 10.9 hectares (about 27 acres) |
| Location | Viștea commune, Brașov County, Transylvania, Romania |
| Recorded planting | December 2020 |
| First order | 13 April 2026 |
| Satellite coverage | 12 April to 14 September 2026 |
| Optical satellite looks | 38 (14 of them under cloud) |
| Radar passes | 44 |
| Daily weather records | 38 |
| Indices calculated per look | 15 |
That chart tells a quiet story. Even in a season with 14 cloudy optical passes, the block was never left unwatched. Radar filled the gaps, so the grower always had a current reading. For a crop with a short, high-value harvest window, that continuity matters more than any single image.
Setting up a block in five steps
- Open the web app and choose to add a field.
- Draw the boundary around the block on the satellite map, or import one you already hold.
- Set the crop to blueberry and enter the planting date.
- Read the first map as soon as the next satellite pass arrives.
- Check back every few days. The record builds itself.
For a single large block like this one, the whole set-up takes minutes. There is no hardware to fit and nothing to maintain in the field. The grower only needs a phone, a tablet or a laptop.
Why blueberry farming rewards close watching
Blueberry is a demanding crop, and the demands change fast. The plant has shallow, fine roots that cannot reach far for water. It wants acid soil, usually in the range of pH 4.5 to 5.5, and it is sensitive to both too little and too much moisture. Nutrient needs move through the season, from bud break to bloom, fruit set, ripening and the build-up of reserves after harvest. A programme that is right in May can be wrong in July.
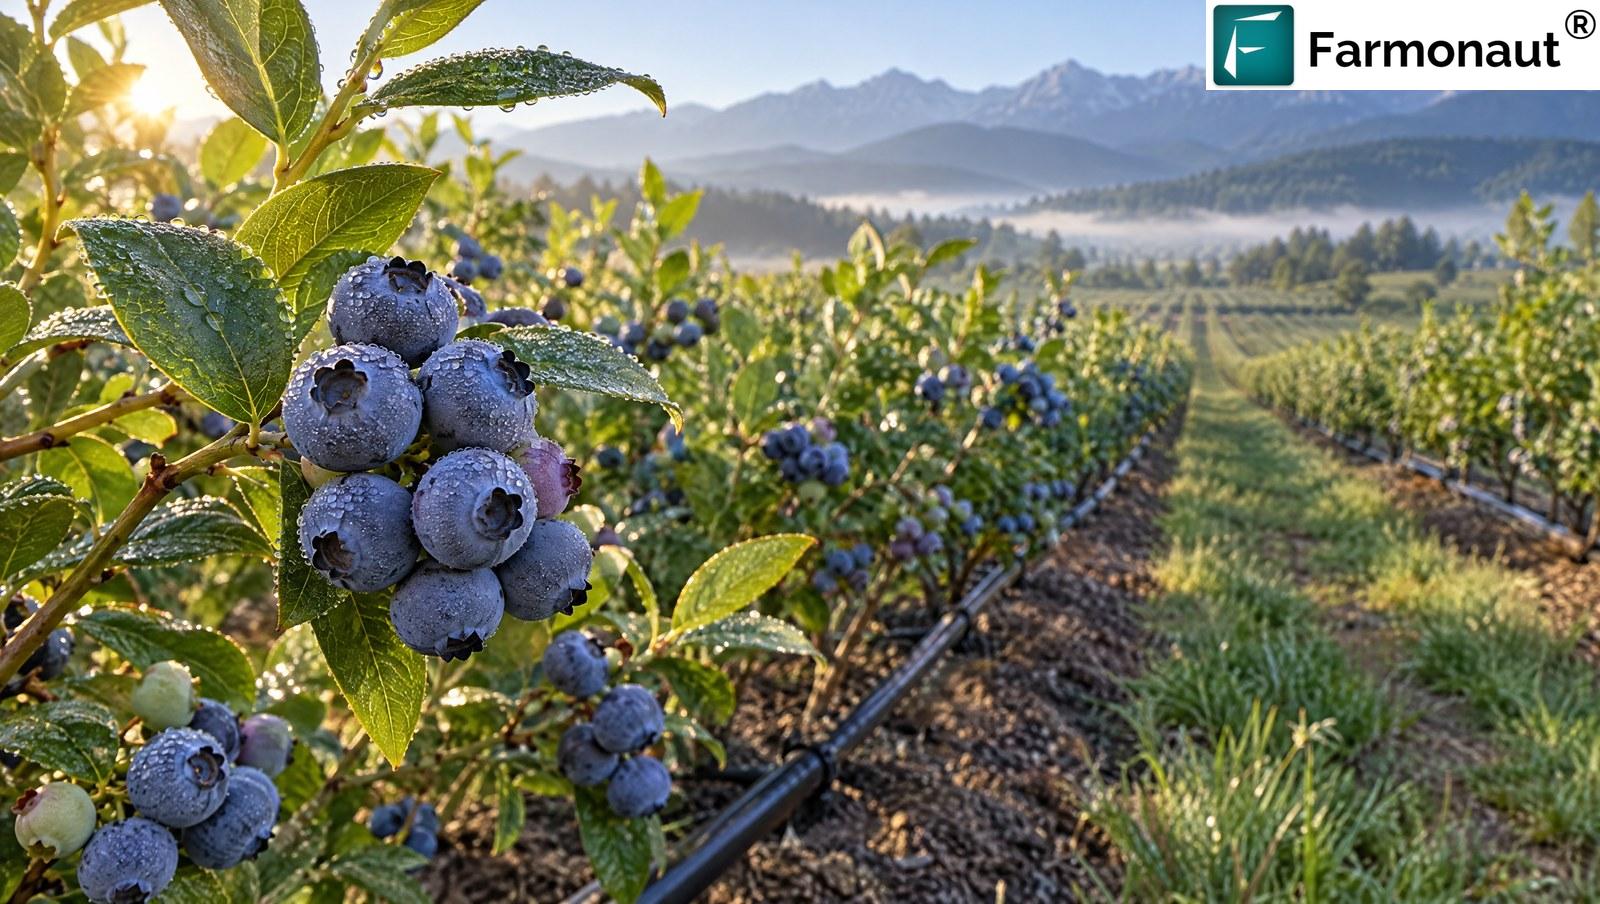
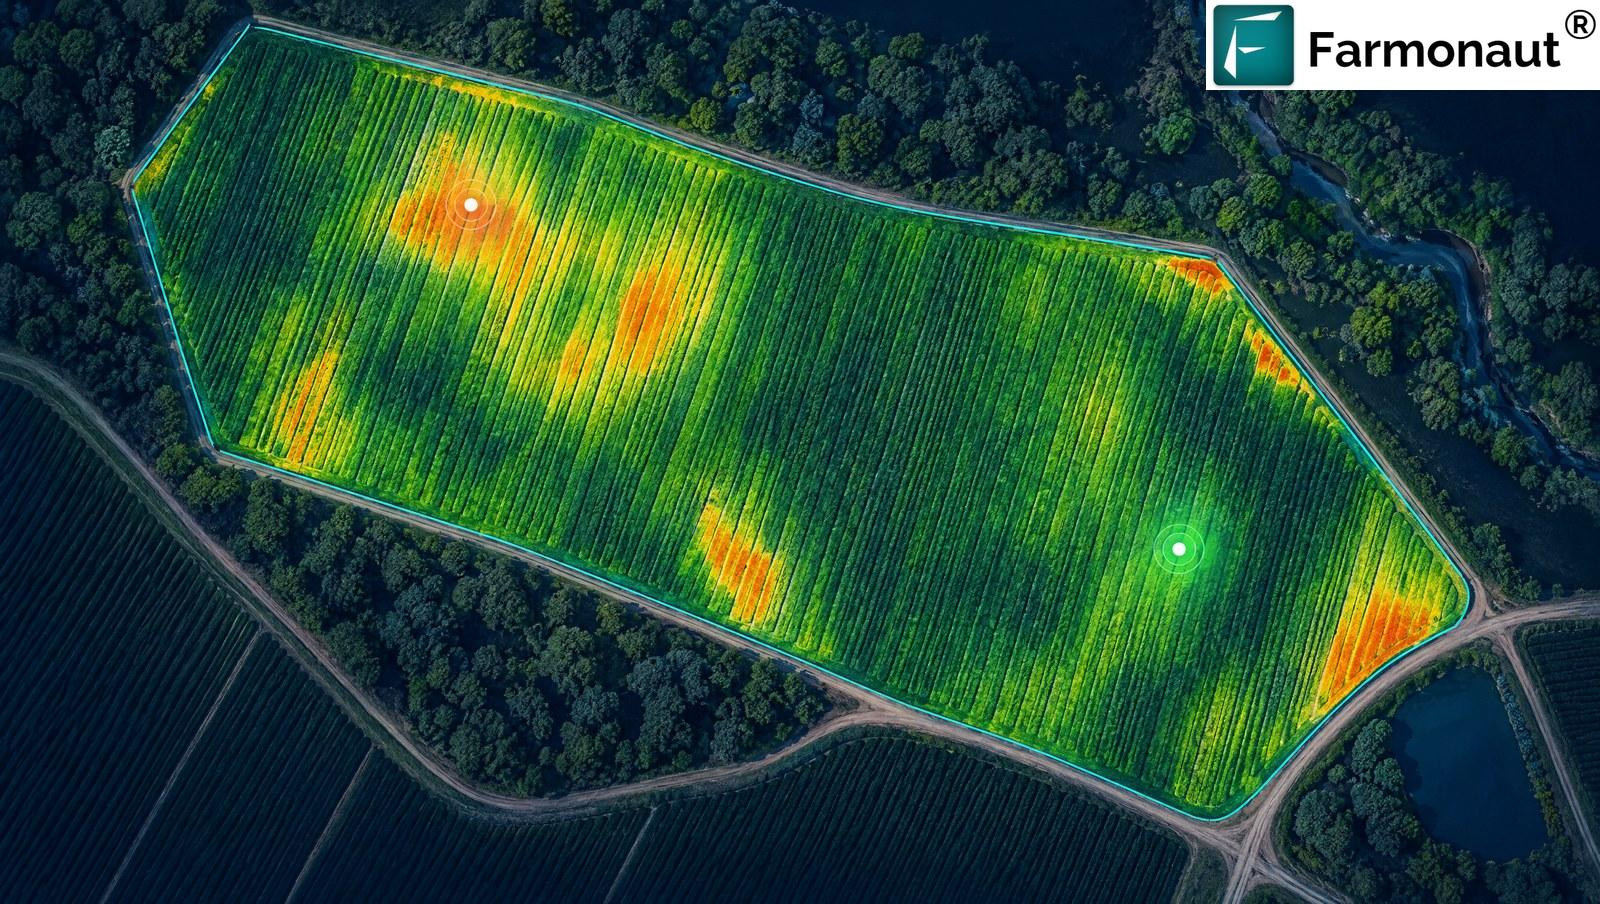
Because the roots are shallow and the crop is high in value, small gaps in water or nutrition show up in the fruit. That is exactly what a satellite is good at spotting. Vegetation indices pick up uneven vigour across a 10-hectare block weeks before the eye does, and moisture indices show which rows are drying first. The grower does not have to walk every row to know where to start.
On a plantation this size, ask the map one question first: which part of the block is behind its neighbours? Walk that corner, check the soil moisture and the drip line, and you will often find the cause within minutes.
What a drip line cannot tell you
Drip irrigation is efficient, but it hides problems. A blocked emitter or a pressure drop at the end of a line does not show on the surface. It shows in the bush, as slower growth and smaller berries, and by then the damage is done. A satellite sees the whole block at once, so a strip of weaker canopy that follows an irrigation line is a clear flag that something at the source needs a look.
Weather and canopy, side by side
In a valley below the Carpathians the weather is part of the crop plan. A late spring frost can damage blossom. A hot, dry July stresses shallow roots. A summer storm can bring hail. The Farmonaut system keeps a daily weather record for the block next to the vegetation and moisture readings, so a change in the canopy can be read against the night or the week that caused it.
That pairing is what turns a map into an explanation. A pale strip after a cold night is frost. A pale strip after two dry weeks is moisture. A pale strip that appears with neither is something else, and worth a walk. Knowing which is which saves a grower hours of guessing, and it builds a record of how this particular block responds to this particular weather.
What the satellite sees across a 10.9-hectare block
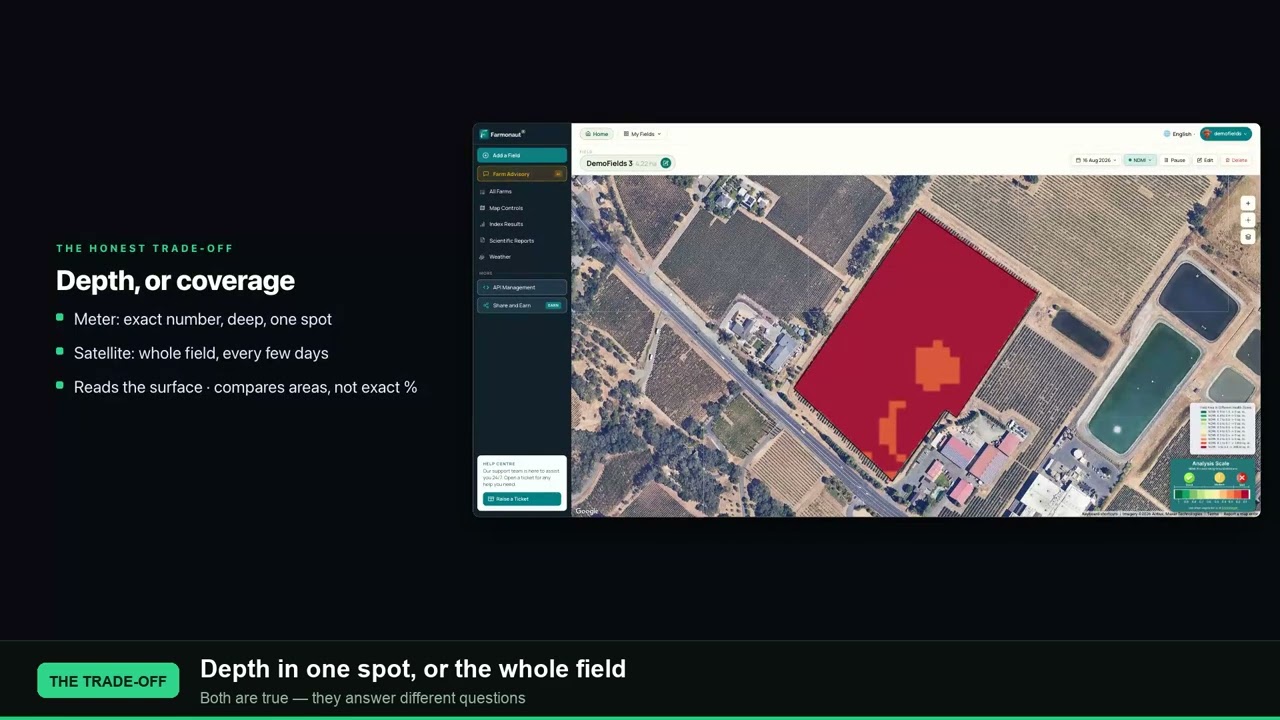
For every look, the Farmonaut system turns raw reflected light into 15 indices (our guide to NDVI versus NDRE explains the two you will see most). For a blueberry grower, these are the ones that matter most.
| Index | The question it answers | Why a blueberry grower cares |
|---|---|---|
| NDVI | How vigorous is the canopy? | Shows uneven growth across rows and blocks |
| NDRE | Is the bush short of nitrogen? | Reads chlorophyll in dense canopy, where NDVI flattens |
| NDMI | Is the canopy holding enough water? | Flags moisture stress on shallow roots early |
| NDWI | Where is there standing water? | Finds wet spots that suffocate roots |
| EVI & SAVI | How healthy is the crop with soil and haze removed? | Cleaner readings where soil shows between rows |
| Soil organic carbon | How rich is the ground? | Helps explain why one part of the block always out-performs another |
Targeted scouting is also greener scouting. When the map shows where a problem is, sprays, water and fertiliser go to the rows that need them, and the rest of the block is left alone. Less input, less runoff, a lighter footprint.
“Fifteen indices, calculated on every look, for every row of the block.”
What the Florida grower reported: same crop, same system
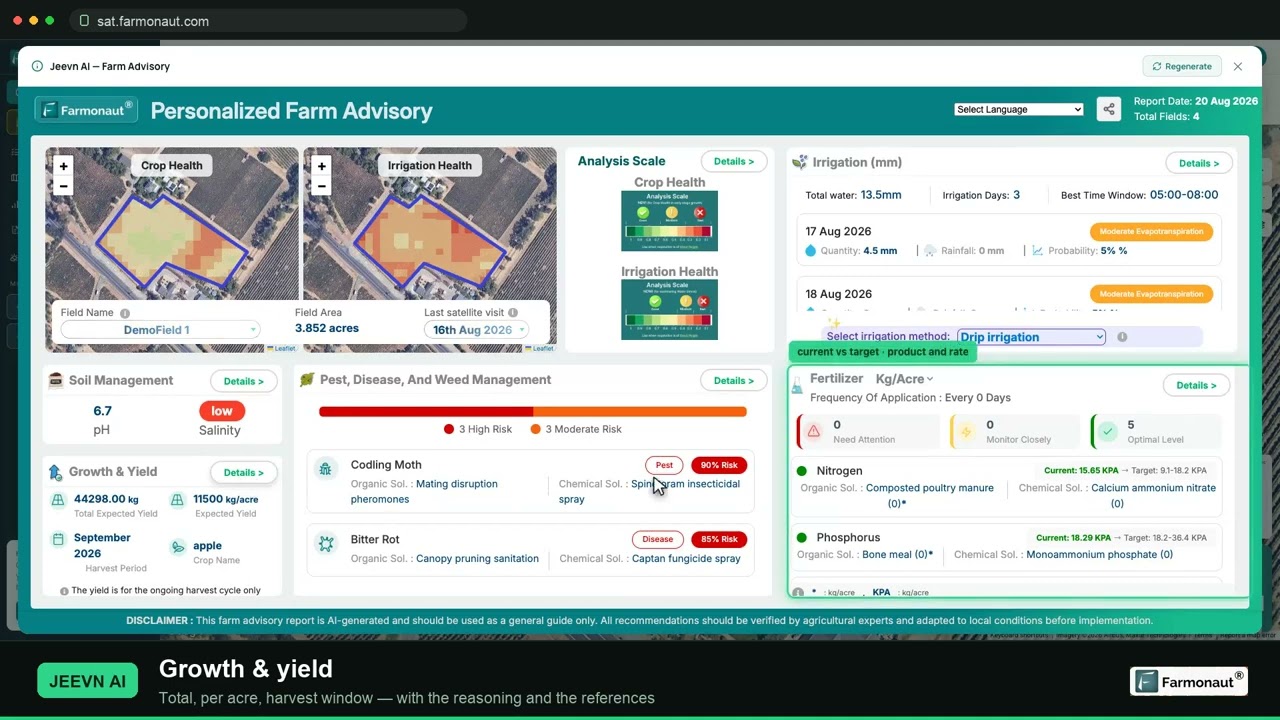
This Romanian grower’s numbers belong to them. But the Florida grower who made the referral has told us what the system did for their blueberries. In our published case study, they reported on our in-app feedback form that the advisory helped them optimise irrigation and fertiliser by 30 to 50 percent across 25 blocks. The same system, the same crop, and a result from a grower who already trusts it enough to recommend it.
Growers in very different countries land in the same bracket, and a grape grower managing 34 plots reported more than 70 percent. For a blueberry plantation, where blueberry fertilizer and water are two of the biggest controllable costs, a 30 to 50 percent improvement in how they are used is a serious number.
What could better water and fertiliser decisions save on your blueberries?
Enter your own block size and spend. The default block is the 10.9 hectares in this story.
- Total spend on water and fertiliser: 21,800
- Saving at 30%: 6,540
- Saving at 50%: 10,900
Illustrative arithmetic, not a forecast or a result for any grower. The spend figure is an editable placeholder, not a quote; replace it with your own costs. The 30 and 50 percent lines mirror the range reported by other growers as their own estimates.
A season of blueberry farming on the dashboard
It helps to picture what a grower sees as the season unfolds. The block was monitored from the middle of April to the middle of September, which covers the full run from early growth to the end of harvest.
Spring: bud break and bloom
In April and May the canopy is waking up. NDVI and EVI show how evenly the bushes are leafing out. A weak strip at this stage might be a drainage problem, a pH issue or winter damage, and it shows on the map while there is time to act. The weather record sits alongside, so a cold night can be read against the canopy it affected.
Early summer: fruit set and swelling
As berries set and swell, moisture is the key. NDMI tracks how well the canopy holds water, and the radar record keeps the picture going through cloudy spells. This is the stretch where a shallow-rooted crop feels any gap in irrigation first, and where an early flag can protect berry size.
Midsummer: ripening and harvest
Ripening is when the block earns its money. The map shows which parts are ahead and which are behind, so picking crews and cold-chain plans can be matched to what is actually ready. Uneven ripening across a 10-hectare block is normal, and seeing it in advance makes scheduling easier.
Late summer: building reserves
After harvest the bush rebuilds the buds that decide next year’s crop. The record to mid-September follows the canopy through that period, giving the grower a baseline to lay over next season’s curve. Every season after this one gets easier to read, because the first is already on file.
Scouting in blueberry farming, with and without a map
Consider what a scouting round looks like on a 10.9-hectare block. Without a map, the grower walks the rows in a pattern, stops at intervals and hopes to catch a problem on the way. Rows are long, bushes are dense, and a problem that sits in one corner may be missed until the next round. With a map, the walk starts at the flagged section, the stops are chosen by the data, and the rest of the block is checked more lightly.
The result is not less scouting but better scouting. The same hours are spent in the places where they find something. Over a season of repeated rounds, that adds up to fewer surprises and faster responses, and it is one of the most common benefits growers describe when they talk about satellite monitoring.
What satellite monitoring can mean for blueberry farming in Transylvania
A blueberry plantation lives or dies by consistency: consistent water, consistent nutrition, consistent berry size. Satellite monitoring does not replace the grower’s eye. It gives that eye a map. The benefits other growers report, and the ones a Romanian plantation can expect from the same tools, come down to five things.
- ✔ Earlier stress flags. Moisture and vigour problems show on the map before they reach the fruit.
- 📊 Smarter inputs. Water and fertiliser go where the map says they are needed, which is where the 30 to 50 percent reported by other growers comes from.
- ✔ Faster scouting. The grower walks the flagged corner, not all 10.9 hectares.
- 📊 Better harvest planning. Seeing ripening patterns in advance helps match crews and storage to the crop.
- ✔ A season-on-season record. Each year’s curve becomes the baseline for the next, so improvements are visible.
Blueberries are a high-value crop, so small percentage gains are large in money terms. A grower who protects berry size on even a part of a 10.9-hectare block is protecting a lot of fruit. That is why monitoring tends to be easy to justify on this crop.
Using the map with a picking crew
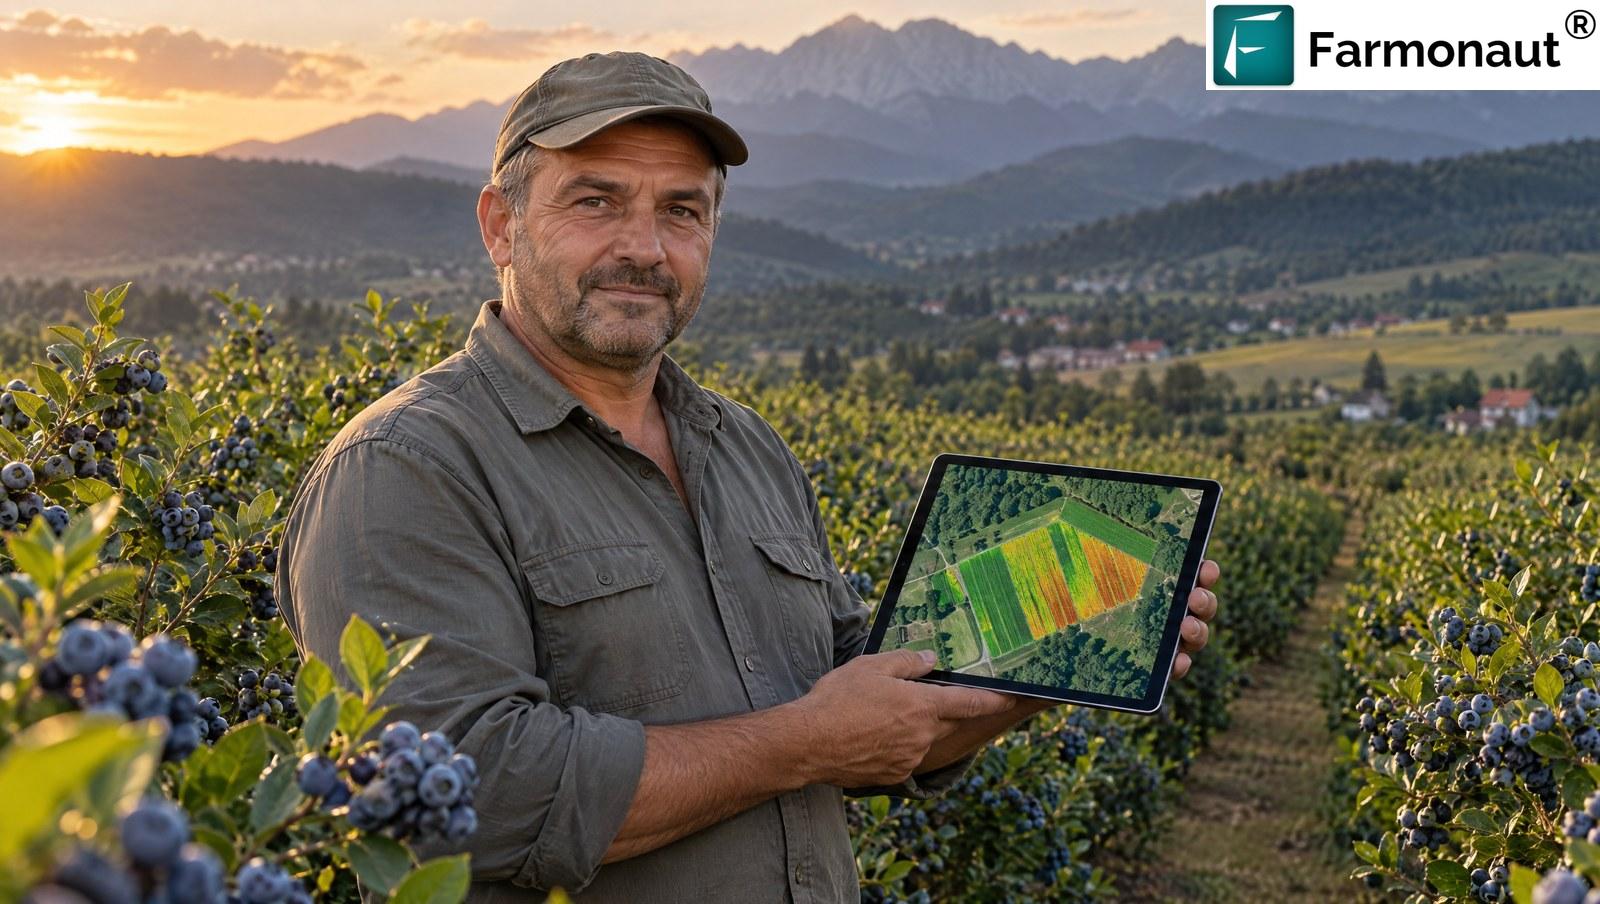
Harvest is where the map pays off most visibly. Blueberries on one block do not ripen at once, and the map shows which sections are ahead. The grower can send the first picking pass where the fruit is ready, plan later passes for the slower sections, and give the cold store a more accurate forecast of what is coming and when. On a block of nearly eleven hectares, that is a meaningful gain in planning, even before any change in input use.
Keep the first season as your baseline. Next spring, open this year’s map beside the new one: the differences are the lessons, and they are already on file.
Why grower-to-grower referrals work
The affiliate programme is built on a simple idea: the best person to introduce satellite monitoring to a grower is a grower who already uses it. A partner shares a personal promo code. Anyone who subscribes with that code is linked back to them. The partner does not need to sell anything. They only need to be honest about what the tool does on their own ground.
The Florida to Romania referral shows how far that can reach. Two growers who will probably never meet in person now share a tool, a crop and a way of reading their land. If you work with growers, advise them, supply them, or are one yourself, the same code and the same conversation are open to you.
- ✔ A working tool, not a promise. You introduce something you can show on your own blocks.
- 📊 Any crop, any country. The same code works for blueberries in Florida and in Transylvania.
- ✔ Your network, your reach. Referrals can cross continents as easily as they cross a fence.
Bring satellite monitoring to your blueberry farming
Map each block, set the crop and get vegetation, moisture and soil readings from your own ground, every few days, in every kind of weather.
More affiliate success stories
- ✔ Corn yield calculator and satellite monitoring: an Illinois case study
- ✔ Mango farming with satellite monitoring in East Java
- ✔ Small scale farming with satellites: five Indian farms
Frequently asked questions
What is satellite blueberry monitoring and how does it help blueberry farming?
It uses images from orbit to measure how vigorous, how thirsty and how well fed a blueberry crop is, block by block. Growers use the maps to scout the right rows, time irrigation and fertiliser, and plan harvest.
Does satellite monitoring work in Romania?
Yes. This 10.9-hectare plantation in Brașov County was looked at 38 times by optical satellite and 44 times by radar between April and September 2026. Radar keeps the record going through cloud.
Why is blueberry farming a good fit for satellite monitoring?
Blueberries have shallow roots, high value and needs that change through the season, so small gaps in water or nutrition show up in fruit size. A map that flags the weakest part of the block early is worth a lot.
What improvements do blueberry growers report?
In our published Florida case study, the grower reported optimising irrigation and fertiliser by 30 to 50 percent across 25 blocks. These are the grower’s own estimates from the in-app feedback form, not metered volumes.
How does a referral work in blueberry farming?
A Farmonaut affiliate partner shares a personal promo code. Growers who subscribe with that code are linked to the partner. To become a partner, contact our team through the link on this page.
Can I monitor several crops or countries on one account?
Yes. One account can hold many fields in different countries, each with its own crop, boundary and record.
Can satellite monitoring help with frost and heat stress?
It shows the effect on the canopy and keeps a daily weather record alongside, so a grower can see which part of the block was hit and how it is recovering. It does not prevent weather, but it shows where to act first.
How long does it take to set up a block?
Minutes. Draw the boundary on the map, set the crop and planting date, and the first reading arrives with the next satellite pass. There is no equipment to install.
Is Farmonaut Satellite + AI free?
No. The Farmonaut Satellite + AI Farm Monitoring System is a paid subscription. Plan details are on the platform.
Glossary
- NDVI
- Normalised Difference Vegetation Index, a satellite measure of how green and vigorous the canopy is.
- NDMI
- Normalised Difference Moisture Index, a measure of how much water the canopy is holding.
- SAR (radar)
- Synthetic aperture radar, a satellite signal that works through cloud and in darkness.
- Highbush blueberry
- The main commercial type of blueberry, a shrub that prefers acid soil and steady moisture.
- Drip irrigation
- Water delivered slowly through emitters along a line beside the row, using less water than overhead systems.
Case-study basis: the Farmonaut platform records for a single account, covering 12 April to 14 September 2026, including the field boundary, crop setting, satellite and radar acquisition dates, weather records and subscription activity. Crop, region, block size and monitoring dates are reported from the account’s own records. The grower is not named and the precise location is withheld. The percentages shown for other growers are those growers’ own estimates from the in-app feedback form, as published in the corresponding Farmonaut customer case studies, and are not metered or independently audited. The savings calculator is illustrative arithmetic with editable placeholders, not a forecast. Individual results vary with crop, weather, soil and management. Satellite indices describe crop condition and do not on their own diagnose a cause. Photographs and scene images in this article are AI-generated illustrations, labelled as such in their captions; they do not depict the grower, their family, their plantation or the Florida operation. The Farmonaut Satellite + AI Farm Monitoring System is a paid product.
Discussion
Questions, corrections or field experience? Share them below. First-time comments are reviewed before they appear, and your email is never published.
No comments yet. Be the first to add a question or your experience.

 Chimera Innovation
 Hiteshi Infotech
 Clubhouse OS
 Progenseed
 SkyHarvest
 Polaris Digitech
 Teledarbas
 Wild Oak Farm
 SFX
SFX BACF Africa
 Doodlakine
 Exurbia Geospatial
 FieldZero
 Indico Company
