

Mining economics · Cost and price guide
Energy Costs in Mining: Share of Gold and Copper Cost
Energy was 15% of Freeport-McMoRan’s copper mine-site operating costs in 2025 (about 17% expected for 2026), and analysts put gold at roughly 20% to 50%. Sourced shares, power use per tonne of copper, and what the 2026 oil spike did to prices.
Key takeaways
- Energy was 15% of Freeport-McMoRan’s copper mine-site operating costs in 2025, and the company expects about 17% in 2026 (Freeport 10-K, filed February 2026).
- Large Chilean copper mines use roughly 5,760 kWh of electricity per tonne of fine copper on the sulphide route, and about 60% of it goes to the concentrator (3,477 kWh) and another 26% to the smelter (1,473 kWh) (Cochilco, 2026; our sum).
- Brent crude averaged US$104.4 a barrel in the second quarter of 2026 against US$69.0 for 2025, yet gold fell from US$4,876 to US$4,268 between the first and third quarters while copper rose to US$14,114 per tonne (World Bank Pink Sheet, 2 October 2026).
- Gold’s average all-in sustaining cost hit a record US$1,785 per ounce in the first quarter of 2026, still about US$3,100 below the quarter’s average price (World Gold Council; World Bank; our subtraction).
- Two calculators test your own numbers: the electricity bill of a copper operation, and the effect of an energy shock on cost and margin per ounce of gold.
In this article
- How much of mining cost is energy?
- Where the electricity goes in a copper operation
- Where the energy goes in a gold mine
- How an energy shock reaches gold and copper prices
- Gold cost per ounce: energy, royalties and the gold price itself
- How miners protect themselves from energy price swings
- What to check before you rely on a cost figure
- Frequently asked questions
Energy is a large but not dominant part of mining cost: Freeport-McMoRan reported that energy made up 15% of its copper mine-site operating costs in 2025 and expects about 17% in 2026, while outside analysts put the gold-mining figure between roughly 20% and 50%, depending on whether indirect energy is counted. For prices, the link is looser than most people assume. Rising fuel and power bills lift what it costs to produce an ounce or a tonne almost at once, but the market price of gold and copper reacts to many other things as well. This page shows the sourced numbers, the stages of a mine that use the most power, and two calculators: one for the electricity bill of a copper operation and one for the effect of an energy shock on cost per ounce of gold.
Terms used below. All-in sustaining cost (AISC) is the World Gold Council’s measure of what it costs to keep a gold mine running, including mine-site costs, sustaining capital, royalties, corporate overhead and closure. C1 cash cost is the copper industry’s measure of direct operating cost per pound, after by-product credits. Grade is the share of metal in the rock. A concentrator is the plant that grinds ore and floats the copper into a concentrate. A smelter melts that concentrate into metal. Brent is the benchmark crude oil price. A megawatt-hour (MWh) is 1,000 kilowatt-hours (kWh). This page gives facts from filings and public data. It is not investment advice.
How much of mining cost is energy?
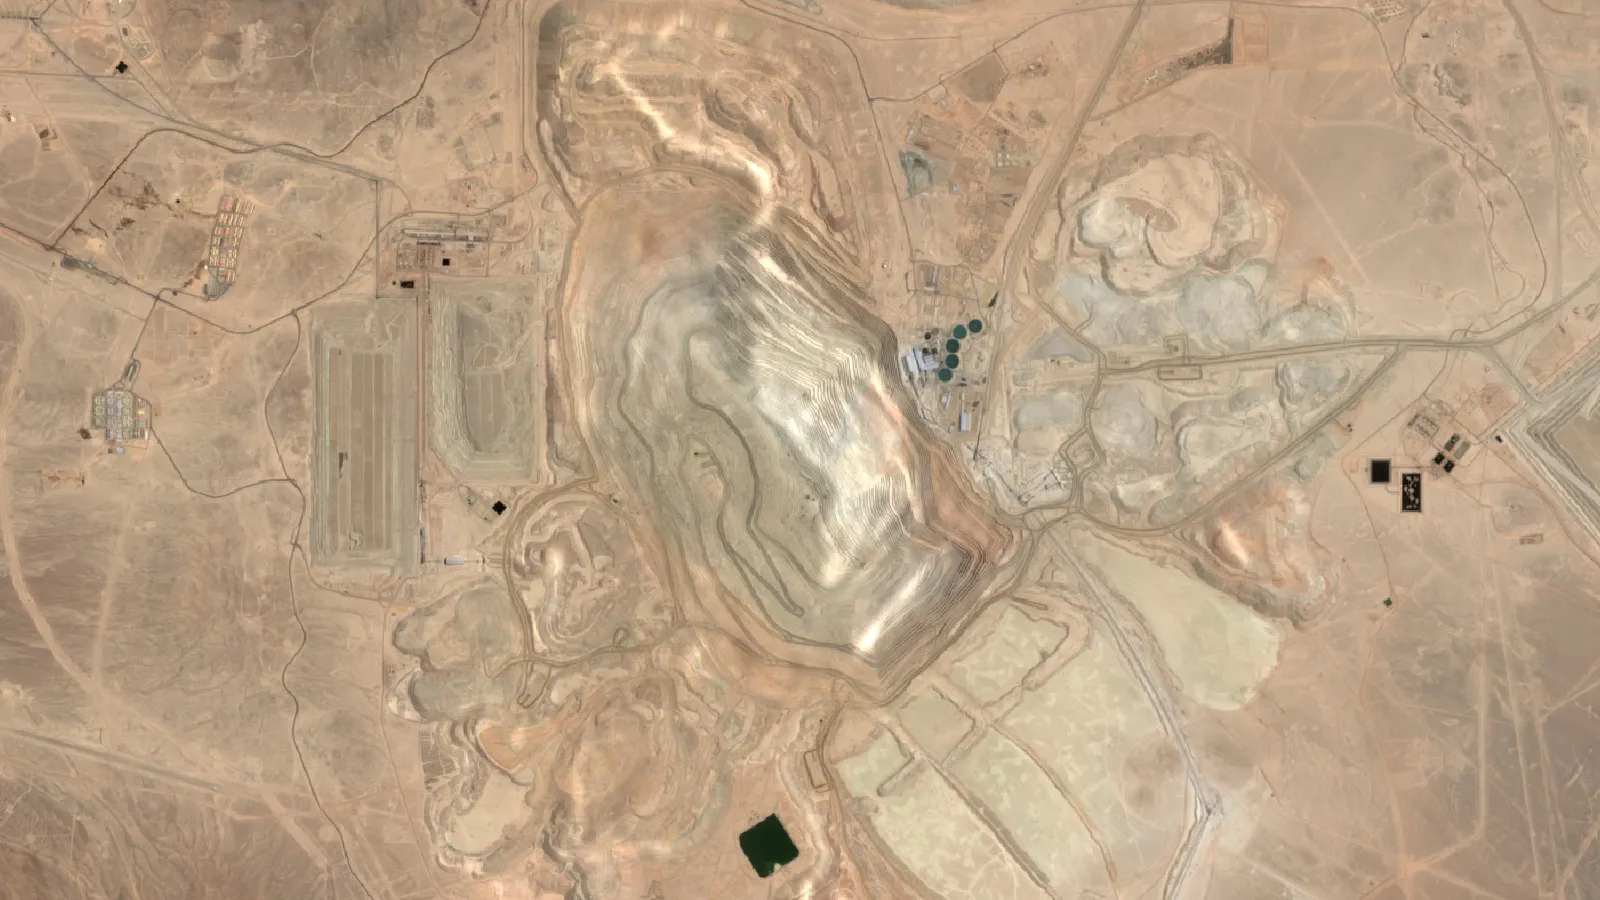
No single figure fits every mine, because each company counts energy differently and each site buys fuel and power on different terms. The best figure is one that a company states in its own filing. Freeport-McMoRan’s annual report is a clear example. It says its copper mining operations bought about 275 million gallons of diesel and about 8,600 gigawatt-hours of electricity in 2025 (the electricity at its US and South American sites), and that energy was 15% of copper mine-site operating costs. The company expects roughly 17% in 2026 on current information. Most of its power is bought under long-term contracts, which slows the effect of a price spike.
Chart
Energy as a share of mining cost, four estimates from different sources
% of cost; bases differ (see source line), so read as a range
Other estimates are higher, and they use different bases. A 2018 study by the investment firm Goldmoney reviewed self-reported data from the 25 largest pure gold producers (18 of them reported to the CDP for 2016) and found that direct energy was around 20% of total operating costs in 2016, with some companies reporting 30% or more when energy was dearer. When it added indirect energy, such as the fuel embedded in steel, explosives, tyres and chemicals, it estimated that about 50% of an average gold miner’s production cost was closely tied to energy prices. That is an analyst’s bottom-up estimate, not a company filing, and it rests on older data than the Freeport figure. A trade-press analysis in Skillings Mining Review in March 2026 put energy at nearly 23% of cash costs for copper miners, without stating its basis.
The chart below shows the two sourced figures: Freeport’s filing and the self-reported gold sample. The bars are not directly comparable, because one is a single copper producer and the other is an older industry sample. The Skillings estimate is left off the chart because it states no basis.
Where the electricity goes in a copper operation
Copper is mined as a low-grade ore. Grade is usually below 1% copper, so a mine must move and grind a very large mass of rock for each tonne of metal. Grinding is the heaviest step. The Chilean Copper Commission (Cochilco) publishes unit electricity use for large Chilean mines, and it shows the concentrator, the plant that grinds and floats the ore, using far more power than the pit itself. The chart gives Cochilco’s 2025 figures in kilowatt-hours per tonne of fine copper.
Chart
Electricity use per tonne of fine copper, by process
kWh per tonne of fine copper; large Chilean mines, 2025 unit values
These steps do not all happen at one site. A mine that makes concentrate sends it to a smelter, often at another location. Mines that leach oxide ore and recover copper by solvent extraction and electrowinning (SX-EW) skip the concentrator and smelter but still use power in the leach and plating stages (3,772 kWh per tonne in Cochilco’s table). Adding the open-pit, concentrator, smelter, refinery and services figures gives about 5,760 kWh for each tonne of copper made by the sulphide route. As a cross-check, Cochilco projects 27.6 terawatt-hours of electricity use by Chilean copper mining in 2025. Chile mined an estimated 5,300 thousand tonnes of copper in 2025, according to the US Geological Survey, so the sector averages roughly 5.2 MWh per tonne on our rough division. The two views agree to within roughly 10%.
The same Cochilco projection shows demand rising faster than output. Electricity use is forecast to grow 20.2% between 2025 and 2034, to 33.2 terawatt-hours, while copper output grows 8.3%. The reasons are lower ore grades, more sulphide ore that needs a concentrator, and more seawater desalination and pumping. Desalination grows by 60.6% in the forecast, according to the same report. For a copper producer, a power contract is therefore a long-term cost decision, not a line that moves with each month’s oil price.
Fuel moves with oil more directly. Cochilco’s cost study for 2024 against 2023 shows how the two energy lines act. The commission said a fall of 11% in the diesel price and 12% in the electricity price each trimmed the net cash cost of large Chilean copper mines by 2.1 US cents per pound. The total C1 fell from 192.1 to 184.9 US cents per pound. Its report for 2025, as summarised in the Chilean trade press, found the average net cost still near US$1.8 per pound, with electricity, fuel and third-party services among the items that rose, offset by higher by-product credits and lower smelting charges.
Calculator
What is the power bill of a copper operation?
Enter your own output, power use and prices.
- Power cost per tonne of copper: $461
- Power cost in US cents per pound: 20.9 cents
- Share of the copper price: 3.1%
- Power cost vs net cash cost (rough guide only): 11.6%
- Extra cost per year if power price changes: $11,524,000
Example values only, not a benchmark. Default power use, 5,762 kWh per tonne, is our sum of Cochilco’s 2025 unit values for large Chilean mines (open pit 201, concentrator 3,477, smelter 1,473, refinery 384, services 227); your site will differ. Power price, copper price and cash cost are inputs: example, use today’s price. LME copper cash settlement was US$14,751 per tonne on 14 October 2026 (Westmetall). Net cash cost default of US$1.80 per pound is the rough Chilean large-mine level for 2025 reported from Cochilco. Amounts in US dollars. Electricity only; diesel, other energy and indirect effects are not included. The net cash cost comparison is a rough guide: the power figure includes smelter and refinery power, while C1 net cash cost is net of by-products and excludes some smelting charges, so the bases differ.
Where the energy goes in a gold mine
A gold operation uses the same building blocks, in different proportions. Open-pit mines burn diesel in haul trucks and shovels. Underground mines use electricity for ventilation, cooling and hoisting. Both grind ore, and most then dissolve the gold in a cyanide solution and capture it on carbon, a step that needs pumping and agitation. The final stages melt and refine the gold. Our short video follows a clay nugget through those stages, from drilling to the refined bar.

▶ Follows a clay gold nugget through drilling, crushing, dissolving, capture on carbon, melting and refining. · 5:27
A World Gold Council climate study from 2019 estimated the origin of emissions across the gold supply chain. It put purchased electricity at about 40-45% and diesel and other fuel combustion at about 30-35% of the industry’s greenhouse-gas emissions. Emissions are not the same thing as cost, but they show that both power and fuel matter and that the mix differs a lot by site. A mine on a hydro grid has a different risk from a remote mine that trucks in diesel or runs its own generators. Newmont’s annual filing describes its main energy sources as purchased electricity, diesel fuel, heavy fuel oil and natural gas, and lists a sharp rise in diesel and gas prices as a risk.
Gold ore is graded in grams per tonne, not per cent, so the rock moved for each ounce is large. That is why energy shows up in cost per ounce, and why a mine with lower grade or a deeper pit is more exposed. Energy is also not the only cost that moves. The World Gold Council reported that the industry’s AISC reached a record US$1,785 an ounce in the first quarter of 2026, up 5% from the previous quarter and 16% from a year earlier, with royalties and corporate overheads named as the main drivers. It added that the first signs of higher energy prices from the Middle East conflict were seen at some operations in that quarter, with a greater effect expected in the second quarter and beyond.
How an energy shock reaches gold and copper prices
There are four routes from an energy price rise to a metal price, and they work at different speeds.
Chart
Brent crude, copper and gold, indexed to Q3 2025 = 100
Quarterly averages, Q3 2025 to Q3 2026; index values calculated by us from the World Bank series
- Cost first. Diesel and power are paid for within weeks, so cash cost per unit rises quickly at mines that buy at spot. Mines with long-term power contracts see the change later.
- Supply second. Higher costs squeeze the weakest mines and delay new projects. That cuts supply months or years later, which matters most for copper because new mines take a long time to build.
- Inflation and the safe-haven effect. An energy shock raises inflation fears, and investors sometimes buy gold as a store of value. This works through sentiment and interest rates, not through mining cost.
- Demand last. Very high energy prices slow industrial activity, which can cut demand for copper even while supply is tight.
The data from the past year shows how mixed the result is. The World Bank’s Commodity Markets Outlook of April 2026 said that energy prices were projected to surge by 24% in 2026, to their highest level since 2022, after shipping disruption in the Strait of Hormuz, which handles about 35% of seaborne crude oil trade. The World Bank’s October 2026 Pink Sheet then recorded Brent crude averaging US$104.4 a barrel in the second quarter of 2026 and US$97.1 in the third, against US$69.0 for 2025 as a whole. Copper (LME) averaged US$14,114 per tonne in the third quarter, against US$9,947 for 2025. Gold averaged US$4,268 per ounce in the third quarter, up from US$3,442 in 2025 but down from the first-quarter peak of US$4,876.
The chart indexes the three series to the third quarter of 2025. Copper rose in every quarter shown. Oil peaked in the second quarter of 2026. Gold peaked earlier, in the first quarter, and then fell while oil climbed. On our arithmetic, from the first to the third quarter of 2026, Brent rose 21%, copper rose 10% and gold fell 12%. Five data points cannot prove a cause, and copper has its own demand and supply story. What the numbers do show is that an energy price spike does not move gold in a straight line.
The longer record points the same way. Brent averaged US$82.6 in 2023 and US$69.0 in 2025, so oil was cheaper, yet gold rose from US$1,943 to US$3,442 (+77%, our arithmetic) and copper from US$8,490 to US$9,947 (+17%), on the same World Bank data. Goldmoney’s 2018 econometric work found that a 1% change in longer-dated oil prices went with about a 0.5% move in gold over its sample, with real interest rates as the other main driver. That is one analyst model and an older sample, so treat it as a hypothesis rather than a rule.
Gold cost per ounce: energy, royalties and the gold price itself
For gold, the cost-to-price link also runs the other way. When the gold price rises, royalties rise with it, and companies often spend more on sustaining capital. Barrick reported an AISC of US$1,637 per ounce for 2025 and guided to a range of US$1,760 to US$1,950 for 2026. It said that about US$60 per ounce of the increase came from using a gold price assumption of US$4,500 per ounce, which feeds royalties, and gave other reasons for the rest, including slightly higher sustaining capital per ounce, in its 2025 annual report.
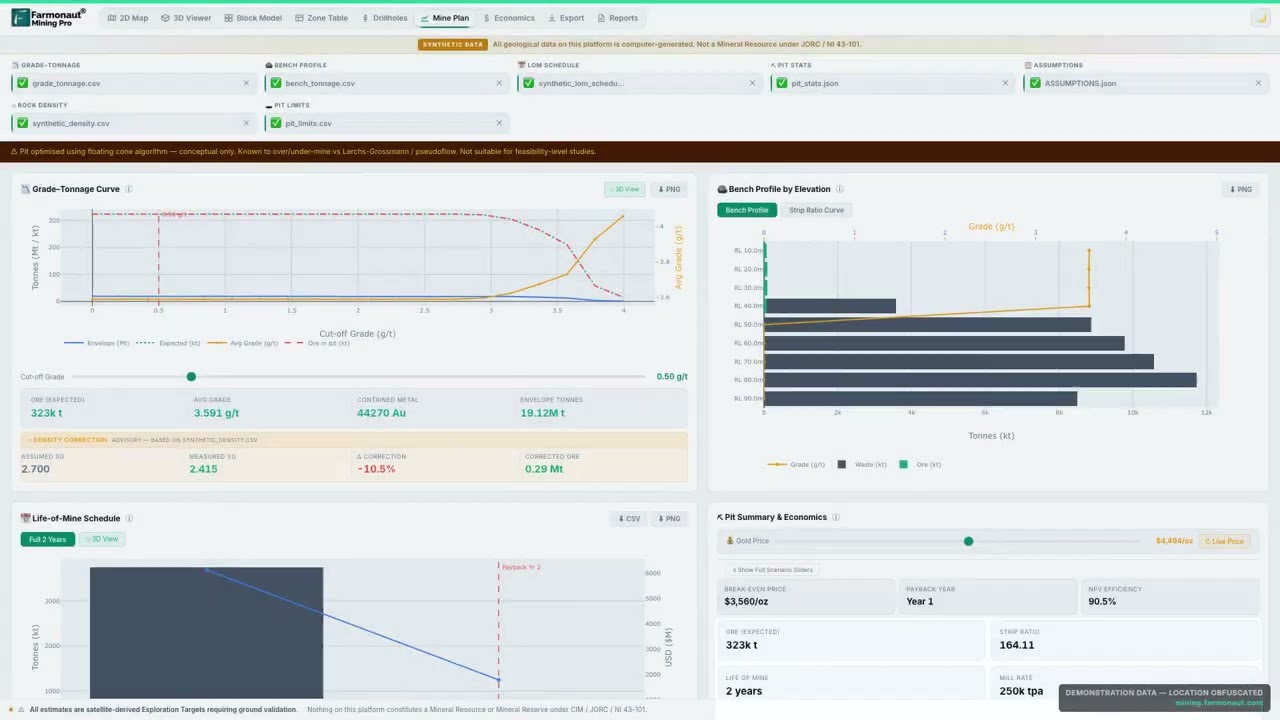
▶ Mine plan part 2: all-in sustaining cost per ounce, break-even price, net present value and payback, with the pit engineering parameters behind them. · 14:58
This matters for the idea that mining cost sets a floor under gold. The industry’s average AISC in the first quarter of 2026 was US$1,785 per ounce. Gold averaged US$4,876 in that quarter on the World Bank series, so the average gap was about US$3,100 per ounce (our subtraction). When the gap is that wide, a 20% jump in fuel and power cost does not push many mines near break-even. It matters most for high-cost mines, for companies that sold production forward at lower prices, and for projects whose economics were set at a much lower gold price. The calculator lets you test your own numbers.
Calculator
What does an energy shock do to cost per ounce?
Enter your own cost, energy share and price.
- Added cost per ounce: $89
- Rise in total cost per ounce: 5.0%
- Margin per ounce before the shock: $2,365
- Margin per ounce after the shock: $2,276
- Added cost per year at your output: $26,775,000
Example values only, not a benchmark. Default cost, US$1,785 per ounce, is the World Gold Council industry average AISC for the first quarter of 2026. The 20% energy share is an example based on Goldmoney’s 2018 study of direct energy in operating costs (2016 data); AISC also includes royalties and sustaining capital, so energy is usually a smaller share of AISC than of operating cost, and indirect effects are not modelled. Gold price is an input: example, use today’s price (Kitco spot bid was US$4,157.70 per ounce on 15 October 2026). Hedges, grade and by-product credits are ignored. Amounts in US dollars.
How miners protect themselves from energy price swings
Companies use five main tools. None removes the risk, and each has a cost.
- Long-term power contracts. Freeport buys most of its electricity under long-term contracts and discloses take-or-pay commitments of about US$0.2 billion for electricity at the end of 2025. A take-or-pay contract obliges the buyer to pay for the power whether or not it is used.
- On-site generation and renewables. Cochilco expects almost all contracted electricity for Chilean copper mining to come from renewable sources by 2030, which would reduce exposure to fuel prices and emissions at the same time.
- Electric and battery equipment. The World Gold Council’s climate study describes battery-powered underground equipment at a Canadian gold mine, which it says brings lower operating and ventilation costs.
- Fuel hedges. Miners can fix a diesel price for a period, though a hedge that is too long can leave a company paying above the market if oil falls.
- Site choice. Distance from the grid, road haulage of diesel and altitude all change the energy bill. They are known before the first drill hole, which is why access and power appear in early project screening.
Our guide to copper deposit types and top producing countries shows why copper mines differ so much in power use, and our page on porphyry copper deposits explains the large, low-grade deposits that make up most copper supply. For gold, see the guide to gold deposit types and prospecting methods. By-product credits from gold, silver and molybdenum lower the reported cost of copper mines, and our overview of silver mining supply and demand trends covers the silver side of that picture.
What to check before you rely on a cost figure
Whether you hold a mining licence, run a company or invest in one, a handful of questions separate a sound cost estimate from a headline number.
- What does the energy percentage include? Direct fuel and power, or also the steel, explosives and reagents that depend on energy? The answer can change the figure from about 15% to about 50%.
- What is the cost basis? AISC includes royalties and sustaining capital, so energy is a smaller share of it than of mine-site operating cost. C1 is net of by-products.
- How is power bought? A long-term contract, a spot grid price, or an own generator on diesel. This sets how fast a shock arrives.
- Where is the date? An energy share from 2016 or 2018 can be far from today’s. Ask for the year of each figure.
- What price was assumed? A project study done at a lower metal price or lower oil price may no longer match the market.
Energy cost is a site-by-site number, and it is partly fixed before a mine is built, by the choice of location and process. Farmonaut’s satellite-based mineral detection helps at the start of that choice, by screening a licence area for the alteration patterns that point to mineralisation and for faults and fractures. It does not predict power prices or replace a feasibility study. You can read about it on our satellite mineral detection page, request a quote on the mining query form, or contact the team.
If this topic matters to you, read De Beers Lab-Grown Diamonds: Market Share, Prices, Sale next.
Related reading on this site: How Much Copper Does a Data Center Use? Calculator.
Frequently asked questions
How much of mining cost is energy?
It depends on the metal, the mine and what is counted. Freeport-McMoRan reported 15% of copper mine-site operating costs in 2025 and expects about 17% in 2026. Goldmoney’s 2018 study of large gold producers found direct energy near 20% of operating costs in 2016 and about 50% when indirect energy is included. Treat these as a range, not a rule.
Do higher energy costs raise the gold price?
Not directly in any reliable way. Higher costs raise the price at which weaker mines stop being profitable, but the gold price is set mostly by investment demand, interest rates and the dollar. In the World Bank data, Brent crude rose 21% from the first to the third quarter of 2026 while the gold price fell 12%.
Do higher energy costs raise the copper price?
They raise the cost of producing copper and can delay new supply, so they support the price over time. In the World Bank data copper rose from US$12,831 to US$14,114 per tonne between the first and third quarters of 2026 while Brent rose, but demand from power grids, electric vehicles and data centres also played a part, so the effect cannot be isolated.
Which part of copper production uses the most electricity?
The concentrator, where ore is ground and floated. Cochilco’s 2025 figure for large Chilean mines is 3,477 kWh per tonne of fine copper for that step. Solvent extraction and electrowinning (SX-EW) is about 3,772 kWh per tonne for oxide ore, and the smelter about 1,473 kWh per tonne.
Why does the copper mining industry’s power use keep growing?
Ore grades fall, more mines process sulphide ore in concentrators, and more plants rely on desalinated seawater. Cochilco projects Chilean copper-mining electricity use rising 20.2% by 2034 against 8.3% growth in output.
What is all-in sustaining cost, and does it include energy?
All-in sustaining cost is the World Gold Council’s measure of the cost of keeping a gold mine producing. It includes mine-site operating costs, sustaining capital, sustaining exploration, corporate overhead, royalties, production taxes and closure costs. Energy sits inside the mine-site operating costs and is not reported as a separate line in the headline figure.
What happens to miners when oil prices spike?
Diesel-heavy sites see costs rise first. Mines on long-term power contracts feel it later. Supply responses such as deferred projects or closures of high-cost mines take months or years. Some companies hedge fuel, but hedges can limit gains if prices later fall.
Is mining cost a floor under the gold price?
Only loosely. The World Gold Council put the industry’s average AISC at US$1,785 per ounce in the first quarter of 2026, while the quarter’s average gold price on the World Bank series was US$4,876. Costs would have to rise a very long way before the average mine became unprofitable.
Can renewable power cut a mine’s energy cost risk?
It can reduce exposure to fuel prices when a mine replaces diesel generation or buys long-term renewable supply. Cochilco expects almost all contracted electricity for Chilean copper mining to be renewable by 2030. The saving depends on local contract prices, storage needs and the capital cost of the equipment.
Can satellite data help with energy cost?
Satellite screening cannot see power prices. It can help a licence holder flag likely target zones in a licence from alteration patterns, faults and fractures, so that early field work and drilling go to the best ground first. Energy cost for a future mine still has to come from engineering studies and quotes.
Prices quoted on this page: gold spot bid US$4,157.70 per ounce at 14:51 New York time on 15 October 2026 (Kitco); LME copper cash-settlement US$14,751 per tonne on 14 October 2026 (Westmetall, LME data). Both change daily.
This page is for information only. It is not investment advice.
Farmonaut mining
See which ground in your licence ranks first
Satellite mineral detection flags likely target zones in a licence area from alteration halos and faults, so early work goes to the best ground first.

Mining Pro sample view, synthetic data
Keep reading

Sources
- Freeport-McMoRan, Form 10-K for 2025 (energy 15% of copper mine-site operating costs): s22.q4cdn.com
- Newmont, Form 10-K for 2025 (principal energy sources and risk): s24.q4cdn.com
- Barrick, Annual Report 2025 (AISC and 2026 guidance): s25.q4cdn.com
- World Gold Council, Gold Demand Trends Q2 2026, Supply (AISC US$1,785/oz in Q1 2026): gold.org
- World Gold Council, Gold and climate change: Current and future impacts (2019): gold.org
- World Bank, Commodity Price Data (The Pink Sheet), 2 October 2026: thedocs.worldbank.org
- World Bank, Commodity Markets Outlook press release, 28 April 2026: worldbank.org
- Cochilco, Projection of electricity consumption in copper mining 2025-2034 (2026): cochilco.cl
- Cochilco, Cost Observatory 2024 vs 2023: cochilco.cl
- Reporte Minero, Cochilco cost observatory for 2025 (1 June 2026): reporteminero.cl
- USGS, Mineral Commodity Summaries 2026: Copper: pubs.usgs.gov
- Goldmoney, Gold Price Framework Vol. 2: The energy side of the equation, Part II (10 July 2018): goldmoney.com
- Kitco, Gold price today (15 October 2026): kitco.com
- Westmetall, LME copper cash settlement and stocks (14 October 2026): westmetall.com
Discussion
Questions, corrections or field experience? Share them below. First-time comments are reviewed before they appear, and your email is never published.
No comments yet. Be the first to add a question or your experience.

 Congo Mining Solutions
 Mining SARL
 SenGold Invest SAS
 Sania Corporation
 Sean Mining Limited
 NTS Group (Pty) Ltd
 Mine4Africa
 Lithspo Minerals Limited
 Tintina Mining Group
 Dalgety Minerals Pty Ltd
 Vortex Minerals Pty Ltd
 Faith At Work (Pty) Ltd
 Geotech Mining Solutions plc
 Vulcan International Limited
 Kidepo Associates
 GKY Mining
 Alkimy SARL
 Double A Trading
 GemSprout Metals Limited
 Qader Group
 Ileys General Trading
 SG Gold Mining LLC
 VRV Global Pte Ltd










