

Western Australia · Regional data guide
Perth Mining Hub: Jobs, Ports and Output by Region
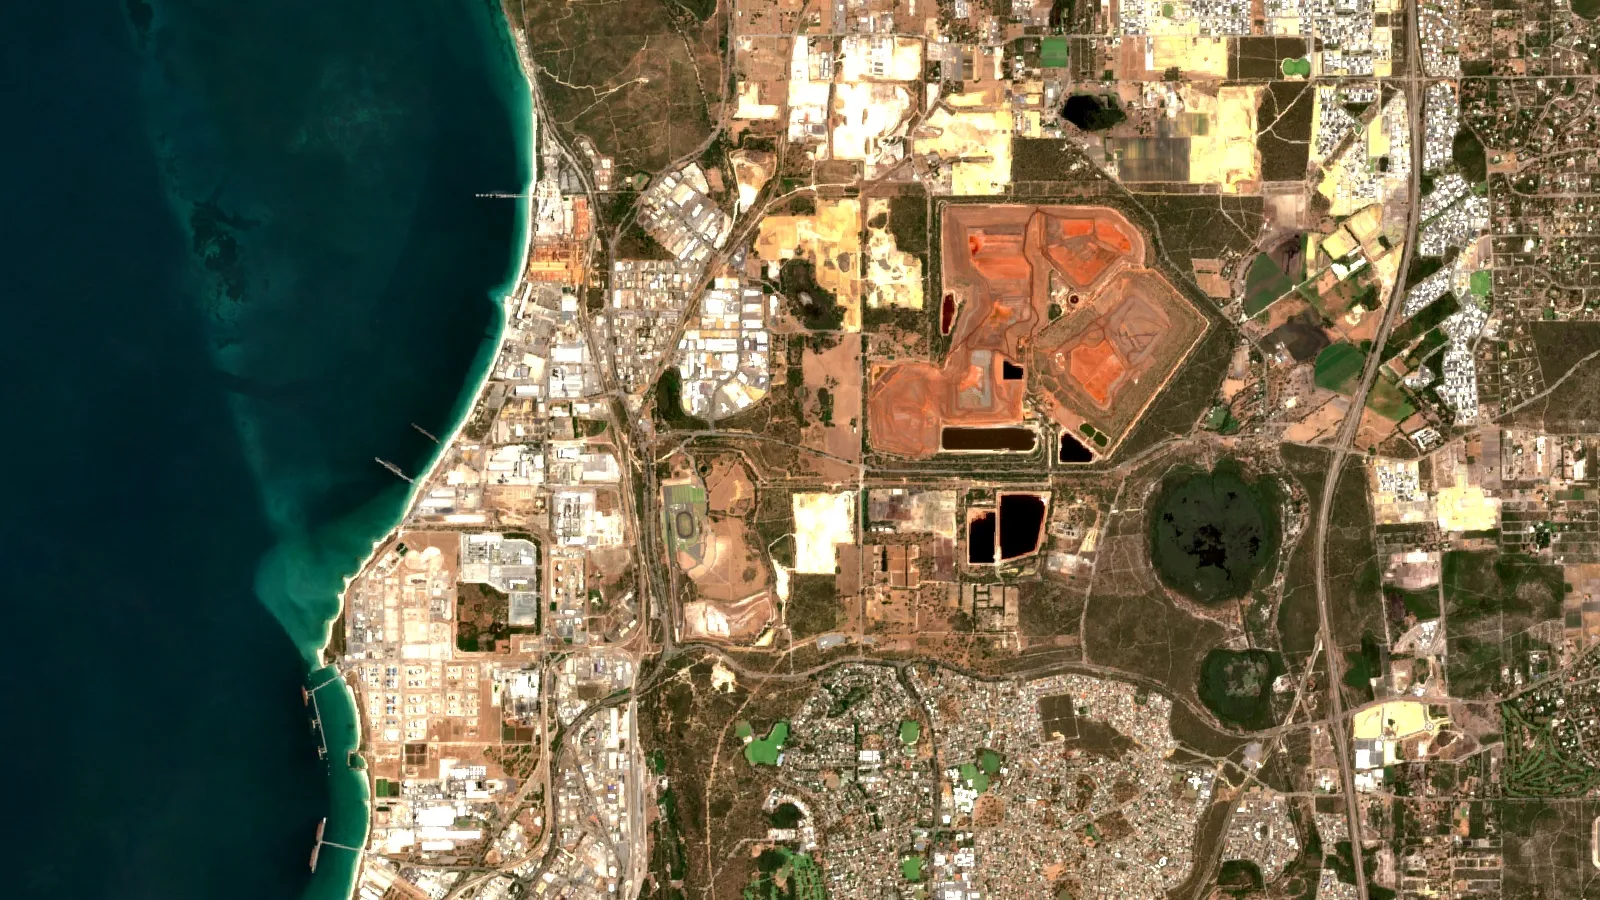
Perth is the office, port and processing centre for WA mining, not the mining district: the Perth region made A$76.6 million of minerals in 2024–25 against A$122.8 billion in the Pilbara.
Key takeaways
- WA mineral sales were A$171 billion in 2024–25, and iron ore alone was A$122 billion (DMPE Statistics Digest 2024–25).
- The Perth region produced A$76.6 million of minerals and had 2,048 on-site mining FTEs, against 134,009 for the state (DMPE, 2024–25).
- Port Hedland shipped 550 Mt of iron ore in 2025–26, 59% of WA’s iron ore export volume; Fremantle is a container port (WA Treasury Corporation, August 2026; Westport).
- Lithium sales fell from A$21.5 billion in 2022–23 to A$4.3 billion in 2024–25, and Kwinana and Kemerton refinery plans were cut back (DMPE, 2024–25).
- WA held 26,168 live mining tenements over about 26% of its land at the end of 2024–25 (DMPE).
In this article
- Is Perth a mining hub? The short answer
- What a mining hub does: head offices, ports, refineries and a mint
- Where the mining jobs are: Perth region against the pits
- Where the mining money is made, region by region
- What Western Australia sends out: iron ore, gold, alumina and lithium
- How minerals leave: Port Hedland, Fremantle and Kwinana
- Perth's processing belt: Kwinana, Kemerton and Kalgoorlie
- Gold, the Perth Mint and the Goldfields
- Exploration and tenements: what it costs to look
- What the price moves mean for Perth suppliers and advisers
- What to watch next in the Perth region
- Value an iron ore cargo before it sails
- Where satellite screening fits for licence holders
- How these figures were compiled
Is Perth a mining hub? The short answer
Yes, but as an office, port and processing centre rather than a mining district. In 2024–25 Western Australia (WA) sold minerals worth A$171 billion (WA DMPE, Statistics Digest 2024–25). Almost none of it was dug in the Perth metropolitan area. The Perth region produced minerals worth only A$76.6 million, about 0.04% of the state total, while the Pilbara produced A$122.8 billion.
So the useful question is not “how much does Perth mine” but “what does Perth do for the mines”. It is where many head offices sit, where fly-in fly-out (FIFO) crews start their rosters, where the Perth Mint refines gold, and where the Kwinana industrial strip refines alumina, nickel and lithium. This page uses the state’s own statistics to show which of those roles are strong and which have weakened since the 2022–23 peak.
Terms used below. FTE means full-time equivalent, the state’s way of counting on-site jobs. Tenement is the WA word for a mining title, such as a prospecting licence or a mining lease. Spodumene concentrate is the crushed and floated lithium ore that is shipped to refineries. Care and maintenance means a mine or plant is shut but kept ready to restart.
What a mining hub does: head offices, ports, refineries and a mint
A mining hub earns its name from services, not pits. The table below separates the roles and shows what the evidence says for Perth.
| Role | Perth region evidence | Source |
|---|---|---|
| Head offices and finance | PLS, the lithium producer behind Pilgangoora, lists its registered office and principal place of business at West Perth | PLS Annual Report, 2026 |
| Gold refining and minting | The Perth Mint is owned by the Western Australian State Government and runs a gold refinery | Perth Mint |
| Bulk port for alumina, grain and mineral sands | The Outer Harbour at Kwinana handles alumina, mineral sands and grain, with about 850 ships and carriers a year | Westport, FAQs |
| Processing plants | Kwinana lithium hydroxide and nickel refineries, Kemerton lithium hydroxide plant (Bunbury area, idled in February 2026), Rockingham zirconia plant. Several are shut or cut back, see below | DMPE Statistics Digest 2024–25 |
| Mining jobs on site | 2,048 FTEs in the Perth local government areas in 2024–25, against 134,009 for the whole state | DMPE Statistics Digest 2024–25 |
That mix explains the odd search pattern around the topic. People who type “Perth mining” often want jobs, suppliers, offices or shipping information, and the answers sit in different places: Perth for the first three, the Pilbara and Goldfields for the pits, and the ports for shipping.
Where the mining jobs are: Perth region against the pits
WA’s mining industry had 134,009 on-site FTE positions in 2024–25, close to the record of 135,978 set a year earlier. Iron ore was the largest employer at 65,496 FTEs, and gold was second at 35,672 FTEs, up by almost 4,000 on 2023–24. Lithium employment fell to 9,337 FTEs, down by more than 2,000, as several higher cost operations went into care and maintenance (DMPE, 2024–25).
Chart
On-site mining jobs by region
Full-time equivalent (FTE) positions, 2024–25, selected regions
By region, the Pilbara had 70,659 on-site FTEs and the Goldfields–Esperance region had 34,657. The Perth local government areas together had 2,048, of which Kwinana had 1,297 (down from 2,290 in 2023–24) and Rockingham 436. Fremantle had 5. Those on-site counts do not include head-office staff, who work in Perth towers and are not counted as on-site mining jobs.
For a consultant or supplier this matters. A contract that needs people at a pit is a Pilbara, Goldfields or Mid West job even if the client signs in Perth. A contract for a refinery, a shipping line or a laboratory is a Perth-region job. Our guide to iron ore in Canada covers another major iron ore province.
Where the mining money is made, region by region
The state’s regional table for 2024–25 values mineral output at A$171 billion. The Pilbara alone was A$122.8 billion, mostly iron ore at A$119.0 billion. The Goldfields–Esperance region followed at A$25.7 billion, led by gold at A$21.8 billion, and the Peel region, which includes the Pinjarra alumina refinery area, was A$11.2 billion. The Perth region figure was A$76.6 million, coming from construction materials, silica sands and limesand (DMPE, Table 7, 2024–25).
Chart
Value of minerals by region
A$ billion, 2024–25, selected regions, minerals only
Value is only half of the picture. WA also leads the world in volume for several minerals. The digest ranks the state first for iron ore (35.6% of world quantity in 2024), lithium (41.6%), garnet (37.1%) and rutile (27.8%), and third for gold (6.3%) and rare earth oxides (7.6%). USGS puts Australia’s usable iron ore output at about 982 million tonnes in 2024 and 980 million tonnes in 2025 (estimate), and its lithium output at 82,700 tonnes of contained lithium in 2024 and 92,000 tonnes in 2025 (estimate) (USGS Mineral Commodity Summaries 2026, iron ore; lithium). Our explainer on the types of iron ore explains how the ore types differ.
What Western Australia sends out: iron ore, gold, alumina and lithium
Iron ore sales were A$122 billion in 2024–25 on a near record 864 million tonnes. Prices averaged US$101 per tonne, down from US$119 a year earlier, on weaker Chinese steel demand. Gold sales hit an all-time high of A$29 billion on about 6.7 million troy ounces (209 tonnes), with the price averaging US$2,820 per ounce over the year. Alumina earned A$8.2 billion on 10.8 million tonnes, a 25-year low in volume. Lithium fell to A$4.3 billion, nickel to A$2.1 billion (the lowest in more than 20 years) and copper to A$995 million.
| Commodity | Sales 2024–25 (A$) | Quantity | What changed |
|---|---|---|---|
| Iron ore | 122 billion | 864 Mt | Near record volume, lower price than 2023–24 |
| Gold | 29 billion | 6.7 Moz | Record sales value on record prices |
| Alumina | 8.2 billion | 10.8 Mt | Volume at a 25-year low after the Kwinana refinery curtailment |
| Lithium | 4.3 billion | 3.85 Mt spodumene concentrate | Record volume, prices near 2021 lows |
| Nickel | 2.1 billion | 88 kt | Lowest sales in more than 20 years |
| Copper | 0.995 billion | 73 kt | 20-year low volume after DeGrussa ended |
Source for the table: DMPE Statistics Digest 2024–25. Mt is million tonnes and kt is thousand tonnes.
How minerals leave: Port Hedland, Fremantle and Kwinana
Fremantle is not a mineral export port in any large way. Its Inner Harbour is built for containers and vehicles, and Westport, the state’s port planning body, aims to move container trade to Kwinana because Fremantle’s harbour can only take ships of up to 12,000 TEU (Westport). Bulk minerals go through the Outer Harbour at Kwinana, which handles alumina and mineral sands, and through the northern ports.
Chart
Iron ore exports by WA port
Million tonnes, 2025–26
The iron ore ports show the scale. In 2025–26 Port Hedland shipped 550 million tonnes, 59% of WA’s iron ore export volume. Cape Lambert shipped 168 million tonnes and Dampier 147 million tonnes. All other ports together shipped 71 million tonnes, up 46%, as the Onslow Iron project ramped up from 13.1 to 30.8 million tonnes (WA Treasury Corporation, WA Iron Ore Profile, August 2026).
The same logic answers the common question about the battery supply chain at Fremantle. Lithium leaves WA as spodumene concentrate, and China took 94.5% of the 2024–25 exports by value according to the digest, so the battery chain from WA is a bulk shipping story. The chemical plants that were meant to add value sit at Kwinana and Kemerton, not on the Fremantle wharves.
Perth’s processing belt: Kwinana, Kemerton and Kalgoorlie
The processing sector is where Perth’s hub role has been under most strain. The digest records these events, all in the 2024–25 cycle or just after:
Chart
WA lithium sales value
A$ billion per financial year
- Alcoa announced in September 2025 that it will permanently close the Kwinana alumina refinery, which had stopped production earlier.
- BHP suspended its Nickel West operations from October 2024, including the Kwinana nickel refinery and the Kalgoorlie smelter; BHP has said it will review the suspension by February 2027 (BHP, July 2024).
- Albemarle put Train 2 of its Kemerton lithium hydroxide plant into care and maintenance in July 2024 and halted work on Train 3. On 11 February 2026 it also idled Train 1, the last running train, so the plant has no operating line.
- Tianqi and IGO ceased work on a second train at the Kwinana lithium hydroxide refinery in January 2025.
- Covalent Lithium made its first lithium hydroxide at its Kwinana refinery in August 2025.
- The state announced a A$150 million Lithium Industry Support Package in November 2024, including waived fees for land, water, power and port use.
IGO’s 2026 annual report describes the Kwinana refinery as a complex issue yet to be resolved (IGO Annual Report, 2026). Rare earths are a brighter spot: the digest lists Lynas Rare Earths processing at Kalgoorlie, and our note on rare earth separation explains the chemistry behind such plants. For the mines that feed the refineries, see our guide to lithium in Australia.
The pattern is clear in the money. Lithium sales were A$21.5 billion in 2022–23, A$8.5 billion in 2023–24 and A$4.3 billion in 2024–25, while record volumes were shipped in the last year. A hub built on a price spike has to cope with a price fall.
Gold, the Perth Mint and the Goldfields
Gold is the second pillar. WA gold sales of A$29 billion supported 35,672 on-site jobs in 2024–25, and the digest names Gold Fields, Genesis Minerals, AngloGold Ashanti, Bellevue Gold and Ramelius Resources among the producers whose output rose. The Perth Mint, owned by the state, sells bullion and coins and refines gold (Perth Mint). The digest records that early 2025 gold export swings to the United States reflected a price gap between New York and London, and that the Perth Mint was one of the few refineries still operating in early to mid 2020.
For scale, USGS puts Australian gold mine output at 284 tonnes in 2024 and 280 tonnes in 2025 (estimate) (USGS Mineral Commodity Summaries 2026, gold), so WA’s 209 tonnes in 2024–25 is most of the national total. The digest puts WA at 72% of Australian gold production in 2024–25.
The state also shows how a hub reacts to price. Gold exploration spending was A$1.03 billion in 2024–25, the highest since 2022, so the offices in Perth are paying for drilling when the price is high.
▶ How mining pays for exports, jobs and public revenue, in plain language. · 5:03
Exploration and tenements: what it costs to look
WA mineral exploration spending was A$2.57 billion in 2024–25, almost the same as 2023–24 and just under the A$2.60 billion record of 2023. Across Australia, seasonally adjusted mineral exploration was A$1,142.9 million in the June quarter 2026, up 17.9% on a year earlier (Australian Bureau of Statistics, release of 31 August 2026).
| Target | WA exploration spend 2024–25 (A$ million) | Note |
|---|---|---|
| Gold | 1,030 | Highest since 2022 |
| Iron ore | 806 | Highest in more than a decade |
| Other minerals (including lithium, rare earths) | 351 | Down from a record 584 in 2023–24 |
| Nickel and cobalt | 186 | Below recent years |
| Copper | 149 | Below the 2021–22 peak of over 250 |
There were 26,168 live mining tenements covering more than 66.5 million hectares at the end of 2024–25, about 26% of WA’s land (DMPE, 2024–25). With that much land held, a licence owner’s first job is often a desk study: what does the ground look like, which parts are already under another title, and where is the next anomaly? That screen is cheaper than a drill hole.
What the price moves mean for Perth suppliers and advisers
Two simple sums show how sensitive the sector is. Iron ore volume was near a record at 864 million tonnes, yet the average price fell from US$119 to US$101 per tonne, a drop of about 15%, and sales ended below the record years. Gold went the other way: the average price was US$2,820 per ounce over 2024–25 and passed US$3,300 by the end of June 2025 (A$5,100), so sales reached a record on only a slight rise in ounces (DMPE, 2024–25). A weaker Australian dollar helped both, because costs are paid in Australian dollars while sales are priced in US dollars.
For anyone selling services to miners from Perth, three questions are worth asking before choosing a commodity to follow:
- Is the work tied to price or volume? Iron ore work follows volume, which stayed near record. Lithium and nickel work followed price, and both fell sharply.
- Is the client building or operating? The digest shows Mount Holland and Kathleen Valley moving from construction into production, while other lithium sites went into care and maintenance. Construction contractors feel those changes first.
- Is the plant near Perth or far away? Refinery work near Kwinana depends on the closures and restarts listed above. Pit work depends on the Pilbara and Goldfields.
Gold is the steadiest of the three in the 2024–25 data, with higher jobs, higher sales and the highest exploration spend since 2022. Iron ore is the largest by far. Lithium has the most volume growth and the weakest price.
What to watch next in the Perth region
- Kwinana lithium hydroxide: IGO has said the refinery is an unresolved issue, while Covalent’s Kwinana plant has begun production.
- Alumina: the permanent closure of the Kwinana alumina refinery removes a long-running Perth-region processing job base.
- Port capacity: Westport plans to add about 365 ship calls a year at Kwinana from the late 2030s as container trade moves there (Westport).
- Onslow iron ore: exports from Onslow rose from 13.1 to 30.8 million tonnes in 2025–26 (WA Treasury Corporation); Port Hedland still rose 0.8% to 550 million tonnes.
- Exploration spend: Australia-wide mineral exploration spending rose 17.9% year on year to the June quarter 2026 (seasonally adjusted, ABS).
Value an iron ore cargo before it sails
The calculator below turns a cargo size, a dollar price and the exchange rate into Australian dollars. WA sells in US dollars but pays costs in Australian dollars, so the exchange rate moves the local value. The digest says the Australian dollar averaged about US 65 cents in 2024–25 and that iron ore averaged US$101 per tonne; both are used here only as starting examples, not as today’s rates.
Calculator
What is an iron ore cargo worth in Australian dollars?
Enter your own cargo size, price and exchange rate.
- Cargo value in US dollars (US$ million): 20.0
- Value per tonne (A$): 153.85
Example values only, not a benchmark. The digest reports 2024–25 averages of US$101 per tonne and about US 65 cents per Australian dollar (DMPE Statistics Digest 2024–25). Prices and exchange rates are inputs: example, use today’s price. Freight, royalties, costs and contract terms are left out.
Where satellite screening fits for licence holders
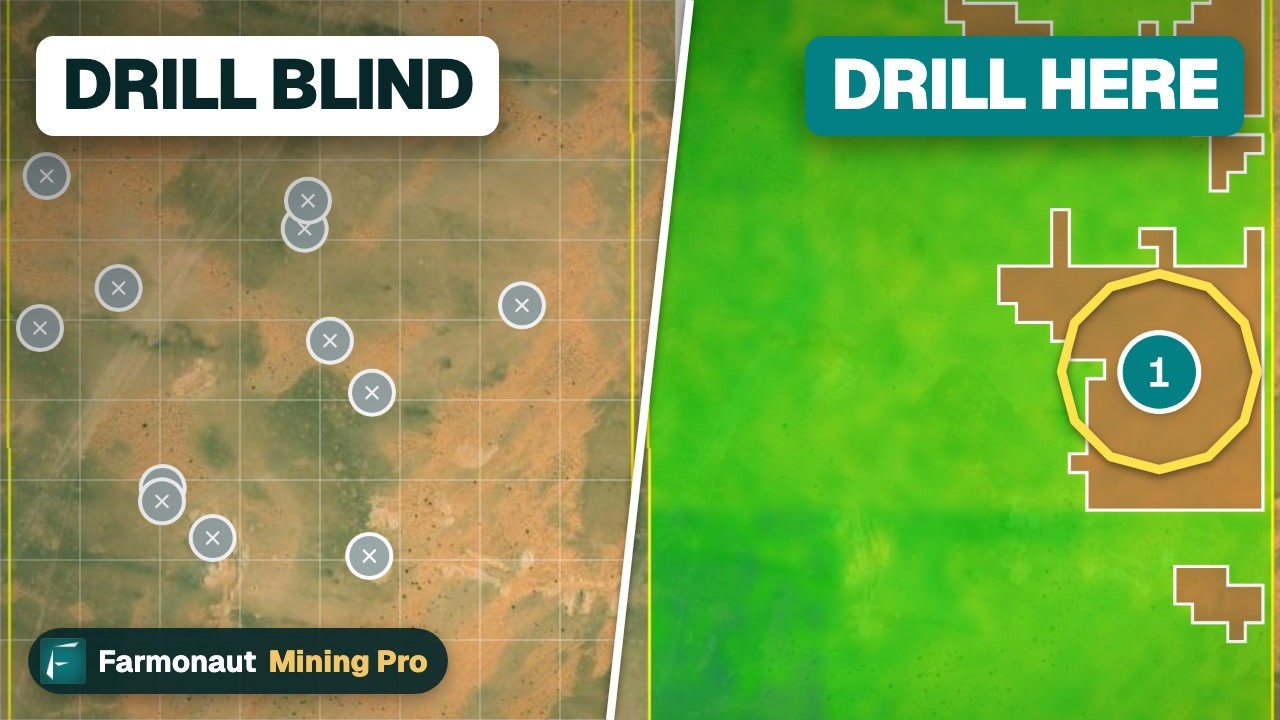
Satellite data does not replace drilling, and its results are exploration targets that sit ahead of any resource estimate. It does help a consultant or licence owner decide where to look first. A satellite mineral screen compares clay, iron-oxide and structural signals across a licence area and ranks the ground, in days rather than months. Farmonaut offers satellite-based mineral detection for licence boundaries supplied as KML, KMZ or a polygon, and you can send a project through the mining query form or contact the team for a quote.

▶ What AI and satellite tools can and cannot do in mineral exploration. · 4:37
How these figures were compiled
Production, sales, employment, export and tenement figures come from the DMPE Statistics Digest 2024–25 (published May 2026). Port volumes come from the WA Treasury Corporation iron ore profile of August 2026. National exploration data come from the ABS release of 31 August 2026, and USGS figures from the Mineral Commodity Summaries 2026. Perth region figures use the digest’s Perth local government areas. Every price on this page is shown with its period, and none is a current quote.
Frequently asked questions
Is Perth the mining capital of Australia?
It is the main business centre for the WA resources sector, which sold A$171 billion of minerals in 2024–25, with iron ore alone at A$122 billion. The pits are far away, though: the Pilbara and the Goldfields hold the large mines, and the Perth region produced only A$76.6 million of minerals.
How many people work in WA mining?
There were 134,009 on-site FTE positions in 2024–25, with 65,496 in iron ore and 35,672 in gold. Head-office and service jobs in Perth are counted separately and are not part of that on-site figure.
Does Perth have any mines?
Not in a meaningful way. The Perth local government areas recorded 2,048 on-site mining FTEs, mostly at the Kwinana and Rockingham industrial areas, and mineral output worth A$76.6 million from construction materials, silica sands and limesand.
Is the Port of Fremantle used for mineral exports?
Mostly not. Fremantle handles containers and vehicles, and Westport plans to move container trade to Kwinana. Bulk minerals such as alumina and mineral sands use the Outer Harbour at Kwinana, and iron ore goes through Port Hedland, Cape Lambert and Dampier.
Which port ships the most iron ore in WA?
Port Hedland, with 550 million tonnes in 2025–26, which is 59% of the state’s iron ore export volume.
What is the state of lithium refining near Perth?
Mixed. Covalent Lithium made first lithium hydroxide at Kwinana in August 2025, but a second Tianqi and IGO train was stopped in January 2025 and Albemarle’s Kemerton Train 2 was placed in care and maintenance in July 2024; in February 2026 Albemarle idled Train 1 too. Lithium sales fell from A$21.5 billion in 2022–23 to A$4.3 billion in 2024–25.
Where does WA rank in world production?
First for iron ore, lithium, garnet and rutile by quantity in 2024, and third for gold and rare earth oxides, according to the digest’s Table 1.
How much land is under mining title in WA?
26,168 live mining tenements covered more than 66.5 million hectares at the end of 2024–25, around 26% of the state.
What is an FTE in mining statistics?
A full-time equivalent counts hours worked as full-time jobs. Two half-time workers count as one FTE, so FTE counts differ from head counts.
Is this investment advice?
No. The page reports public statistics and company filings, gives no price targets and makes no recommendation on any company.
This page is for information only. It is not investment advice. It gives no price target and no recommendation on any company. Figures come from the sources and periods shown and can change.
Farmonaut mining
Map your mining site from space
Consultants can screen a licence area for mineral targets from satellite data, as a step ahead of any resource estimate.

Mining Pro sample view, synthetic data
Keep reading
Sources
- WA DMPE, Statistics Digest 2024–25: wa.gov.au
- WA Treasury Corporation, WA Iron Ore Profile (August 2026): watc.wa.gov.au
- Westport, FAQs on Fremantle and Kwinana ports: westport.wa.gov.au
- PLS Annual Report 2026: pls.com
- IGO Annual Report 2026: igo.com.au
- USGS Mineral Commodity Summaries 2026, iron ore: pubs.usgs.gov
- USGS Mineral Commodity Summaries 2026, lithium: pubs.usgs.gov
- Perth Mint (Gold Corporation): perthmint.com
- Australian Bureau of Statistics, Mineral Exploration release, June 2026: abs.gov.au
- USGS Mineral Commodity Summaries 2026, gold: pubs.usgs.gov
- BHP, Western Australia Nickel to temporarily suspend operations (July 2024): bhp.com
Discussion
Questions, corrections or field experience? Share them below. First-time comments are reviewed before they appear, and your email is never published.
No comments yet. Be the first to add a question or your experience.

 Lithspo Minerals Limited
 Tintina Mining Group
 Dalgety Minerals Pty Ltd
 Vortex Minerals Pty Ltd
 Faith At Work (Pty) Ltd
 Geotech Mining Solutions plc
 Vulcan International Limited
 Kidepo Associates
 GKY Mining
 Alkimy SARL
 Double A Trading
 GemSprout Metals Limited
 Qader Group
 Ileys General Trading
 SG Gold Mining LLC
 VRV Global Pte Ltd
 Omsri International FZE
 G.I.T.T.
 Jaunita Erss Ltd
 Almosi SARL
 SRK Consulting
 Berks Gold Limited
 Mwerezi Minerals Company Limited

 Exploration consultancy · South Africa · Gold










