

Gold rush history · Farming effects with census data
Positive Effects of the Gold Rush on California Farming
The gold rush gave California farmers a large cash market and turned the state from a grain importer into an exporter: wheat rose from 17,228 bushels in 1850 to 5.9 million in 1860. Later, mining debris buried some of those farms.
Key takeaways
- California wheat rose from 17,228 bushels in 1850 to 5,928,470 in 1860 (US census).
- Census population grew from 92,597 in 1850 to 379,994 in 1860, though the 1850 count is incomplete.
- Improved farmland reached 2,468,034 acres by 1860 (US census).
- Hydraulic mining produced about 1,555 million cubic yards of debris in the Sierra Nevada (USGS Paper 105).
- A federal court limited hydraulic mining in 1884 after farmers sued.
In this article
- Seven positive effects of the gold rush on California agriculture
- How the gold rush created a food market for farmers
- What the census shows about farm output
- From grain importer to grain exporter
- Roads, ships and markets that also served farms
- Water rights and irrigation after the gold rush
- The negative effects farmers paid for
- Positive and negative effects compared
- What this history means for mineral claim owners and investors
- Estimating an old hydraulic pit or tailings area
- Is modern California farming a result of the gold rush?
- Frequently asked questions
The main positive effects of the gold rush on California farming were a huge new food market, a fast switch from importing grain to exporting it, and new money and transport links for rural areas. The 1860 US agricultural census shows the scale: wheat rose from 17,228 bushels in 1850 to 5,928,470 bushels in 1860.
Those gains came with real costs. Hydraulic mining later buried valley farms under sediment, and Native Californians lost land and food sources. This page sets out both sides using census tables and US Geological Survey (USGS) reports. For the wider social and political story, see our guide to the effects of the California gold rush.
Seven positive effects of the gold rush on California agriculture
We chose these seven because each can be tied to a dated record: a census count, a court ruling, a state law or a government report. They run from the most direct effect on farm income to the slowest legacy.
- A large cash market for food. The state’s counted population grew about fourfold between the 1850 and 1860 censuses, and most newcomers did not grow their own food.
- Grain self-sufficiency, then exports. The 1860 census report says California had been fully dependent on South American ports for breadstuffs a few years earlier, and now sent wheat ships to Liverpool and London.
- A wider mix of farm products. Barley, oats, potatoes, butter, cheese and wool all appear in large amounts by 1860.
- A rapid livestock build-up. Milk cows went from 4,280 to 205,407 in ten years.
- Milling and trade jobs near the farm. California had more than 200 flour mills by 1860, according to historians Rawls and Orsi.
- Better links to outside markets. Steamship lines and the Panama Railway, finished in 1855, tied the state more closely to the East Coast.
- Water law and later irrigation districts. Rules that began in mining camps shaped how water was claimed, and an 1887 state law later let small farmers organize irrigation together.
How the gold rush created a food market for farmers
Gold was found at Sutter’s Mill on 24 January 1848, and the news drew roughly 300,000 people from the rest of the United States and abroad. Before the rush, PBS American Experience counts about 6,500 Californios (people of Spanish or Mexican descent), 700 foreigners and 150,000 Native Americans.
Chart
California census population
Thousand people; the 1850 count is incomplete
The state’s census population was 92,597 in 1850 and 379,994 in 1860. The 1850 figure is an undercount, because the returns for San Francisco, Contra Costa and Santa Clara counties were lost. So the true growth was smaller than the raw numbers suggest, but it was still very large.
Miners also had money to spend. PBS puts the gold taken out at US$10 million in 1849, US$41 million in 1850, US$75 million in 1851 and US$81 million in 1852, in the money of those years. Part of that cash went on flour, meat, vegetables and animal feed. A farmer close to the camps had customers who could pay, and few local rivals in the first years.
As digging became harder for individuals, other work became more attractive. Wikipedia’s account, drawing on Rawls and Orsi, notes that by 1855 gold could be recovered profitably only by medium and large groups of workers, and that the state’s economy had by then grown diverse enough to make money in other ways. Some settlers also brought farming skills with them. People from the hill villages near Genoa, Italy, for example, settled in the Sierra Nevada foothills.

▶ How gold is mined and refined, step by step · 5:27
What the census shows about farm output
The clearest evidence is in the federal census reports, which compare 1850 with 1860 for each state. They should be read with one caution: the 1850 returns are incomplete, so very large percentage rises overstate true growth. The direction and the 1860 totals are the solid part.
Chart
Livestock on California farms
Thousand head, 1850 and 1860
Chart
California grain output in 1860
Million bushels
By 1860 California reported 2,468,034 acres of improved farmland (cleared and in use) and 6,262,000 acres of unimproved land in farms. The cash value of that farmland was US$48,726,804.
| Product | 1850 | 1860 | Unit |
|---|---|---|---|
| Wheat | 17,228 | 5,928,470 | bushels |
| Barley | 9,712 | 4,415,426 | bushels |
| Corn (maize) | 12,236 | 510,708 | bushels |
| Oats | Not reported | 1,043,006 | bushels |
| Butter | 705 | 3,095,035 | pounds |
| Wool | 5,520 | 2,683,109 | pounds |
| Milk cows | 4,280 | 205,407 | head |
| Horses | 21,719 | 160,610 | head |
| Working oxen | 4,780 | 26,004 | head |
| Swine | 2,776 | 456,396 | head |
| Value of livestock | US$3,351,058 | US$35,585,017 | US$ of the day |
Crop figures come from the census sections on grains and dairy and on swine and livestock value. The report notes that California moved from 29th to 12th among wheat-producing states in ten years, and that it grew more barley than any other state in 1860. Barley fed the many horses and mules that moved goods to the camps, although that link is our reading rather than a census statement.
From grain importer to grain exporter
In the first rush years, California could not feed itself. Farmers abroad filled the gap. Chile is the best documented case: its grain shipments to California went from 3,000 metric quintals (qqm, 100 kg each) in 1848 to 277,000 in 1850, and fell back to 63,000 by 1854. Farmers in Australia and Hawaii also found a new market.
Chart
Chilean grain shipped to California
Thousand metric quintals (100 kg), selected years
The fall in Chilean shipments lines up with California’s own harvest growth. By the early 1860s the census report describes a complete reversal, with ships loaded with wheat sailing from San Francisco to Liverpool or London. It adds a line the state’s farmers must have enjoyed: riches other than gold had been found in the soil.
Former Governor John Downey gave the census office his own account. He ranked wheat next after precious metals in importance and quoted yields of 30 to 60 bushels an acre. He described the 250 miles from Monterey Bay to the head of the Russian River as one vast wheat field. He also pointed out why California grain traveled so well: with no rain from May to November, farmers could cut, thresh and sack on the field and keep the grain sound for a long voyage. These are an enthusiast’s claims rather than measured averages, so treat the yields as the top of the range.
Roads, ships and markets that also served farms
Gold rush wealth and population growth improved transport between California and the East Coast. The Panama Railway across the isthmus was finished in 1855, and steamship lines began regular runs. Inside the state, towns such as Sacramento and San Francisco grew into trading centers. San Francisco alone rose from about 1,000 people in 1848 to 25,000 full-time residents by 1850.
For farmers this meant buyers, warehouses, merchants and credit within reach. Statehood followed on 9 September 1850, which brought courts and public bodies able to settle land and water disputes, though land title fights lasted for years.
Processing grew too. By 1860 the state had over 200 flour mills and was shipping wheat and flour abroad. A mill keeps more of the crop’s value close to the farm and provides local jobs. The 1860 census also records a farm tool trade, noting that American-made tools were being exported to California, where miners prized them.
Water rights and irrigation after the gold rush
Modern California water law has a direct mining root. In the 1855 case Irwin v. Phillips, a miner had diverted a stream, a later miner downstream tried to send it back, and the California Supreme Court ruled for the first user. This became the prior appropriation doctrine: first in time, first in right. California later combined it with riparian rights, which belong to owners of land along a stream.
The benefit for farming came slowly. A clear legal way to claim and move water away from a stream is what any large irrigation scheme needs in a dry-summer climate. Downey saw the limit in the early 1860s, writing that only a small part of the state could be cultivated because of summer drought and scarce irrigation water. He expected dams on mountain streams to change that.
The next step was the Wright Act of 1887, which let farming regions form and bond irrigation districts so small owners could pool resources. That law came nearly 40 years after the discovery of gold, so it is a legacy of the rush at most, not a direct result. No reliable figure shows that the gold rush itself raised irrigated farmland by a set percentage, and this page does not give one.
The negative effects farmers paid for
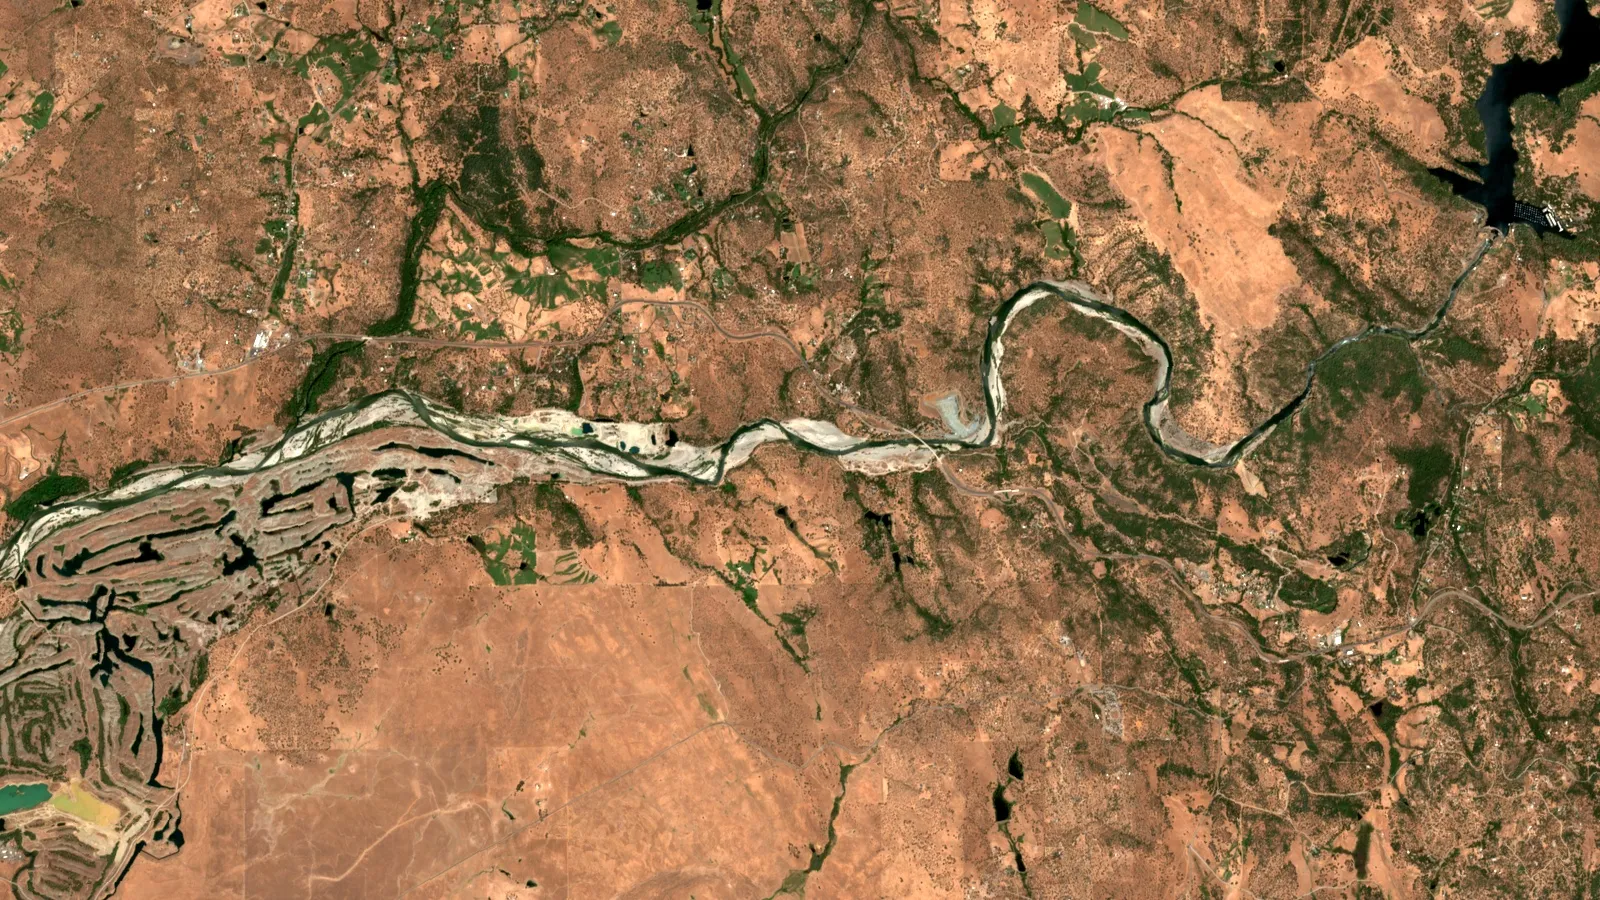
A fair answer has to include the costs, because the same mining boom later harmed the farms it had helped to build. Hydraulic mining used high-pressure water cannons to wash whole gravel hillsides into sluices. G.K. Gilbert’s USGS Professional Paper 105 estimated about 1,555 million cubic yards of debris from hydraulic mining in the Sierra Nevada.
Chart
Hydraulic mining excavation by basin
Million cubic yards, Turner estimate quoted by Gilbert
Gilbert listed the harm valley residents complained about: farmland buried by flood debris, shoaling on the Sacramento and Feather rivers that blocked boats, and higher flood levels that made levees necessary. He also wrote that some farms were buried while others paid more for flood protection.
Farmers fought back in court. In Woodruff v. North Bloomfield, Judge Lorenzo Sawyer ruled on 7 January 1884 that hydraulic mining was a public and private nuisance, and barred it in areas that drain to navigable rivers. California State Parks, which now runs the Malakoff Diggins site, describes the legal battles between the mine company and downstream farm towns as a landmark in US environmental protection.
Other costs were longer lasting:
- Mercury. Miners used mercury to catch fine gold. The USGS reports that hundreds to thousands of pounds remain at each of the many sites affected by hydraulic mining, and that high mercury levels in fish and other wildlife downstream are a consequence.
- Harm to Native Californians. Gravel, silt and toxic chemicals killed fish and destroyed habitats they depended on. Starvation, disease and violence followed, and whole groups were displaced. Much of the new farmland was land they had lost.
- Boom and glut. Stock raisers told Downey the state had about three million horned cattle, far beyond local demand, and called the business profitless and ruinous at that point. Market growth did not protect every farmer.
▶ Seven environmental impacts of mining, explained in clay · 2:31
Positive and negative effects compared
| Area | Positive effect on farming | Negative effect | Record behind it |
|---|---|---|---|
| Markets | Population up about fourfold, 1850 to 1860 | Demand fell short of the cattle supply | Census; Downey letter |
| Crops | Wheat near 5.9 million bushels by 1860 | Cattle and horse glut by the 1860s | 1860 census |
| Land | 2.47 million improved acres by 1860 | Valley farms buried; Native land lost | 1860 census; USGS |
| Water | Legal path to claim and move water | Rivers diverted and silted | Irwin v. Phillips; USGS |
| Transport | Ships and rail links to wider markets | River shoaling hurt boat access | USGS Paper 105 |
| Long-term health | Court limit on debris protected valley land | Mercury still in sediment and fish | Sawyer ruling; USGS |
What this history means for mineral claim owners and investors
Most of California’s old placer districts are still in the same river basins as working farms, towns and water suppliers. If you hold or are thinking of buying ground in these areas, the history gives a practical checklist:
- Check the water position first. Find out whether any water right comes with the property, and who holds senior rights on the same stream. A mining claim does not bring a water right with it.
- Map downstream users. Farms, irrigation districts and towns below your site are the parties most likely to object if sediment or flow changes. That was the core of the 1884 case.
- Treat old workings as both an asset and a liability. Old tailings can still hold gold, but they can also hold mercury. Sample them with a qualified professional before moving material.
- Confirm which methods are allowed. Large-scale hydraulic washing is tightly limited. Read the current state and federal rules, as set out in our guide to California gold mining claim rules.
- Value the land for more than gold. The farm story shows that surface and water value can outlast the mineral value. A check of nearby land use should sit alongside any geology review.
Satellite imagery can help at the screening stage, for example by showing old pits, tailings and nearby cropland across a whole property before anyone visits. Farmonaut’s satellite-based mineral detection maps surface clues for exploration targets; results sit ahead of drilling and do not confirm a resource. You can request a quote or contact the team.
For wider context on where the ground lies, see gold deposits in the United States by state and our US mining map of active mines.
▶ Why owning a gold claim is not the same as owning the land · 3:19
Estimating an old hydraulic pit or tailings area
Gilbert’s total is easier to grasp if you scale it to one property. The calculator below turns a surface area and an average depth into cubic yards, shows that volume as a share of his estimate, and then applies your own grade and gold price. It is only a rough first step, and it says nothing about whether the material can legally or economically be moved.
Calculator
How much material is in your old pit or tailings area?
Enter your own area, depth, grade, recovery and gold price.
- Share of the USGS total (%): 0.01
- Contained gold (troy oz): 518.7
- Recovered gold value (US$): $1,089,266
Example values only, not a benchmark, forecast or resource estimate. The gold price is an example, use today’s price. One acre is 43,560 square feet, one cubic yard is 27 cubic feet, one troy ounce is 31.1035 grams. The 1,555 million cubic yard figure is from USGS Professional Paper 105. Value is before all costs.
Is modern California farming a result of the gold rush?
Only in part. The rush built the early market, population and capital, and farm growth followed. Later crops had many other causes, including irrigation works, rail links, new plant varieties and migrant labor. The state’s own figures show how far things have gone since: California grows more than 400 commodities, and the California Department of Food and Agriculture lists milk at US$8.39 billion and almonds at US$6.87 billion for the 2025 crop year. Wheat, the crop that first made the state a grain exporter, is not in its top ten today.
Frequently asked questions
What were the positive effects of the gold rush?
For California as a whole, they included rapid population growth, statehood in 1850, new towns and better transport. For farming, the main gains were a large cash market for food, wheat output near 5.9 million bushels by 1860, and a shift from importing grain to exporting it.
What were the positive and negative effects of the California gold rush?
Positive effects were economic growth, new markets and transport links. Negative effects were river damage from mining debris, buried farmland, lasting mercury pollution, and violence against and displacement of Native Californians.
How did the gold rush affect agriculture in California?
It created the demand that made commercial farming pay. Improved farmland reached 2,468,034 acres by 1860, and grain, dairy and livestock output all rose sharply against the incomplete 1850 count.
Did the gold rush help or hurt farmers?
Both. Early farmers gained from high demand, while later valley farmers suffered floods and buried fields from hydraulic mining debris until the 1884 Sawyer ruling limited the practice.
How much wheat did California grow after the gold rush?
The census recorded 17,228 bushels in 1850 and 5,928,470 bushels in 1860, moving the state from 29th to 12th among wheat producers.
Why did California import food during the gold rush?
Local farms could not feed the sudden inflow of people. Chile, Hawaii and Australia supplied food, and Chilean grain shipments peaked at 277,000 metric quintals in 1850 in the figures available.
What was the Sawyer decision?
It was the 1884 federal court ruling in Woodruff v. North Bloomfield, which called hydraulic mining a public and private nuisance and stopped it in areas draining to navigable rivers. Valley farmers brought the fight.
Did the gold rush start California water law?
It started one key part. Prior appropriation, or first in time, first in right, grew from mining camp practice and the 1855 case Irwin v. Phillips. California also recognizes riparian rights.
How much debris did hydraulic mining produce?
Gilbert’s USGS report estimated about 1,555 million cubic yards from hydraulic mining in the Sierra Nevada. Part of it reached valley rivers and farmland.
Is there still mercury from the gold rush in California?
Yes. The USGS reports that mercury remains at many historic hydraulic mining sites and that it shows up in fish, amphibians and invertebrates downstream. Follow local fish advisories and never use mercury when prospecting.
This page is for information only. It is not legal or investment advice. Confirm the rules with the regulator. If you prospect, get permission, work safely and never use mercury.
Farmonaut mining
Check your claim area from space
Request a quote for a satellite review of your licence or claim area, ahead of any field work.
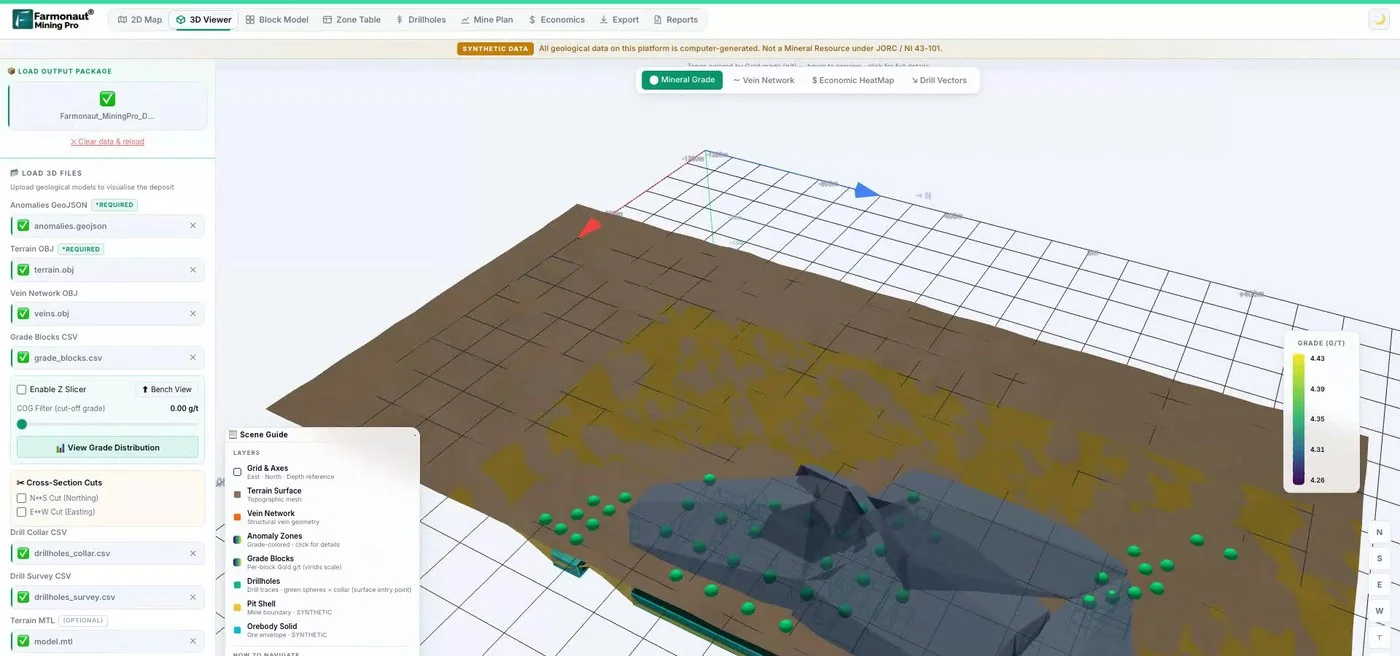
Mining Pro sample view, synthetic data
Keep reading
Sources
- US Census Bureau, Agriculture of the United States in 1860, introduction part 1: www2.census.gov
- US Census Bureau, Agriculture in 1860, introduction part 2: www2.census.gov
- US Census Bureau, Agriculture in 1860, introduction part 3: www2.census.gov
- Gilbert, Hydraulic-Mining Debris in the Sierra Nevada, USGS Professional Paper 105 (1917): pubs.usgs.gov
- USGS, Mercury contamination from historic gold mining in California, Fact Sheet 061-00: pubs.usgs.gov
- California State Parks, Malakoff Diggins State Historic Park: parks.ca.gov
- California Department of Food and Agriculture, statistics (2025 crop year): cdfa.ca.gov
- PBS American Experience, The Gold Rush: pbs.org
- Wikipedia, California gold rush: en.wikipedia.org
- Wikipedia, California (census population table): en.wikipedia.org
- Wikipedia, Prior-appropriation water rights: en.wikipedia.org
- Wikipedia, Wright Act of 1887: en.wikipedia.org
- Wikipedia, Hydraulic mining: en.wikipedia.org
Discussion
Questions, corrections or field experience? Share them below. First-time comments are reviewed before they appear, and your email is never published.
No comments yet. Be the first to add a question or your experience.

 Ramani Investments Ltd
 Congo Mining Solutions
 Mining SARL
 SenGold Invest SAS
 Sania Corporation
 Sean Mining Limited
 NTS Group (Pty) Ltd
 Mine4Africa
 Lithspo Minerals Limited
 Tintina Mining Group
 Dalgety Minerals Pty Ltd
 Vortex Minerals Pty Ltd
 Faith At Work (Pty) Ltd
 Geotech Mining Solutions plc
 Vulcan International Limited
 Kidepo Associates
 GKY Mining
 Alkimy SARL
 Double A Trading
 GemSprout Metals Limited

 Client · Somalia · Gold
 Client & affiliate partner · Ghana · Gold










