

Potash prices · Data and calculators
Potash Price per Tonne: Chart and Drivers
Potash averaged US$367.5 a tonne in September 2026 (World Bank, granular MOP, CFR Brazil) and US$502 a short ton at US retail dealers in early October (DTN). Here is why the two differ, what moves them, and two calculators.
Key takeaways
- Benchmark cargo price: US$367.5 a tonne in September 2026, after US$402.9 in April to June and US$383.6 in July to September (World Bank Pink Sheet, 2 October 2026).
- US retail: US$502 a short ton for 5 to 9 October 2026, up 4% on a year earlier and the first reading above US$500 since August 2024 (DTN). A short ton is 0.907 of a metric tonne.
- Four countries made about 76% of the world’s 49 million tonnes of K2O equivalent in 2025: Canada, Russia, China and Belarus (USGS, 2026 estimates).
- BHP’s Jansen Stage 1 is 84% complete with first production on track for mid-2027 at US$8.4 billion, about US$2,000 of capital per tonne of annual capacity (BHP filing; our arithmetic).
- At US$502 a ton, 0-0-60 potash costs about US$0.42 a pound of K2O, or around US$45 for the 180 pounds of potash per acre that a corn-soybean rotation removes (DTN; Ohio State Extension).
In this article
- The four potash prices people quote
- Potash price per tonne today
- US retail potash price per ton
- What moves the potash price
- Who supplies the world's potash
- Mine-gate price versus delivered price
- What a new potash mine needs to earn
- Potash price per acre: a fertilizer budget
- Where satellites and mining projects fit
- Environmental footprint of potash mining
- Frequently asked questions
Potash was priced at US$367.50 a tonne in September 2026 on the World Bank’s benchmark (granular muriate of potash, delivered to Brazil), and at US$502 a short ton at US farm-supply dealers in the week of 5 to 9 October 2026. The two numbers differ because they measure different things: one is a cargo price at a port, the other is a retail bid at the farm gate, in a different ton. This page lays out the main potash prices side by side, shows how they have moved over the last year, explains what moves them, and gives you two calculators: one converts a price into a fertilizer cost per acre, the other tests what a new mine’s capital cost means per tonne of capacity. Sources are linked on each figure, with the date of the data.
Three terms first. Potash is the name for potassium-bearing salts used mostly as fertilizer. Muriate of potash (MOP) is potassium chloride, the main product, and it is sold as 0-0-60, meaning about 60% K2O (the way potassium content is stated). CFR means cost and freight: the seller pays the shipping to the named port. Our guide to muriate of potash types and price covers the products, and an earlier look at potash prices covers the year before.
The four potash prices people quote
Search for a potash price and you will find four different kinds of number. Mixing them is the most common mistake in fertilizer budgets and in mining valuations. The table lists each kind with the latest reading and its date.
| Price type | What it measures | Latest reading | Source and date |
|---|---|---|---|
| Brazil CFR, granular MOP | Spot cargo price delivered to Brazil, per metric tonne | US$367.5 a tonne (September 2026 average) | World Bank Pink Sheet, 2 October 2026 |
| China annual contract | Price for 2026 supply to Chinese buyers, per tonne, CIFFO (cost, insurance and freight, with unloading paid by the buyer) | US$348 a ton | ICL filing, 23 December 2025 |
| US retail | Average dealer bid for red potash 0-0-60, per short ton | US$502 a short ton (5 to 9 October 2026) | DTN Retail Fertilizer Trends, 14 October 2026 |
| US mine gate | Average f.o.b. (on board at the mine) price of US producers, per metric tonne of K2O | US$600 a tonne of K2O for MOP (2025 estimate) | USGS Mineral Commodity Summaries, February 2026 |
To compare them, put them on the same unit. A US short ton is 2,000 pounds, or 0.907 of a metric tonne, so US$502 a short ton is about US$553 a metric tonne. A tonne of K2O is a tonne of the nutrient itself: because MOP is about 60% K2O, a tonne of K2O needs roughly 1.67 tonnes of product. The USGS mine-gate figure of US$600 a tonne of K2O therefore equals roughly US$360 a tonne of MOP product (our conversion at 60% K2O). That is close to the Brazil and China cargo prices, which is what you would expect before freight and dealer margins are added. The US retail number sits well above the others because it includes ocean and rail freight, storage, the dealer’s margin and the farm delivery.
Potash price per tonne today
The World Bank’s Pink Sheet is the cleanest public series because it states the basis (granular MOP, spot, CFR Brazil), publishes monthly and is revised on the record. The October 2026 edition, dated 2 October, shows the average price at US$403 a tonne in April to June 2026, then US$384 in July to September. By month, July averaged US$396.5, August US$386.9 and September US$367.5. So September’s average was about 9% below the second-quarter average, while the whole third quarter (US$383.6) stayed above the US$357.2 average of July to September 2025.
Chart
Potash benchmark price by quarter
US$ per metric tonne, granular MOP, spot, CFR Brazil, quarterly average
For the full years, the same table gives US$383.2 in 2023, US$295.1 in 2024 and US$347.5 in 2025. The 2025 average was about 18% above 2024 and about 9% below 2023. The World Bank’s April 2026 Commodity Markets Outlook, which sits on its commodity markets page, projected MOP to rise about 12% in 2026 and then fall about 6% in 2027, and described the global potash market as well supplied. A 12% rise on the 2025 average would be about US$389 a tonne. The first three quarters of 2026 averaged about US$387 (the mean of US$373.0, US$402.9 and US$383.6), so the outlook and the data so far are close.
US retail potash price per ton
If you buy for a farm, the number that matters is the delivered retail price. DTN collects bids from agricultural retailers every week and publishes the national average for eight fertilizers. For red potash it reported US$502 a ton for 5 to 9 October 2026, up 4% on a year earlier. DTN noted that this was the first time potash moved back above US$500 a ton since the second week of August 2024, when it averaged US$501. In the DTN tables, the average was US$495 in the 10 to 14 August 2026 week and US$494 in the 7 to 11 September 2026 week. The figures are in short tons, the US unit.
Chart
US retail potash price, weekly survey
US$ per short ton, red potash 0-0-60, national average of dealer bids; selected weeks
The weekly series shows why potash is the quiet fertilizer. Over twelve months it stayed in a band of about US$484 to US$502 a ton, while urea in the same DTN tables ranged from US$566 to US$866 a ton (the 29 December 2025 to 2 January 2026 reading to the 20 to 24 April 2026 reading). Urea moved far more than potash over the same period; potash did not.
What moves the potash price
Four forces explain most of the movement. Each has a data point you can check.
Supply is concentrated
The USGS estimates world potash mine production at 49 million tonnes of K2O equivalent in 2025, up from 46.7 million tonnes in 2024. Canada produced 15 million, Russia 10 million, China 6.3 million and Belarus 6 million. Those four countries together made about 76% of the world total. When one of them has a strike, a rail problem, a sanction or an export curb, the effect shows up in the spot price within weeks. The World Bank’s April 2026 outlook noted that Belarusian exports had been rising and that new supply from Canada and Laos was expected to keep the market supplied.
New mines arrive late and over budget
BHP’s Jansen mine in Saskatchewan is the biggest new project. In its filing for the year to 30 June 2026, BHP said Stage 1 is 84% complete, on track for first production in mid-calendar 2027, and that the total investment estimate rose to US$8.4 billion including contingencies. Stage 1 is expected to produce 4.15 million tonnes of potash a year once ramped up. For Stage 2, a further 4.36 million tonnes a year, BHP’s estimate rose to about US$6.9 billion, with first production expected in late financial 2031, and it booked a US$2.3 billion impairment (BHP 6-K). Delays like these keep new tonnes out of the market for longer than planners hoped, which can tighten supply later in the decade.
Freight and energy
Potash is a bulk cargo that moves by rail, barge and ship. The gap between the US$367.5 Brazil cargo price and the US$553 a tonne US retail average is not all margin: it contains ocean freight, port handling, rail, storage and dealer costs. The retail figure is a national average, and the DTN survey also reports regional prices.
Affordability and demand
The World Bank’s April 2026 outlook said potash affordability relative to food prices had stayed close to pre-2020 levels for five quarters. In the DTN weekly series, potash moved by a few dollars a week while nitrogen products moved by hundreds of dollars over the year.
Who supplies the world’s potash
The chart shows 2025 estimated mine production by country from the USGS. Canada is the largest producer. For reserves, the USGS lists Russia at 2 billion tonnes of K2O equivalent, Canada at 1.1 billion, Laos at 1 billion and Belarus at 750 million. The United States produced 0.5 million tonnes of K2O equivalent in 2025 and relied on imports for about 92% of what it used (USGS, 2025 estimate).
Chart
Potash mine production by country
Million tonnes of K2O equivalent, 2025 estimate
For investors, concentration is the key point. A handful of producers can adjust output and contract terms, and the spot price reflects who is short of supply that quarter. For consultants and licence holders, it explains why a potash project is judged on logistics (rail, port, brine or mine depth) as much as on grade.
Mine-gate price versus delivered price
The USGS publishes the average f.o.b. mine value of US potash producers, a figure close to what a miner actually receives. It is stated per tonne of K2O. For all potash products the average was US$1,120 in 2021, US$1,790 in 2022, US$1,250 in 2023, US$1,150 in 2024 and US$1,200 in 2025 (estimate). For MOP alone it was US$650, US$980, US$620, US$690 and US$600 over the same years. Prices peaked in 2022 and have been lower since.
Chart
US mine-gate price of MOP
US$ per metric tonne of K2O, f.o.b. mine; 2025 is an estimate
Two cautions apply when you read these numbers. First, US output includes higher-value products such as potassium sulfate and langbeinite, which is why the all-products average sits well above MOP. Second, the USGS figures cover US producers only. The chart above uses the MOP series.
What a new potash mine needs to earn
Potash mines are expensive because the ore sits deep and the shafts, plant and rail links cost billions of dollars before the first tonne ships. Jansen Stage 1’s US$8.4 billion for 4.15 million tonnes a year works out at about US$2,000 of capital per tonne of annual capacity (our arithmetic from the BHP figures above). The calculator below lets you test your own capital cost, capacity, price and deductions. Its defaults are the BHP Stage 1 figures; the price and deduction are inputs you should replace with today’s price and your own freight and royalty costs.
Mining investors should note that a high capital cost per tonne of capacity needs a long period of steady prices to repay. A simple revenue-over-capital check is not a valuation: it ignores operating cost, tax, royalties, sustaining capital and the time value of money. This page is not investment advice.
Calculator
What does a new potash mine’s capital mean per tonne?
Enter capital cost, capacity, a price and your own deductions.
- Net revenue per tonne: $250
- Net revenue a year at full rate (US$ million): $1,038
- Years of net revenue to equal capital: 8.1 years
Defaults for capital (US$8,400 million) and capacity (4.15 million tonnes a year) are BHP’s Jansen Stage 1 figures from its filing for the year to 30 June 2026. The price and the deduction for freight, royalties and marketing are inputs: enter today’s price and your own costs. The result is revenue over capital, not a valuation: it ignores operating cost, tax, sustaining capital and the time value of money. Amounts are in US dollars.
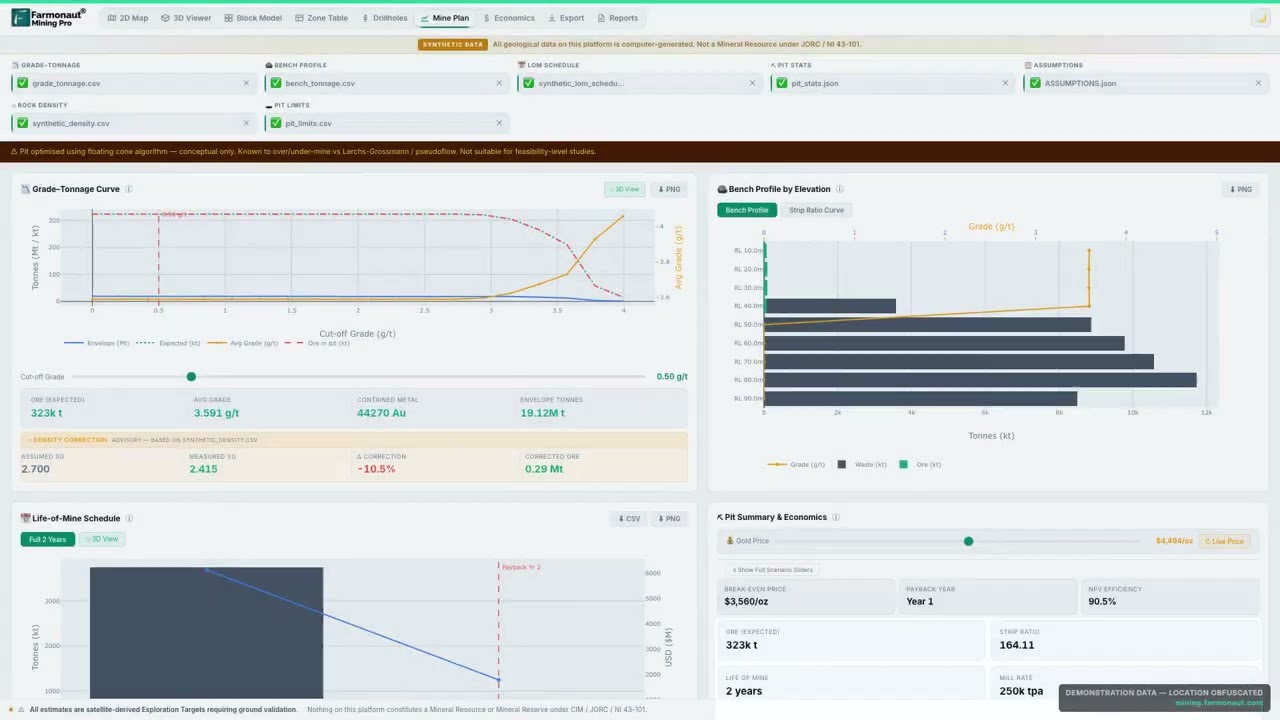
▶ Explains how to build a full mine cost picture: all-in sustaining cost, break-even price, NPV and payback. · 14:58
Potash price per acre: a fertilizer budget
For a farm, the price per ton matters less than the price per pound of K2O and the rate per acre. A ton of 0-0-60 holds 1,200 pounds of K2O (2,000 pounds at 60%), so at US$502 a ton the nutrient costs about US$0.42 a pound. A corn and soybean rotation that removes 100 to 120 pounds of K2O per acre in the grain, per Ohio State University Extension, is equivalent to about 180 pounds of potash per acre, which at this price would cost around US$45 per acre. Your soil test, not a rule of thumb, sets the actual rate. The calculator below converts your own price, grade and rate into cost per acre and for the whole farm.
Calculator
What does your potash cost per acre?
Enter your own dealer price, grade and application rate.
- Product needed per acre (lb): 100 lb
- Cost per acre: $25
- Cost for the whole area: $12,550
- Price per metric tonne of product: $553
The default price of US$502 a short ton is the DTN national average for 5 to 9 October 2026. Enter your dealer’s price. Grade 60% K2O is standard for 0-0-60 potash. The rate of 60 pounds of K2O is an example; use your soil test. A short ton is 2,000 pounds. Amounts are in US dollars and exclude spreading.
Where satellites and mining projects fit
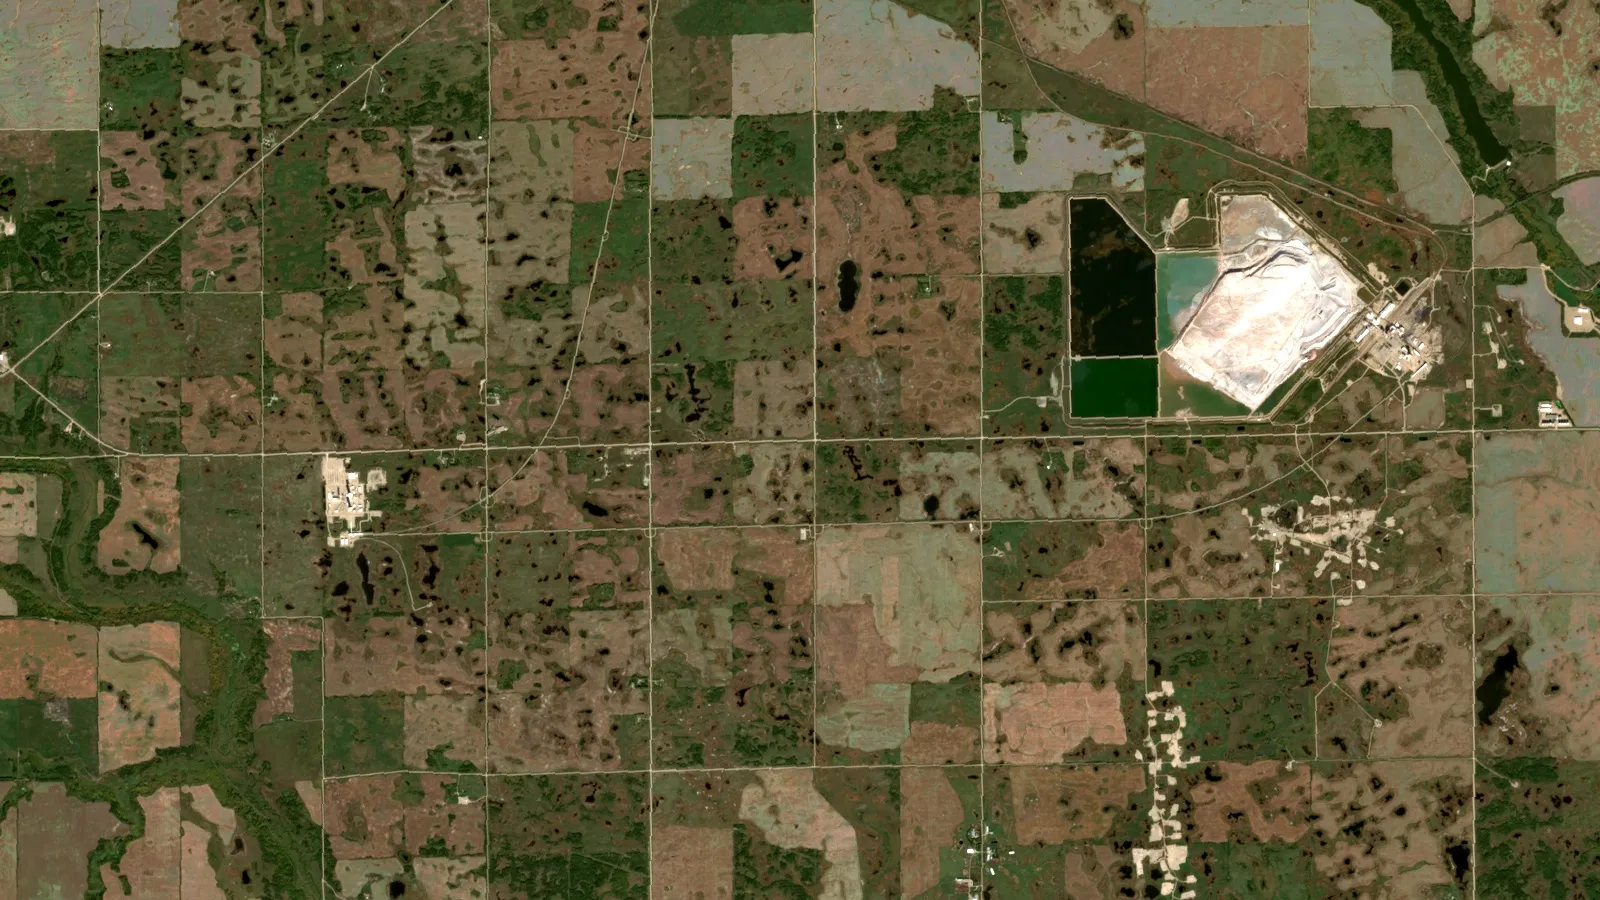
Potash is mined from evaporite basins, deep salt beds laid down by ancient seas. The ore sits deep: the USGS puts the main US resources in the Williston Basin at depths of 1,800 to 3,100 metres, and the Paradox Basin in Utah at more than 1,200 metres. Satellite imagery cannot see potash at that depth. Basin geology, drill data and seismic surveys do the work. Satellites help around the edges: mapping surface access and land use before a licence application, tracking stockpiles, brine ponds and tailings, and watching the environmental footprint over time. The mineral list Farmonaut states for its mineral detection service does not include potash. If your licence is for metals, our satellite mineral detection service works from a boundary file you supply. To compare potash with other bulk commodities, see our guide to iron ore, bauxite, phosphate and potash exploration.
Two related guides on this site cover the agronomy side: potash in Utah, a US producing region, and phosphate and potash use for yield. You can also send a project question through the mining query form or contact us.
Environmental footprint of potash mining
Solution mining and conventional shaft mining leave different marks. Conventional mines leave salt tailings piles on the surface that need long-term management, and brine operations use large evaporation ponds. The video below walks through seven general impacts of mining on land and water, which also apply to salt and fertilizer mines.

▶ Explains seven environmental impacts of mining in plain words, as a claymation with satellite maps. · 2:31
We cover a connected topic in Gold Price per Ounce: Chart and Drivers.
For a closer look at a related question, see our guide: Bauxite Price per Ton: Chart and Drivers.
Frequently asked questions
What is the potash price per tonne now?
On the World Bank’s benchmark (granular MOP, CFR Brazil) the September 2026 average was US$367.5 a tonne. US dealers were bidding an average of US$502 a short ton in the week of 5 to 9 October 2026 (DTN). These are different bases, so check which one your contract uses.
Why is the US retail price so much higher than the benchmark?
The retail number includes freight to the US interior, storage, dealer margin and application services, and it is in short tons. US$502 a short ton is about US$553 a metric tonne.
How do I convert potash price per ton to cost per pound of K2O?
Divide the price per ton by the pounds of K2O in a ton. For 0-0-60 that is 2,000 x 0.60 = 1,200 pounds. At US$502 a ton that is about US$0.42 a pound of K2O.
Which countries produce the most potash?
Canada (15 million tonnes of K2O equivalent in 2025, estimate), Russia (10 million), China (6.3 million) and Belarus (6 million), per the USGS. The world total was 49 million tonnes.
How high did the potash price go at its peak?
The US mine-gate price for MOP peaked in 2022 at US$980 a tonne of K2O, against US$600 in 2025 (estimate), per the USGS.
Is potash the same as muriate of potash?
Muriate of potash is the most common type of potash, potassium chloride. The USGS says potash also includes potassium sulfate and potassium magnesium sulfate (langbeinite), which are higher-value products (the USGS all-products average price is above the MOP average).
When will BHP’s Jansen mine start producing?
BHP’s filing for the year to 30 June 2026 says Stage 1 is on track for first production in mid-calendar 2027. Stage 2 is expected in late financial 2031.
Does the potash price follow oil and gas prices?
Less than nitrogen does. Nitrogen fertilizer is made from natural gas, so its price follows gas. Potash is mined, so energy affects it mainly through freight. In the DTN tables, urea moved between US$566 and US$866 a ton in twelve months while potash moved within about US$484 to US$502.
Where can I check the price myself?
The World Bank publishes the Pink Sheet on the first working days of each month. DTN publishes its retail survey weekly. The USGS publishes annual prices each February.
Is this investment advice?
No. The page reports published prices and company filings. It does not predict prices or recommend any purchase.
This page is for information only. It is not investment advice. Prices are published averages and change often; confirm quotes with your supplier or broker.
Farmonaut mining
Screen a mining project area from space
Investors can send a licence boundary as KML, KMZ or a polygon and receive satellite-derived exploration targets for supported minerals, ahead of any resource estimate.

Mining Pro sample view, synthetic data
Keep reading
Sources
- World Bank, Commodities Price Data (The Pink Sheet), 2 October 2026: thedocs.worldbank.org
- World Bank, Commodity Markets: worldbank.org
- World Bank, Commodity Markets Outlook, April 2026, price forecasts: thedocs.worldbank.org
- DTN, UAN32 Leads Fertilizer Prices Higher Again in First Week of October (14 October 2026): dtnpf.com
- DTN, Most Fertilizers Lower for First Time Since First Week of February (17 June 2026): dtnpf.com
- USGS, Mineral Commodity Summaries 2026: Potash (February 2026): pubs.usgs.gov
- BHP, Form 6-K with Jansen project update (FY2026): sec.gov
- ICL Group, Form 6-K, China potash supply agreements for 2026 (23 December 2025): sec.gov
- Ohio State University Extension, Nutrients Removed with Harvested Corn, Soybean, and Wheat Grain in Ohio: ohioline.osu.edu
- USGS, Mineral Commodity Summaries 2026 (full volume): pubs.usgs.gov
Discussion
Questions, corrections or field experience? Share them below. First-time comments are reviewed before they appear, and your email is never published.
No comments yet. Be the first to add a question or your experience.

 Enterprise Takreem
 Sean Mining Limited
 NTS Group (Pty) Ltd
 Mine4Africa
 Lithspo Minerals Limited
 Tintina Mining Group
 Dalgety Minerals Pty Ltd
 Vortex Minerals Pty Ltd
 Faith At Work (Pty) Ltd
 Geotech Mining Solutions plc
 Vulcan International Limited
 Kidepo Associates
 GKY Mining
 Alkimy SARL
 Double A Trading
 GemSprout Metals Limited
 Qader Group
 Ileys General Trading
 SG Gold Mining LLC
 VRV Global Pte Ltd
 Omsri International FZE
 G.I.T.T.
 Jaunita Erss Ltd
 SRK Consulting
 Berks Gold Limited










