

Client case study · Gold · Oregon, USA
How Solutions For You, LLC Mapped 3 Gossan-Style Gold Targets on a 24-Acre Claim in Southwest Oregon
Solutions For You, LLC used satellite gold exploration in Oregon to narrow a 24-acre claim to 3 gossan-style gold targets covering about 2 acres. The report ranked each target, gave its depth and set out a drill plan, and the client reports saving more than 6 months and up to US$25,000.
Key takeaways
- Solutions For You, LLC, an Oregon company on the state business registry since 1996, narrowed a 24-acre gold claim in southwest Oregon to 3 target zones covering about 2 acres, about 8% of the ground.
- The report reads an iron-oxide gossan signature at all three targets, with strong radar and structural evidence under a dense forest canopy.
- All three zones start about 148 to 157 feet below surface, and the report gives each one a drill direction, angle and hole length.
- A first scout programme of 3 holes, about 360 metres, is put at about US$54,000 to US$90,000 on the report’s planning band.
- The client reports saving more than 6 months and up to US$25,000. These are the client’s own estimates.
In this article
- Who Solutions For You is and what the project set out to answer
- Why a small gold claim in southwest Oregon needs a sharp starting point
- How satellite gold exploration in Oregon worked on this claim
- The iron hat: three gossan-style gold targets
- How much gold the report models, and where the 10x comes from
- Depth and access: what it takes to reach the targets
- The drill plan: three scout holes, then six
- What Solutions For You reports: more than 6 months saved
- What other claim holders can learn from this case
- Satellite gold exploration Oregon: frequently asked questions
Who Solutions For You is and what the project set out to answer
Solutions For You, LLC is a Farmonaut mining client in Oregon, in the western United States, and the company the report was prepared for. Oregon’s public business registry lists Solutions For You L.L.C. as a domestic limited liability company registered with the Oregon Secretary of State in May 1996, which puts it close to three decades in business in the state.
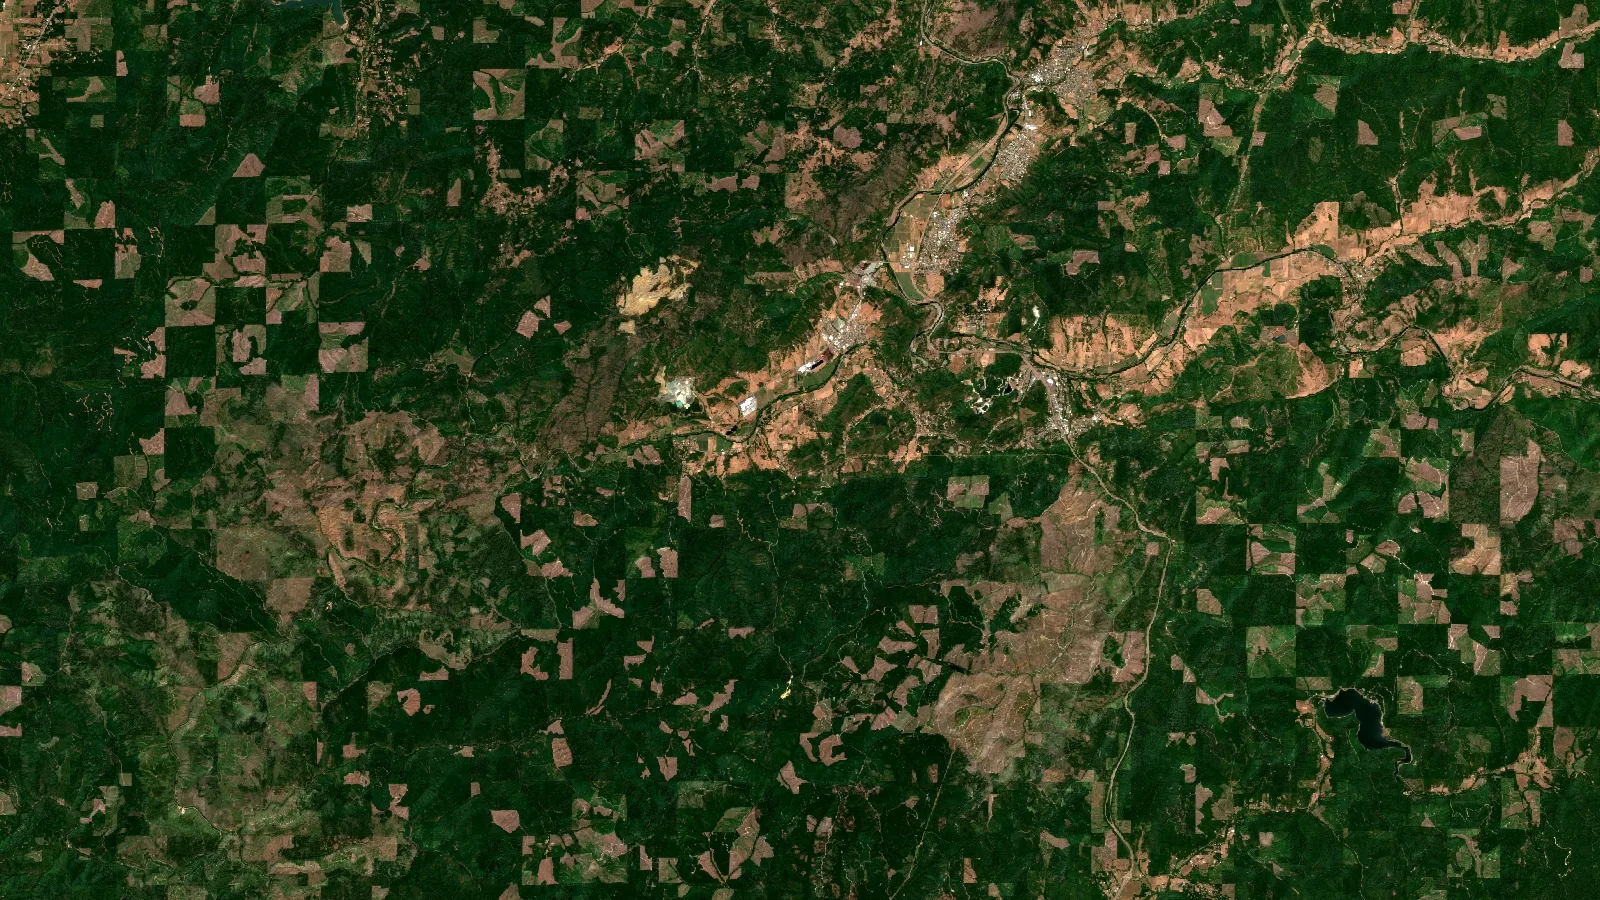
The ground in this case study is a gold claim of about 24 acres, just under 10 hectares, in the forested mountains of southwest Oregon. That part of the state has a long record of gold prospecting and mining, and the US Geological Survey’s Mineral Resources Data System lists a dense scatter of historical gold workings across the region. It is country that rewards people who know it well, and it is also country that hides its rock under trees, soil and steep slopes.
The company is not new to this ground. Solutions For You told us about some 20 years of research on the site, backed by historical data that state and federal agencies have compiled on the area. About five earlier geology reports have been written on it, and a proton-magnetometer survey on the ground gave a strong signal there.
The company also described a white hydrothermal band, about 30 feet wide, running across the ridge, and told us that assays from samples collected over the years show high arsenic. Arsenic is a common companion of gold in many hydrothermal systems, which is one reason prospectors assay for it. The company’s own reading of the geology is that the band could mark a large copper porphyry. That is the client’s hypothesis, not a finding of this study: the report was a gold-only survey, and testing for copper would be a separate study.
That background is what makes a satellite study useful rather than redundant. Years of research, earlier reports and a magnetometer signal say that the ground is interesting. A satellite gold study adds a claim-wide map that ranks exactly where on the claim the strongest gold signatures sit, how deep they are estimated to start and how to drill them, in a form that can be laid over everything gathered before. Solutions For You told us more claims are likely to follow, so the same approach can be repeated across the rest of the holdings.
The question the company brought to us was a practical one. On a claim this size, where exactly should the first serious exploration money go, how deep would a hole have to reach, and what would a first drilling programme look like? A satellite study answers the first two questions for the whole claim at once and gives the third a starting plan.
The project used our satellite-based mineral detection service at the Premium level. The company drew the claim boundary on our online mapping tool, chose gold and placed the order. The finished report, a 58-page document with a full data pack, was delivered six days later.
Solutions For You gave us that statement on our client feedback form, with permission to publish it. Two parts of it map directly onto the report. The “iron hat gossan identification in 3 spots” is the heart of what the satellite analysis found, and we explain it in detail below. The “10 x outcome” refers to the report’s own upside table, which shows how the gold estimate grows if drilling finds more of each zone to be ore than the report’s deliberately cautious base case counts.
On the same form, the company confirmed that the analysis helped narrow down locations, reduced time and reduced cost. The claim has not been drilled yet. Drilling is planned, and the report gives a clear plan for it.
Why a small gold claim in southwest Oregon needs a sharp starting point
A 24-acre claim sounds small, and on a map it is. On the ground it is a different matter. This one sits on steep, forested slopes, with a mean slope of about 27 degrees in the report and a dense tree canopy across almost all of it. Walking, mapping and sampling ground like that is slow, and in a forest most of the rock that a prospector would want to look at is out of sight.
Every early method of finding a place to drill carries a cost before the first hole goes in:
- Walking the ground: geological mapping shows what is exposed, but under a forest canopy there is little bare rock to map, and steep slopes make each day of fieldwork slow.
- Soil and rock sampling: sampling gives real chemistry, but a proper grid across a whole claim needs crews, access and laboratory fees for every sample.
- Ground geophysics: magnetic and electrical surveys can see below the surface, but they need specialist crews and equipment on site, often at a day rate.
- Drilling on instinct: the fastest way to get an answer, and the most expensive way to get a wrong one.
Satellite analysis sits in front of all of these. It does not replace them. Its job is to tell a claim holder which small part of the ground deserves attention first, so that the mapping, the sampling and the drill rig all start in the same place.
That was the job on this claim. The report gave the 24 acres an order of priority, with depths, shapes and drill directions attached to each target. Field work could then concentrate on about 2 acres instead of 24.
How satellite gold exploration in Oregon worked on this claim
The client’s part was simple. The company outlined the claim on the mapping tool and named gold as the target mineral. No one needed to visit the site, and no ground was disturbed. Everything that follows was done from satellite, radar, magnetic and terrain data.
Infographic
How the claim moved from a boundary to a drill plan
- 1Draw the boundaryThe client outlined the 24-acre claim on our online mapping tool and chose gold.
- 2Analyse from spaceMore than 21 satellite, radar, magnetic and terrain layers were fused into one gold potential map.
- 3Filter the targetsA four-stage filter kept only coherent signals, leaving three gossan-style zones.
- 4Plan the drillingEach zone received a depth, a direction, an angle and a hole length.
- 5Scout and confirmThree scout holes come first, then a fuller programme if results support it.
Forested ground is the hardest kind of terrain for optical satellites, because leaves cover the rock. The analysis was built for exactly that. It combined more than 21 data layers into one Gold Potential Index at 10-metre detail, and it leaned on the sensors that see through or around the canopy:
- Sentinel-2: this European mission supplies detailed visible, near-infrared and shortwave-infrared images, used for alteration minerals and for vegetation stress.
- ASTER: the ASTER instrument maps shortwave-infrared signatures of clay, sericite and iron-bearing minerals, and its emissivity data help separate rock types.
- L-band radar: ALOS-2 PALSAR-2 uses a long radar wavelength that partly passes through the canopy and responds to the structure and roughness of the ground beneath.
- C-band radar: Sentinel-1 adds frequent radar passes in all weather, day and night.
- Thermal data: MODIS land surface temperature and ASTER thermal bands look for persistent warm or cool spots linked to rock and oxidation.
- Magnetics: the EMAG2 magnetic anomaly grid gives the regional magnetic picture, which helps place intrusions and structures.
- Elevation: a digital elevation model, including the SRTM record, supplies slope, ridges, drainage and lineaments.
Each layer adds a different line of evidence. Optical and infrared data look for altered rock. Radar looks for structure and texture under the trees. Magnetics and terrain show the faults and intrusions that gold-bearing fluids tend to follow. The Gold Potential Index rewards places where several of these agree, and the report then runs every candidate through a four-stage filter that removes weak, edge-of-image or covered signals. On this claim, less than 30% of the first-stage target area survived all four filters, which is the conservative funnel the method is designed to be.
▶ How satellites look for signs of gold, explained through a real report. · 18:54
The report then breaks the evidence into seven signal families for every target: hydrothermal alteration, thermal, radar and subsurface roughness, magnetics, structure, vegetation biogeochemistry, and surface exposure and drainage. That breakdown lets a geologist see which kinds of evidence agree on a target and which are quiet, rather than relying on a single score.
The iron hat: three gossan-style gold targets
The analysis found three target zones on the claim. Together they cover about 2 acres, 0.82 hectares, which is about 8% of the ground checked. That is the core of the “3 spots” the client picked out in the feedback, and it is the most useful single result in the report: on a forested claim with little exposed rock, the satellite data point to three small, defined places where the surface carries the signature of an oxidised cap.
Chart
Target zones cover about 8% of the claim
Acres, across the claim checked
A gossan, often called an iron hat, is the rust-coloured, iron-oxide-rich cap that forms where sulphide minerals weather near the surface. Prospectors have used gossans as a pointer to buried mineralisation for centuries. In the report, the concession-wide mineralisation style is classed as Gossan Zone, and the report states that all three zones show a gossan signature.
The report goes one level deeper for each target. It labels Zone 1 and Zone 2 as gossan-zone targets, and Zone 3 as an argillic shear, a fault zone where hot fluids have altered the rock to clay, sitting inside the same iron-oxide alteration footprint. All three targets fall within what the report calls the diagnostic alteration triplet for low-sulphidation epithermal gold: iron-oxide enrichment at the surface, sericite (white mica) alteration around it, and a felsic-to-intermediate host rock.
Here is how the three targets compare. We use the zone numbers from the report so the figures can be matched to the drill plan later in this article.
| Target zone | Style in the report | Footprint | Strike × width | Estimated depth | Drill priority | Share of modelled gold |
|---|---|---|---|---|---|---|
| Zone 2 | Gossan zone | 0.68 acres | 327 × 120 ft | 157–272 ft | Tier 2, high interest | 45.8% |
| Zone 3 | Argillic shear | 0.79 acres | 327 × 240 ft | 148–262 ft | Tier 3, follow-up | 27.8% |
| Zone 1 | Gossan zone | 0.56 acres | 240 × 164 ft | 154–269 ft | Tier 3, follow-up | 26.3% |
| All 3 zones | 2.03 acres | 148–272 ft | 100% |
Source: Farmonaut detection report for Solutions For You, LLC, 19 October 2026. Depths are vertical, from the top to the base of each modelled zone. Shares are of the report’s central gold estimate and are rounded.
Zone 2 leads. It holds almost half of the gold modelled on the claim and carries the highest estimated grade of the three. It is also the only zone where vegetation stress is strong: the report finds marked suppression of plant vigour over it, ranked at the very top of the claim. Plants growing over metal-rich ground often show that kind of stress, so it adds an independent biological line of evidence to the radar and structural signals.
Chart
Zone 2 holds almost half of the modelled gold
Share of the report’s central gold estimate, %
Across the three zones, the signal picture is consistent:
- Radar and subsurface roughness: strong at all three zones, from the combined L-band and C-band radar.
- Structure and lineaments: strong at all three zones, with dense lineaments and an east-west dominant strike.
- Hydrothermal alteration: moderate at all three zones, the shortwave-infrared clay, sericite and iron-oxide evidence behind the gossan reading.
- Magnetics: moderate at all three zones, which the report reads as consistent with a buried intrusive source, the heat engine of an epithermal gold system.
- Vegetation stress: strong at Zone 2.
The report also gives each zone a structural confidence score based on how well it lines up with mapped faults and fractures. All three score between about 157 and 174, against a threshold of 100 that the report treats as well defined. Continuity along each zone scores between about 89 and 94 out of 100, and the report found no signal drift between the zone-average and pixel-level evidence for any target.
One more clue fits the picture. The report’s placer and drainage scores are low across all three zones, and no mapped stream crosses them. It reads the targets as more consistent with bedrock-hosted vein systems than with gold washed into gravels, which is the drillable, hard-rock category a claim holder usually wants.
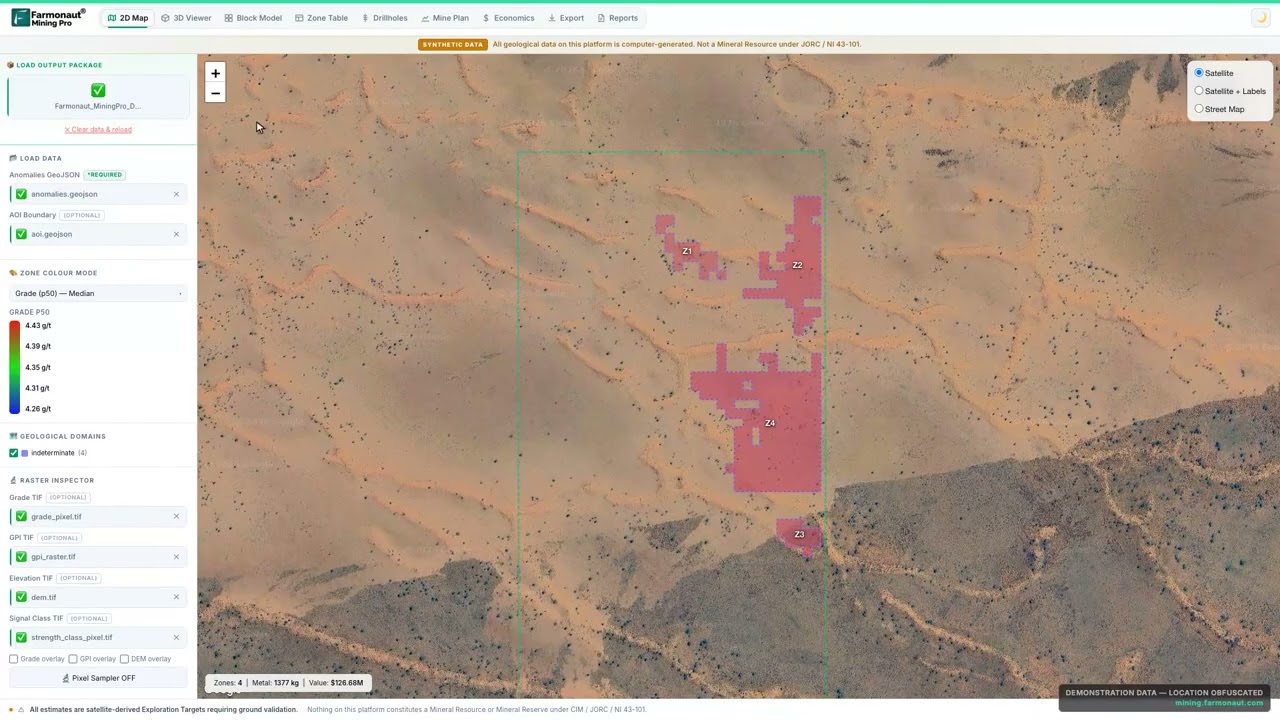
▶ What a Gold Potential Index is and how it ranks ground. · 3:25
How much gold the report models, and where the 10x comes from
The report sets out its quantity estimate with care. It models about 13,500 tonnes of target rock across the three zones, at estimated grades of about 0.64 to 1.27 grams of gold per tonne. Its central estimate of contained gold is about 390 troy ounces, or 12.1 kg. Gold in the ground is never all recovered in a plant, so the report also tests three recovery cases, from about 72% to 87%. Those cases give a band of about 282 to 341 troy ounces, 8.8 to 10.6 kg, of recoverable gold.
That central estimate is deliberately cautious. Satellite data can map where a mineralised zone is and how big it is, but they cannot see how much of that zone is ore. So the report counts only about 2% of each zone’s rock as ore in its base case, and says so plainly. It then shows what happens if drilling finds a larger share. That table is the source of the “10 x outcome” in the client’s feedback.
Chart
How the gold estimate scales with the share of ore
Modelled contained gold, troy ounces, by multiple of the report’s base case
At twice the base share, the estimate becomes about 780 ounces. At five times, about 1,950 ounces. At ten times, about 3,900 ounces, or 121 kg, and at twenty times about 7,800 ounces. These are the report’s own scenarios, not forecasts, and they show the range of outcomes the first drill holes will narrow down.
The report then asks the question every claim holder cares about: under what conditions would a mine pay? At its cautious base count, it does not yet show a paying pit, and it is direct about what would change that. If the gold turns out to be concentrated in the richest rock, a conventional open pit with its own mill begins to pay at about ten times the base estimate. On a cheaper heap-leach route, suited to small, oxidised, near-surface gold, the report finds the case begins to pay from about five times the base estimate. The deciding factor is how much of each zone is ore, and that is precisely what a short scout drilling programme measures.
If you want to test the same arithmetic on a target of your own, the calculator below turns tonnage and grade into contained gold and a gross value. Gross value is simply gold multiplied by price. It does not subtract mining, processing or any other cost, so it is a way to compare targets, not a forecast of profit.
Calculator
What is a gold target worth on paper?
Enter your own target. All amounts are in US dollars.
- Contained gold (kg): 10.0
- Contained gold (troy oz): 322
- Value after recovery (US$): $1,028,823
Example values only, not a benchmark, and not related to this project. 1 troy ounce is 31.1035 g. The gold price is an example, so check today’s price. Gross value is before mining and processing costs.
Depth and access: what it takes to reach the targets
A target is only useful if a project can reach it. The report answers three practical questions for each zone: how deep it starts, how deep it goes and what sits around it.
All three zones are estimated to start at about 148 to 157 feet below the surface, 45 to 48 metres, and to extend to about 262 to 272 feet, 80 to 83 metres. Each zone is modelled as about 115 feet, 35 metres, thick. Those depths are well within reach of standard diamond-core drilling, and the report notes that they also sit within the range of an open pit.
Chart
Estimated depth of each target zone
Feet below surface, top to base of each zone
The near-identical depths are useful in themselves. Three targets that start and end at similar levels suggest a consistent system, and they let a drilling contractor plan one hole design for all three. The report’s grade range across the zones, from about 0.64 to 1.27 g/t, is narrow too, and it reads that as a sign of consistent fluid chemistry, which is a good sign for predictable metallurgy later on.
Two more checks help field planning. The nearest mapped stream is about 150 metres from the closest zone, and the nearest building is about 2 kilometres away, so the targets sit clear of both. The report rates terrain access as low because of the steep, forested slopes, which means a drill pad and access track should be planned with the contractor early, and its steep-slope note recommends a geotechnical review before any mine design.
What the company received went beyond the PDF report. The data pack included a GeoTIFF map of gold potential across the whole claim, per-pixel grade and signal-strength rasters, GeoJSON outlines of every zone, a terrain model, a coordinate table with a map link for each corner of each target, and 22 imagery layers each with its own colour key. A geologist can open these in standard mapping software and lay them over field notes or historical data.
The drill plan: three scout holes, then six
A map of targets is useful, but a claim holder also needs to know how to test them. For each zone, the report gives a suggested drilling direction, angle, hole length and hole count, and it builds those into a phased programme with a planning-grade cost band.
The idea behind the direction is simple. A hole drilled across a target tests it better than one drilled along it. All three zones strike roughly east to west, so each suggested hole points due south, at an azimuth of about 180 degrees, and is angled 63 degrees below horizontal.
| Target zone | Direction | Angle | Suggested hole length | Method | Holes |
|---|---|---|---|---|---|
| Zone 2 | 180° | -63° | 348 ft (106 m) | HQ diamond core | 2 |
| Zone 3 | 180° | -63° | 335 ft (102 m) | HQ diamond core | 2 |
| Zone 1 | 180° | -63° | 343 ft (105 m) | HQ diamond core | 2 |
| Total | 6 |
Source: Farmonaut detection report for Solutions For You, LLC, 19 October 2026. Directions are rounded. A geologist and drilling contractor confirm the final plan on site.
The report’s first recommendation is a small, decisive step: one scout hole per zone. That is three holes and about 360 metres of core, which the report puts at about US$54,000 to US$90,000 using an all-in band of US$150 to US$250 per metre, and about 12 rig-days of drilling. The scout holes test exactly what the satellite data cannot: the grade, how concentrated the gold is and where it starts.
Chart
Planning-grade drilling cost bands
US$ thousands, low to high, at US$150 to US$250 per metre
The full programme follows only if the scout results support it:
- Phase 1, scout and confirm (months 0 to 6): one scout hole on each zone, then two core holes each on Zones 2 and 3, plus a composite sample of about 200 pounds for bottle-roll and column-leach metallurgy, and detailed geological mapping at 1:1,000 scale.
- Phase 2, expand (months 7 to 12): confirmation holes on Zone 1, a ground magnetic and induced-polarisation survey across the target area, and a resource estimate to a recognised standard.
- Phase 3, pre-feasibility (months 13 to 24): infill drilling on a 25 by 25 metre grid, geotechnical and environmental baseline work, and permitting engagement.
The full six-hole programme comes to about 719 metres and about US$108,000 to US$180,000 on the same planning band. A real contractor quote supersedes these figures, and the calculator below lets you enter your own.
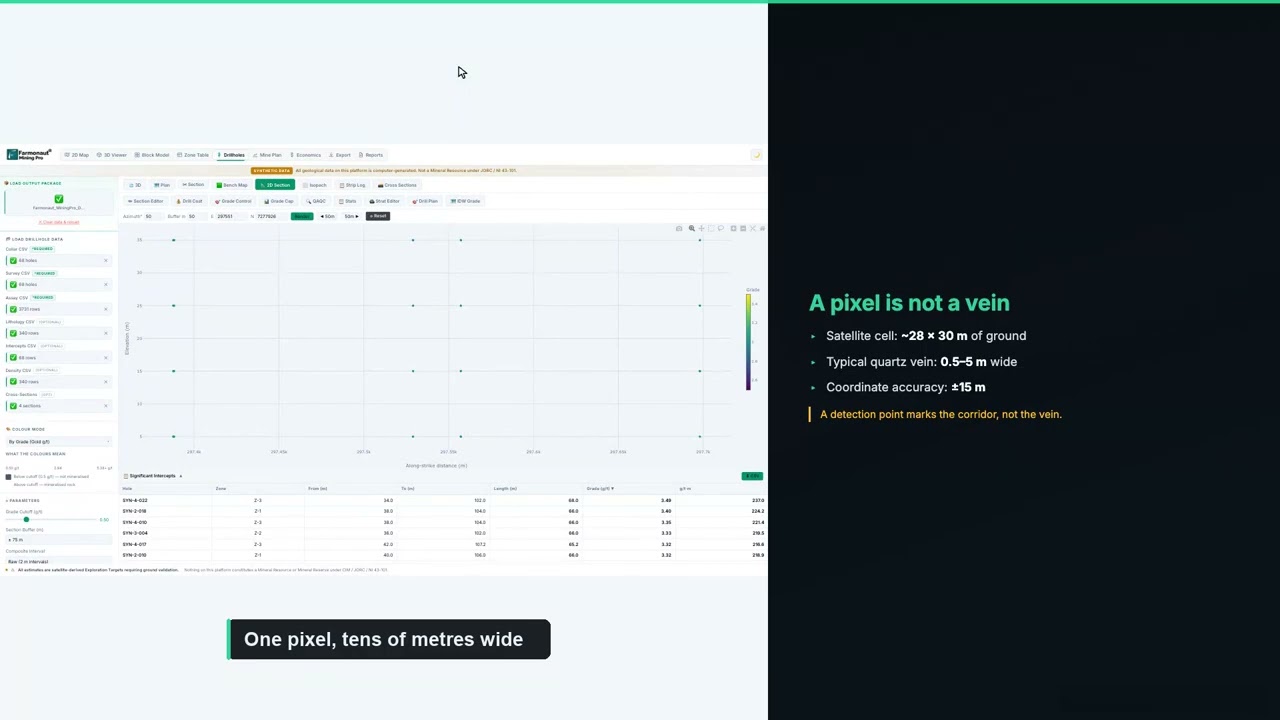
▶ How to plan a drilling programme once you have targets. · 5:49
If you are budgeting a similar programme, enter your own contractor’s rates below. The default values are round examples, not typical prices, because costs vary widely with location, rock type, access and rig availability.
Calculator
What would a first drill programme cost?
Enter your contractor’s quote. All amounts are in US dollars.
- Total metres: 1,000
- Cost per hole (US$): $12,500
Example values only, not typical prices. Costs vary with location, rock type and rig availability, so use real quotes from your contractor and laboratory.
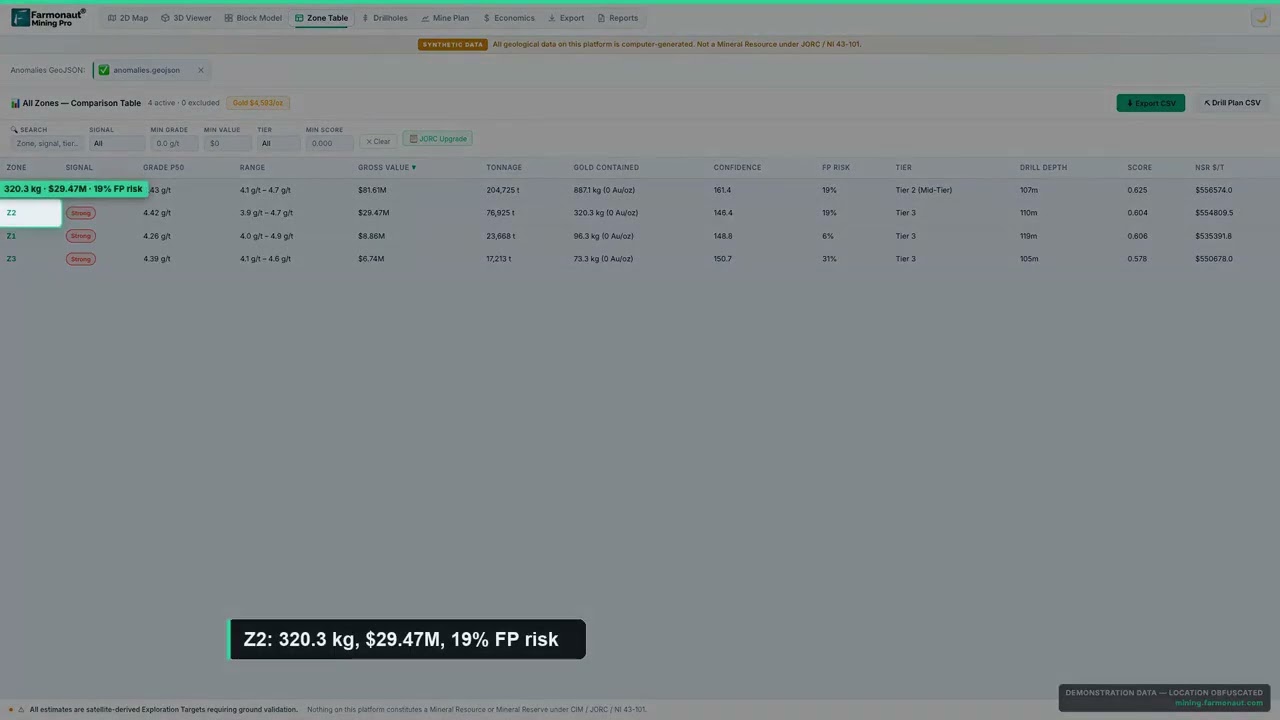
▶ How the confidence label on each satellite target is built. · 4:36
What Solutions For You reports: more than 6 months saved
Solutions For You, LLC completed our client feedback form on 9 November 2026. Here is what the form records, in the client’s own selections:
- Narrowed locations: yes. The analysis helped narrow down where to look.
- Time: yes, it reduced time, with savings in the band of more than 6 months.
- Cost: yes, it reduced cost, with savings in the band of up to US$25,000.
- Drilling: planned. The claim has not been drilled yet, and drilling is expected more than six months out.
- Testimonial: yes, the company agreed to share a statement with us.
The time answer is the largest band on our form. It fits a claim like this one. On steep, forested ground, the slow part of exploration is finding where to start: weeks of walking, mapping and sampling under trees, followed by months of waiting on results before a drill target is clear. A satellite study replaces that first search with three defined targets and a hole design, delivered in under a week.
The cost answer fits too. Money saved at the targeting stage is money that can go to the scout holes instead. With three holes costing about US$54,000 to US$90,000 on the report’s planning band, every dollar not spent on a blind search is a dollar toward the measurement that matters.
The testimonial looks ahead. The company picked out the gossan identification in three spots, the part of the report that ties the satellite evidence to something a prospector can walk up to and recognise on the ground. The testimonial also reads the report’s upside table the way it is meant to be read, as a set of possible outcomes for the first drilling to decide between.
The work also suits a lighter way of exploring. Because the targeting happened from space, nothing was dug, cleared or driven across during that stage. Field disturbance can be limited to three small sites that have earned a closer look.
What other claim holders can learn from this case
Several parts of this project carry over to other small gold claims, in Oregon, elsewhere in the western United States, or anywhere the rock is hidden under forest.
- Small claims still need a plan: on 24 acres, satellite targeting narrowed the first field work to about 2 acres.
- Forest is not a barrier: L-band radar, structure and vegetation stress carried the evidence where optical images could not see the rock.
- Look for the iron hat: a gossan reading gives a prospector something concrete to check on the ground before drilling.
- Read the base case as a floor: the report’s cautious count and its upside table together show what the first holes need to prove.
- Scout first: three holes at a known cost answer the question that decides everything else.
- Use the data files in the field: zone outlines and corner coordinates on a GPS make each target easy to find.
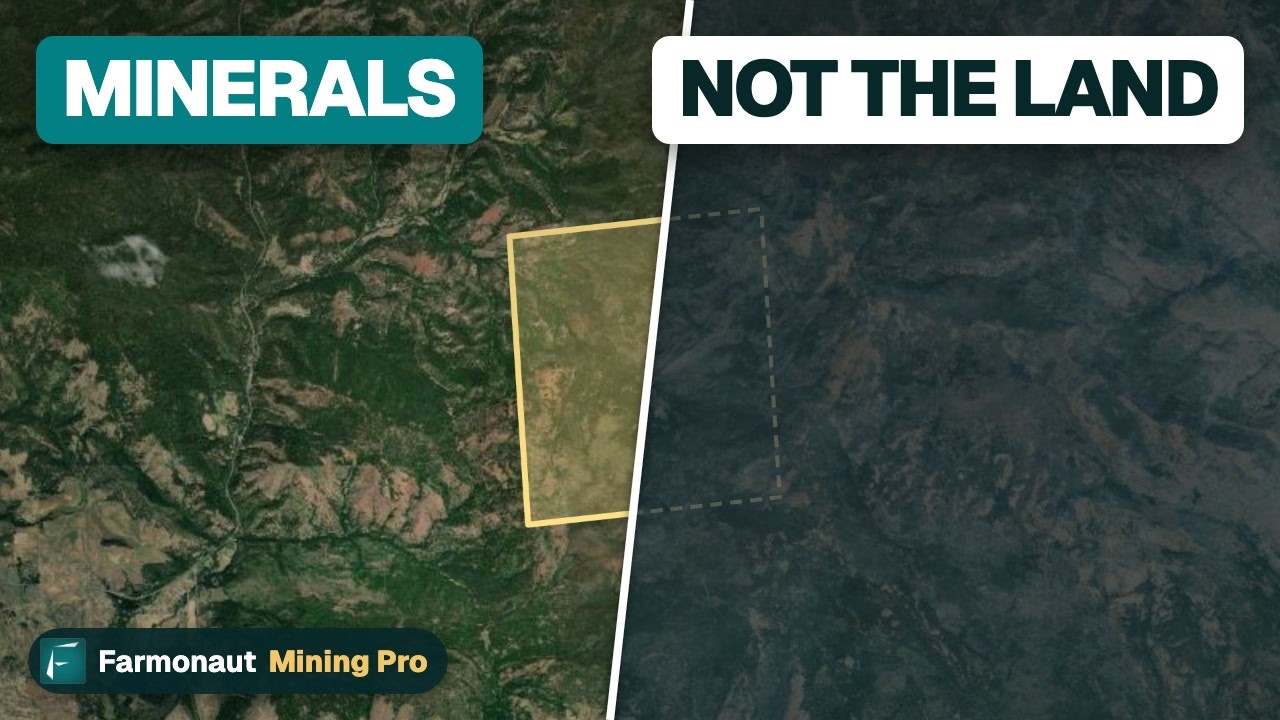
▶ What holding a gold claim does and does not give you. · 3:19
Getting a similar study for your own ground follows the same steps. Draw your boundary on the mapping tool, or send it as coordinates, a KML or KMZ file, or a polygon, and name your target mineral. Delivery usually takes 5 to 20 business days, depending on the size of the area and the mineral. You can map your mining site yourself or get a quote from our team.
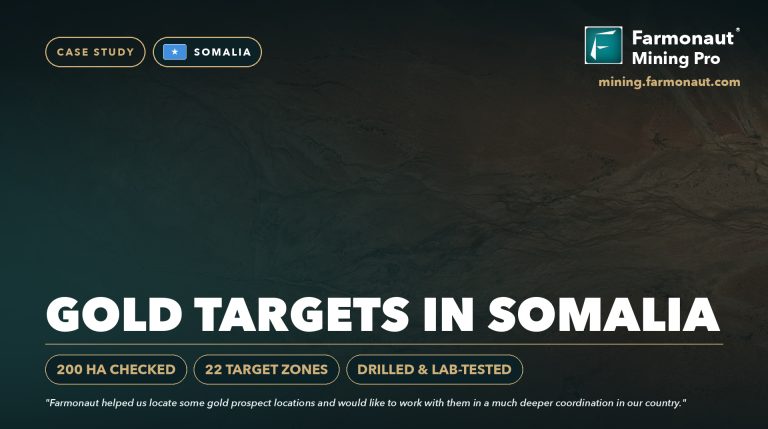
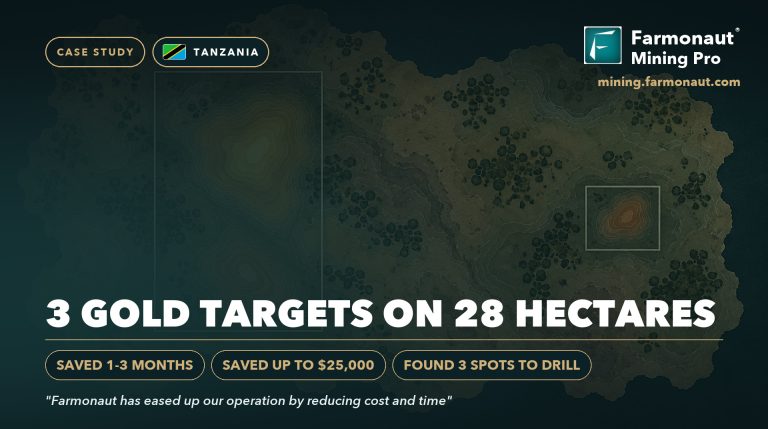
Want to see the same approach on other ground? Read how Ileys General Trading took satellite targets through to drilling in our Somalia gold case study, or see our Tanzania gold case study.

▶ A documentary on the modern race to find new gold. · 10:44
Satellite gold exploration Oregon: frequently asked questions
What did satellite gold exploration find on the Solutions For You claim in Oregon?
It found three gossan-style gold targets on a claim of about 24 acres in southwest Oregon. Together they cover about 2 acres, about 8% of the ground. Each target came with an estimated depth, a share of the modelled gold and a suggested drill hole.
Who is Solutions For You, LLC?
Solutions For You, LLC is a Farmonaut mining client and an Oregon company on the state business registry since 1996. It commissioned a satellite gold study of a 24-acre claim in southwest Oregon and shared a testimonial for publication.
Did the report test the copper porphyry idea?
No. The company told us that a white hydrothermal band about 30 feet wide crosses the ridge and may mark a large copper porphyry, but that is the client’s own hypothesis. The Farmonaut report was a gold-only survey. Copper can be added as a separate study on the same boundary.
What is a gossan, or iron hat?
A gossan is the rust-coloured, iron-oxide-rich cap that forms where sulphide minerals weather near the surface. Prospectors use it as a pointer to mineralisation below. On this claim, the report reads a gossan signature at all three targets.
How much time and money did the client save?
The company reported saving more than 6 months and up to US$25,000 on our feedback form. These are the client’s own estimates for this project.
What does the “10x” in the testimonial refer to?
The report counts only about 2% of each zone’s rock as ore in its cautious base case, then shows how the estimate grows if drilling finds a larger share. At ten times the base share, the modelled gold rises from about 390 to about 3,900 troy ounces. Drilling decides which scenario is closest to the truth.
Can a satellite detect gold under a forest?
Satellites do not detect gold directly. They detect signs linked with gold, such as altered rock, iron oxides and structures. Under a forest, L-band radar, terrain structure and vegetation stress carry much of that evidence. Drilling and laboratory assays confirm gold and its grade.
How deep are the targets?
The report estimates that all three zones start about 148 to 157 feet below the surface and extend to about 262 to 272 feet, which is within reach of standard diamond-core drilling.
What would a first drilling programme cost?
The report suggests one scout hole per zone, about 360 metres in all, at about US$54,000 to US$90,000 on a planning band of US$150 to US$250 per metre. A contractor’s quote replaces that estimate.
Is this a resource under S-K 1300, NI 43-101 or JORC?
No. The report gives an exploration target, which comes before a resource estimate. A resource under S-K 1300, CIM definition standards or JORC needs drilling, assays and a qualified person’s work.
How long does a satellite gold report take?
Delivery usually takes 5 to 20 business days, depending on the size of the area and the mineral. This 24-acre claim was delivered six days after the order.
What do I need to send to get a report for my own claim?
Draw your boundary on our mapping tool, or send it as coordinates, a KML or KMZ file, or a polygon, along with your target mineral. You do not need a site visit.
Published with the client’s consent. The “10 x outcome” in the testimonial is the client’s own reading of the report’s upside scenarios; every figure in this article is the report’s own estimate. All resource figures are satellite-based exploration targets and are not Mineral Resources or Mineral Reserves under S-K 1300, NI 43-101, JORC or similar codes. The claim has not yet been drilled, so no grade has been confirmed by assay. Time and cost savings are client-reported bands. Nothing here is investment advice. The exact location is withheld.
Farmonaut mineral detection
Map your mining site from space
Send your claim or licence boundary as KML, KMZ or a polygon. Farmonaut returns ranked satellite exploration targets for it, usually in 5 to 20 business days.

Keep reading
Sources
- Oregon Secretary of State, Active Businesses register (data.oregon.gov): data.oregon.gov
- US Geological Survey, Mineral Resources Data System: mrdata.usgs.gov
- Bureau of Land Management, Mining claims: blm.gov
- Oregon DOGAMI, Mineral Land Regulation and Reclamation: oregon.gov
- European Space Agency, Sentinel-2 mission (SentiWiki): sentiwiki.copernicus.eu
- European Space Agency, Sentinel-1 mission (SentiWiki): sentiwiki.copernicus.eu
- NASA JPL, ASTER instrument: asterweb.jpl.nasa.gov
- JAXA EORC, About ALOS-2 and PALSAR-2: eorc.jaxa.jp
- NOAA NCEI, Earth Magnetic Anomaly Grid (EMAG2): ncei.noaa.gov
- NASA LP DAAC, MODIS land surface temperature (MOD11A2 v061): lpdaac.usgs.gov
- USGS EROS, Shuttle Radar Topography Mission: usgs.gov
- Encyclopaedia Britannica, Gossan: britannica.com
- JORC, Australasian Code for Reporting (2012): jorc.org
- US eCFR, Regulation S-K subpart 1300, mining property disclosure: ecfr.gov
- CIM, Definition Standards for Mineral Resources and Reserves: cim.org
- LBMA, Precious metal prices: lbma.org.uk
- UNEP, Minamata Convention on Mercury: minamataconvention.org
Discussion
Questions, corrections or field experience? Share them below. First-time comments are reviewed before they appear, and your email is never published.
No comments yet. Be the first to add a question or your experience.

 Swati Minerals
 Faith At Work (Pty) Ltd
 Geotech Mining Solutions plc
 Vulcan International Limited
 Kidepo Associates
 GKY Mining
 Alkimy SARL
 Double A Trading
 GemSprout Metals Limited
 Qader Group
 Ileys General Trading
 SG Gold Mining LLC
 VRV Global Pte Ltd
 Omsri International FZE
 G.I.T.T.
 Jaunita Erss Ltd
 Almosi SARL
 SRK Consulting
 Berks Gold Limited
 Mwerezi Minerals Company Limited
 Mining SARL
 SenGold Invest SAS

 Exploration consultancy · South Africa · Gold
 Client · Oregon, USA · Gold










