

Farm monitoring · Cost and buying guide
Agriculture Monitoring System: IoT Costs and Payback
An agriculture monitoring system links field sensors or satellite images to software that reports soil, weather and crop conditions. This guide gives dated hardware costs, USDA savings figures, a sensor-versus-satellite comparison and a payback calculator.
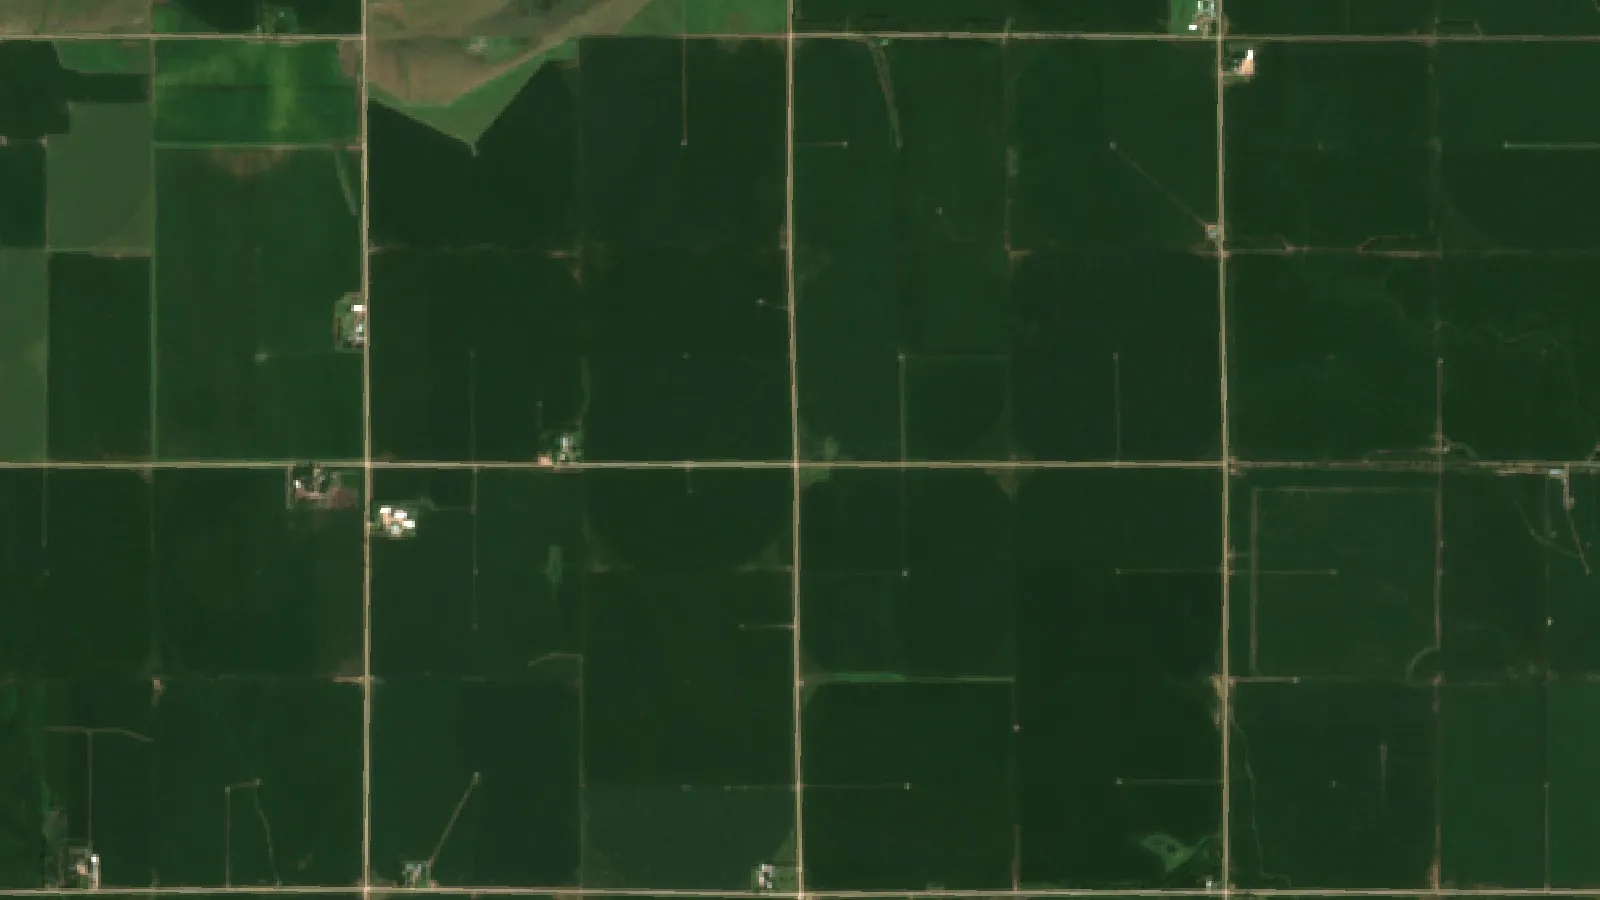
Key takeaways
- Arizona Extension (2024) lists single-depth soil sensors at $100-$700, multi-depth at $600-$1,750 and gateways at $399-$2,250.
- USDA ERS (2016) found corn farm savings of about $25 per acre with yield mapping, $15 with guidance and over $13 with GPS soil mapping, before equipment costs.
- Farm size matters: 73% of the largest US corn farms had guidance in 2016, against 10% of the smallest (USDA ERS).
- A 47% water saving figure comes from a potted lettuce trial, so test your own saving before you rely on it.
- Sensors read one spot in the root zone; satellite images show the whole field. Match the tool to the decision.
In this article
- What an agriculture monitoring system includes
- How an IoT based agriculture monitoring system works
- Agriculture monitoring system costs: what to budget
- What savings has USDA actually measured?
- Will sensors pay on your farm?
- Who uses these systems: US adoption by farm size
- Ground sensors, satellite or both?
- Managed IoT agriculture services vs running it yourself
- Challenges to plan for
- A six-step plan to get started
- What to watch next
- FAQ
An agriculture monitoring system is a set of field sensors, a wireless link and software that reports soil, weather and crop conditions so you can act before a problem costs yield. A small IoT soil moisture network, with several sensors and a gateway, often comes to a few thousand US dollars. Arizona Extension’s 2024 sensor review lists single-depth sensors at $100 to $700 each, gateways at $399 to $2,250 and data plans at about $150 to $350 a year.
This guide shows what those parts do, what they cost, what USDA has measured on savings, and when satellite monitoring is the better first step. Use the calculator to test whether a sensor network pays on your own acres.
What an agriculture monitoring system includes
Every system, large or small, has the same four layers. If a vendor cannot explain each one for your farm, ask more questions before you buy.
| Layer | What it does | Common options | Main thing to check |
|---|---|---|---|
| Sensing | Collects the reading | Soil probes, weather stations, satellite images, drones, animal tags | Does it measure the decision you need to make? |
| Connection | Moves the data | LoRa or LoRaWAN, cellular, Wi-Fi, satellite uplink | Signal and range at your actual fields |
| Software | Shows data and sends alerts | Vendor dashboard, phone app, API | Who owns the data, and can you export it? |
| Action | Turns data into work | Manual decision, alert, automatic valve | Who responds, and how fast? |
The fourth layer is often forgotten. A soil moisture alert saves nothing if nobody changes the irrigation set. Before you price hardware, write down the three or four decisions you want to improve. Examples are when to start the pivot, when to scout one corner of a field, and when a cold room has drifted out of range.
Soil moisture sensors
These are the usual starting point for an IoT based agriculture monitoring system on irrigated land. University of California guidance names TDR and FDR sensors and tensiometers as the common types. It says tensiometers tend to suit crops that are sensitive to water stress, such as berries and vegetables, and do not need soil calibration. Other types may need it.
Arizona Extension says capacitance sensors should be calibrated for sandy, loamy or clayey soil, and that salinity can affect readings. It says single-depth sensors can be enough to plan the next irrigation from the root zone. Multi-depth probes show more of the soil profile and cost more.
Weather stations
An on-farm station records temperature, humidity, rainfall and wind. It helps with spray timing, frost alerts and irrigation decisions. One station can serve several nearby fields on flat ground. Hills, valleys and scattered blocks may need more than one, because rain and frost can differ across short distances.
Satellite and drone images
Images cover the whole field, which point sensors cannot do. A vegetation map shows where crops look different from the rest of the field. It does not tell you why, so someone still has to walk to that spot. The European Sentinel-2 mission offers four bands at 10 m resolution and a five-day revisit with its nominal two satellites, according to the Copernicus Sentinel-2 mission page. Optical images cannot see through cloud, so wet spells can leave gaps.
Livestock, storage and transport sensors
The same design works off the field. The FAO e-Agriculture overview lists livestock monitoring, farm vehicle tracking and storage monitoring among farm uses of IoT. Tags can report an animal’s location or activity. Sensors in bins and cold rooms can send an alert when temperature or humidity moves out of range. Pick the crop or herd decision first, then check that the tag or probe has been tested for that use.
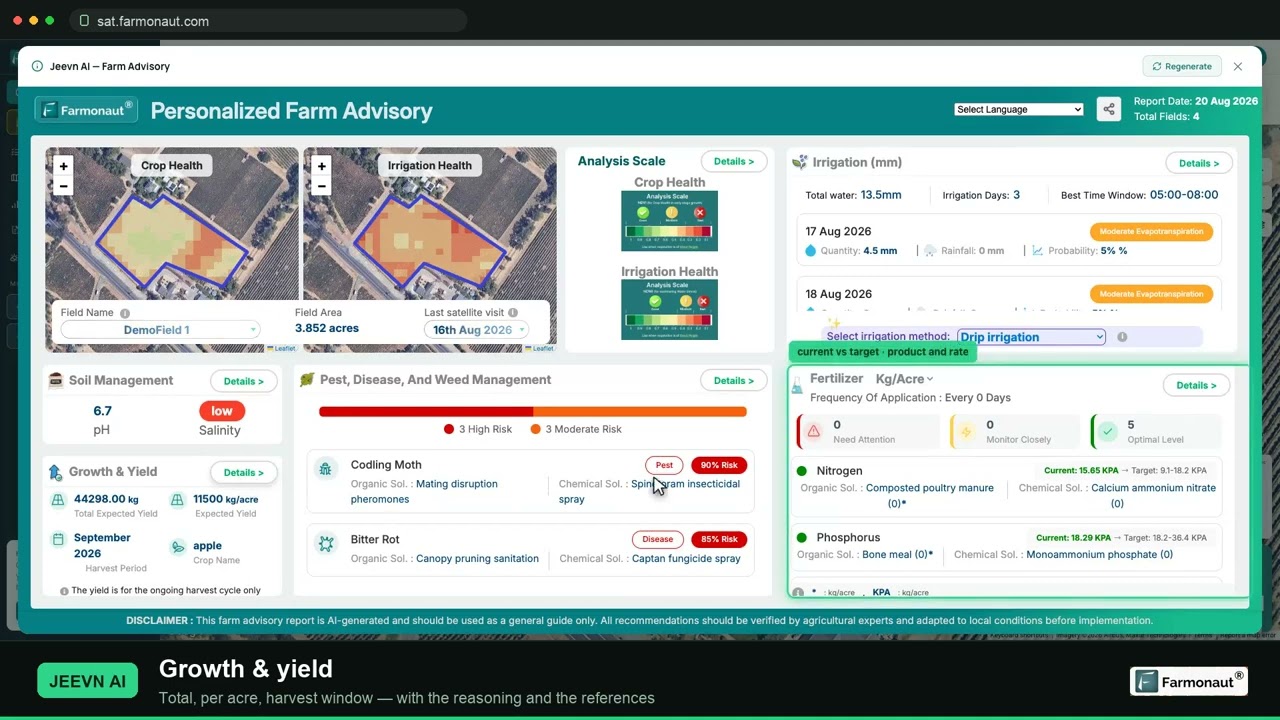
▶ A full walkthrough of satellite crop monitoring: reading NDVI maps and pulling a field report. · 19:36
How an IoT based agriculture monitoring system works
The working cycle has five steps. It looks simple on a vendor’s slide. Each step has a common failure point, so use this list as a setup check.
- Place the sensors. Put probes in soil and crop areas that represent a management zone. Avoid wheel tracks, field edges and unusual wet spots. Record the location and depth of each one.
- Send the data. Readings travel by radio or cellular link to a gateway or the cloud. Arizona Extension reports an average of about 1,640 ft (0.5 km) from sensor to gateway, station or repeater, depending on how high the transmitter sits. It says gateways usually broadcast up to 6.2 miles (10 km). Test this in the crop at full height, because a signal that works in April may behave differently in August.
- Process the readings. Software turns raw values into charts and thresholds. In UC guidance, alerts by text or email can fire when soil moisture reaches a level you set.
- Act. You or a controller changes the irrigation, or you go and scout. Arizona Extension notes that some vendors also offer API commands to control irrigation.
- Review each season. Compare sensor readings with yield, water use and what you saw on the ground. Then reset your thresholds for next year.
Battery life and warranty matter here too. The same Arizona review reports sensor battery lives of 3 to 15 years, depending on the battery and transmitter. It also says the warranty is usually one year. So plan for at least one failed unit over the life of a network.
Agriculture monitoring system costs: what to budget
Ground hardware costs are the easiest part to pin down. The chart shows the ranges in Arizona Extension’s March 2024 review. Its sensor price figure is dated November 2023, and some details came from vendors directly. So get a dated quote before you budget.
Chart
Soil moisture system parts: price ranges
US$, vendor prices from a review published in March 2024; data plan is per year
Think in monitoring stations, not acres. A 40-acre block of one soil and one crop may need less equipment than a 40-acre block with three soil types. For that reason a single cost per acre can mislead. The bigger the area each station can honestly represent, the lower the cost per acre.
A second price check comes from conservation budgets. The USDA NRCS Pennsylvania cost list for fiscal year 2026 shows a base cost of $848.19 each for soil moisture sensors. With data loggers and telemetry, the base cost is $2,546.27 each, plus an implementation cost of $6.74 per acre. These are one state’s program cost figures, not shop prices. They still show how much data loggers and telemetry can add.
Costs that are easy to miss
- Repeaters. Arizona Extension puts them at about $150 to $200 where the signal needs extending, though it says the data plan often covers this cost and some gateways come with the sensors.
- Per-sensor data plans. The same review reports $2 to $550 per sensor per year on some plans, so compare the plan as well as the hardware.
- Installing and pulling probes each season, especially in annual row crops where equipment must pass.
- Staff time to read dashboards and respond to alerts.
- Replacements after hail, machinery strikes, rodents or lightning.
- Service fees. Support is often remote and at no charge, according to Arizona Extension, but certain companies charge for it.
Can a cost-share program help in the US?
It may. USDA’s Environmental Quality Incentives Program (EQIP) can pay for conservation practices on working land. Federal law (16 U.S.C. 3839aa-2) generally limits EQIP payments to 75 percent of practice costs. The limit can rise to 90 percent for limited-resource, socially disadvantaged, veteran and beginning farmers, and for certain designated practices. The USDA ERS digital agriculture report also gives the 90 percent ceiling. Irrigation water management is one of the practices on the Pennsylvania list above. Your rate and any payment cap depend on your state, your practice and your eligibility. Ask your local NRCS office before you order equipment, and get tax or financial advice where the amounts are large. Readers in Canada, the UK, the EU, Australia and New Zealand should check their own national or state schemes, since these rules are US-only.
What savings has USDA actually measured?
The most specific USDA figures here come from precision technologies on US corn farms, not from IoT sensor networks directly. They are useful, but they are not a promise for your farm.
A USDA ERS study of corn farms found savings of about $25 per acre with yield mapping, over $13 with GPS soil mapping and $15 with guidance. Those equal 4.5%, 2.4% and 2.7% of total per-acre production costs. The article is dated May 2016, so the dollar values are old and the analysis covered operating costs, not the price of the equipment.
A later USDA report on farm profits and precision agriculture from October 2016 gives a more cautious view. It estimated that mapping raises operating profit on corn farms by almost 3%. It put guidance at about 2.5% and variable-rate technology at about 1.1%. Effects on net returns were smaller for mapping and guidance. These are modest gains, and they come from statistical models of survey data.
Guidance savings also depend on the crop. NDSU Extension (revised December 2023) cites estimates of input savings from reducing overlap of $1 per acre for soybean, $2.50 for wheat and more than $4 for corn and sugar beet. Treat these as older estimates and redo the sums with your own seed and input prices.
What about water savings from smart irrigation?
You may see “47% water savings” quoted, as earlier versions of this page did. That figure comes from a study in Scientific Reports with an important context. It tested a sensor-controlled system on lettuce grown in pots, over two years at a university research farm in Egypt, alongside wood vinegar treatments. The authors’ summary credits the smart system with a 47% cut in water consumption and a 43% yield rise. In the results section, though, the 47% compares one wood vinegar dose with the untreated control (20 vs 38 liters) at one soil moisture level, not a sensor system with ordinary irrigation. Elsewhere the paper says IoT irrigation saved 35% compared with traditional methods.
This shows what is possible in a controlled trial. It says little about a center pivot in Nebraska or a vineyard in South Australia. Your saving depends on how well you already irrigate. A farm with good scheduling has less to gain than one irrigating by the calendar. For that reason, the 15% in the calculator below is only an example: enter your own.
One vendor view is worth noting. WiseConn, which sells irrigation automation, tells its distributors to expect a payback of 2 to 5 years, depending on farm size, crop and irrigation efficiency. That is a seller’s estimate and not an independent measurement.
Chart
Estimated cost savings on US corn farms
US$ per acre of operating costs, by technology; excludes capital cost of equipment
Will sensors pay on your farm?
This calculator spreads the hardware cost over the years you expect it to last, adds the annual data plan and compares the total with your water bill saving. It leaves out yield gains, labor and any cost-share payment. Add those to your own notes if you can back them up.
A practical way to run it is to start with the water saving you need to break even. Then ask whether that saving is believable for your soils and your current routine. If you already use a good schedule, be conservative.
Try the numbers for your own farm below.
Calculator
Will a soil moisture network pay for itself?
Enter your own acres, costs, water bill and expected saving.
- Yearly water saving (US$): $960
- Yearly system cost (US$): $1,010
- System cost per acre (US$): 6.31
- Water saving to break even: 15.8 %
All values are examples set near break-even, not benchmarks or forecasts; price inputs are examples, use today’s price. The hardware is spread evenly over its life with no interest, and the result leaves out yield effects, labor and any cost-share payment. Get financial advice for large purchases.
Who uses these systems: US adoption by farm size
Farm size is a clear dividing line in the US data. The USDA ERS chart on guidance adoption shows that 73% of the largest corn farms had guidance in 2016, against 10% of the smallest. In soybeans in 2018 the split was 68% against 11%. In winter wheat in 2017 it was 82% against 7%. Cotton is the exception, at 67% for the largest farms and 50% for the smallest in 2019.
Chart
Share of US corn acres using each tool, 2016
Percent of planted corn acres
Scale is a likely reason. The USDA report says returns to these technologies could be greater on larger farms, because adjustment costs can spread over more output. It also found that fewer than a quarter of the smallest farms use yield maps, soil maps, variable-rate technology or guidance, again with cotton as the exception.
Adoption also differs by tool. Guidance was on 58% of US corn acres in 2016, and yield monitors on 43.7%. Drones, aircraft and satellite imagery sat at just 7.0%. Newer figures may exist by the time you read this, but this is the latest detailed crop-level picture in that report, which covers data up to 2019.
GPS use overall also looks different when counted by farm instead of by land. In 2019 roughly 12% of all US farms used GPS for on-farm production, and those farms held 40% of farm and ranch acres, according to USDA’s report. So adoption figures need a label. A rate per acre can be far higher than a rate per farm.
The market numbers are a separate matter. Market.us, a commercial research firm, estimates the US market for IoT in precision agriculture at $2.36 billion in 2024, with 17.8% annual growth projected. Other firms publish different numbers, and a market forecast tells you little about whether a system pays on your farm.
Ground sensors, satellite or both?
This is the main buying decision, and it is often framed badly. Sensors and satellite images answer different questions. A probe tells you what is happening at one spot in the root zone. An image shows you how the canopy varies across the whole field. Some farms will want both, but the first purchase should match the first problem.
| Option | Best for | Strength | Limit |
|---|---|---|---|
| Soil probes (LoRaWAN) | Irrigated, high-value crops | Direct root-zone readings, many times a day | Only covers the spot it sits in; hardware to install and repair |
| Weather station | Spray, frost and irrigation timing | Local conditions at your farm | Rain and frost can vary across scattered fields |
| Satellite monitoring | Large or scattered acres, dryland, finding problem areas | Whole-field view with no field hardware | Cloud gaps; shows a change in the canopy, not its cause |
| Drone flights | Close-up checks at key crop stages | Fine detail when you choose to fly | Needs a pilot, flight time and local drone rules |
| Livestock tags | Grazing herds and breeding decisions | Per-animal location and activity | Coverage on rough range; a cost per animal |
How to choose
- Irrigated vegetables, berries or orchards: start with probes in each main soil and crop zone. The water and quality stakes are high, and UC notes that better data access tends to appeal for high-value crops and those with low tolerance of water stress.
- Dryland grain or scattered rented fields: start with images. You cannot change rainfall, so the main job is to find problem areas and direct your scouting.
- Weak mobile signal: test coverage before you buy. Ask about private LoRaWAN gateways or satellite links.
- Small farm with little spare time: pick one decision and one tool. A second dashboard that nobody opens has a real cost.
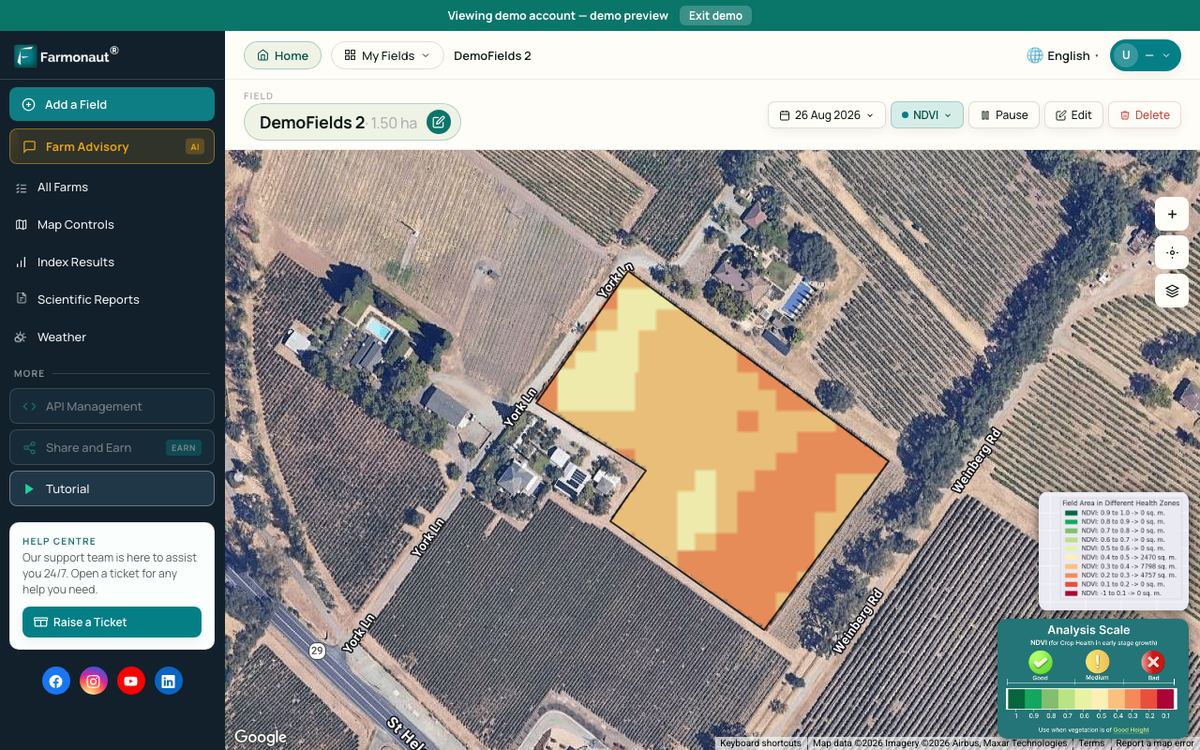
Farmonaut is one example of the no-hardware route. Its Satellite + AI Farm Monitoring System shows satellite crop maps for the fields you draw, on the web or a phone app. It does not replace a root-zone probe for fine irrigation scheduling, and it works best as a guide to where you should look.
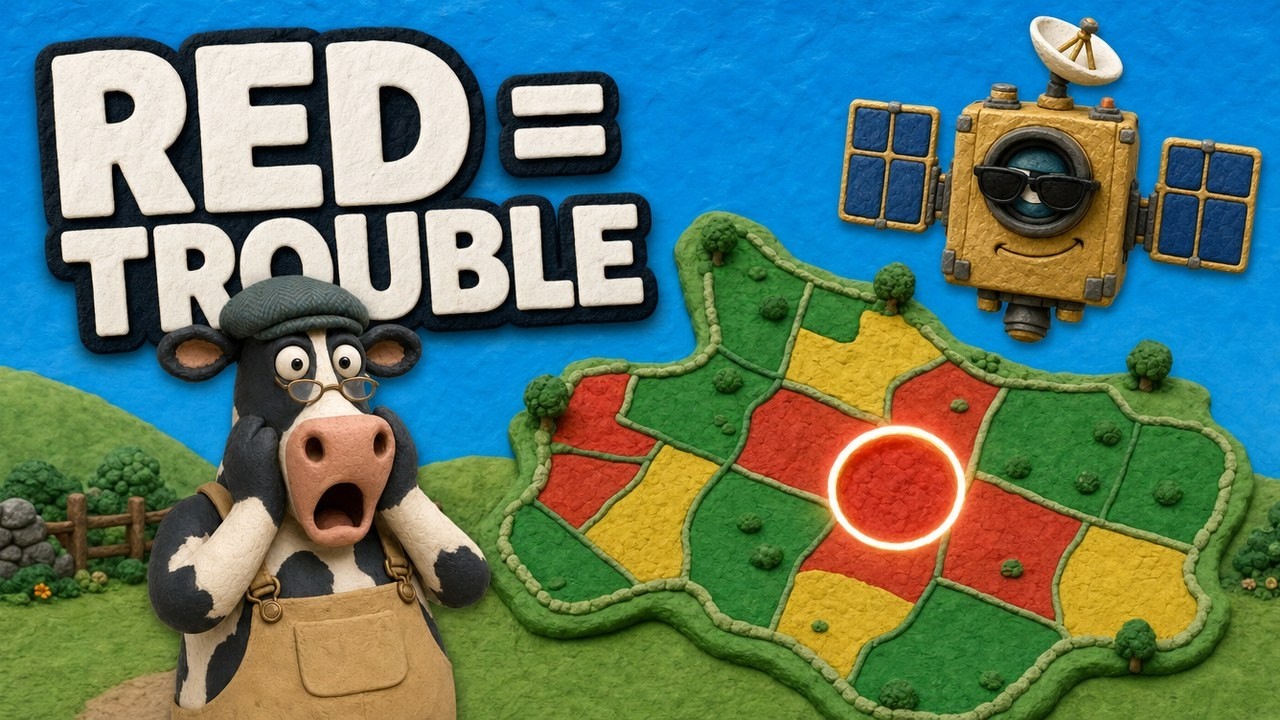
▶ A light explainer on how NDVI maps show crop stress across a 400-acre farm. · 4:09
Managed IoT agriculture services vs running it yourself
A managed service means a vendor installs, calibrates and maintains the network, usually for a yearly fee. Running it yourself means you buy the hardware and take on the upkeep. Neither is always cheaper. Compare them over the full life of the equipment.
| Question | Lean managed | Lean do-it-yourself |
|---|---|---|
| Staff | No one has time for upkeep | Someone enjoys the technical work |
| Sites | Many sites or long distances | One compact block |
| Crop | Annual crops needing seasonal removal | Perennial crops with probes left in place |
| Data | Happy with a vendor dashboard | Need your own data and API use |
Whichever you choose, get five answers in writing: the total cost over five years, what happens when a sensor fails, how you export your data if you leave, who else can see your farm data, and what support costs after the warranty ends.
Challenges to plan for
- Connectivity. USDA’s report names lack of broadband access as a major barrier to digital farming tools. Run a signal test at the far end of your fields, with the crop up.
- Accuracy and placement. A poorly placed or badly calibrated probe gives confident but wrong numbers. Check sensors against a hand soil test early in the season.
- Training. Budget time for someone to install the system and learn what the numbers mean. This rarely appears on a price sheet.
- Data rights and security. Arizona Extension notes that the companies supplying sensors often own the apps and control the data. Read the contract, use strong passwords and limit who has access.
- Too many alerts. Start with few thresholds. If staff begin to ignore alerts, the system has stopped working even though the hardware still runs.
- Compatibility. Ask whether new hardware works with your current irrigation controller and farm software before you sign.
A six-step plan to get started
- Name one decision and one number you want to change, such as inches of water applied per season.
- Record a baseline: your water, fuel, input and yield figures for the same fields from the last two seasons.
- Test mobile signal and walk the fields to mark soil and crop zones.
- Pilot on one field or block for one season, leaving a comparable area as your check.
- Compare the result with the baseline using the calculator, with real costs in place of the examples.
- Expand only where the numbers hold up. Move on to the next decision once the first is working.

▶ A step-by-step tutorial of the web app for monitoring a farm by satellite. · 8:43
What to watch next
Four trends are worth following, without paying for them before they prove useful on your farm.
- AI on farm data. Software is being used to combine sensor, image and weather data into forecasts. Ask each vendor what the model was tested on, and whether that matches your crop and region.
- New sensor types. Soil nutrient sensing gets a lot of marketing. Compare any in-field reading with a lab soil test before changing a fertilizer plan, and follow local rules and the product label for any input you apply.
- Better connections. Cellular coverage and satellite links are spreading, which may reduce the need for private networks. Check coverage at your own fields instead of relying on maps.
- Open data links. APIs that connect sensors, weather data and farm software make switching vendors easier. Ask for API documents before you buy, even if you do not plan to use them yet.
Related pages on our site: remote crop monitoring options, farm data analytics, smart agriculture technology, large-scale farm management, product traceability, fleet monitoring, carbon footprinting, crop loan and insurance checks, satellite data API, API developer docs, mobile apps, critical elements supply.
FAQ
What is an agriculture monitoring system?
It is a set of sensors or satellite images, plus a data link and software, that reports soil, weather, crop or livestock conditions. You use the reports to decide when to irrigate, scout, spray or move animals.
How much does an IoT agriculture monitoring system cost?
A small soil moisture network can cost a few thousand US dollars. Arizona Extension (2024) lists sensors at $100 to $1,750, gateways at $399 to $2,250 and data plans at about $150 to $350 a year. Get a dated quote, since prices change and vary by vendor.
How much water can smart irrigation save?
No single figure applies. One potted lettuce trial reported 47%, but a farm that already schedules irrigation well will likely save less. Measure one season against a similar field and put your own figure in the calculator.
Do I need ground sensors if I use satellite monitoring?
It depends on the decision. Images show differences across a field and tell you where to look. Probes give root-zone moisture at one point, and this suits fine irrigation scheduling on high-value crops. Some irrigated farms may want both.
Is a smart agriculture monitoring system worth it for a small farm?
It can be, if it targets one costly decision. USDA data show much lower adoption on the smallest farms, and the report suggests that returns may be greater at larger scale. Keep the first purchase small and run it as a one-season test.
Does USDA help pay for these systems?
Possibly. EQIP can fund conservation practices such as irrigation water management. Payments are generally limited to 75% of practice costs, and up to 90% for certain farmers and practices. Rates, caps and eligibility differ, so ask your local NRCS office before buying.
Farmonaut crop monitoring
See your own fields from space
Draw your fields once and Farmonaut shows satellite crop maps for them through the season, on web, Android or iOS.


Keep reading
Sources
- University of Arizona Cooperative Extension, Guidance for Soil Moisture Sensor Selection, az2082 (March 2024): extension.arizona.edu
- University of California ANR, Soil Moisture Sensors (archived guidance): ucanr.edu
- Copernicus SentiWiki, Sentinel-2 mission: sentiwiki.copernicus.eu
- FAO e-Agriculture, The possibilities of IoT for agriculture: fao.org
- USDA NRCS Pennsylvania, FY 2026 EQIP and CSP published cost list, Bulletin PA 440-26-06 (March 2026): nrcs-prod.azureedge.us
- USDA ERS, Precision Agriculture in the Digital Era, EIB-248, full report (February 2023): ers.usda.gov
- USDA ERS, Precision Agriculture in the Digital Era, summary page (February 2023): ers.usda.gov
- USDA ERS, Cost Savings From Precision Agriculture Technologies on U.S. Corn Farms, Amber Waves (May 2016): ers.usda.gov
- USDA ERS, Farm Profits and Adoption of Precision Agriculture, ERR-217 (October 2016): ers.usda.gov
- NDSU Extension, Precision Agriculture series SF1176-4 (revised December 2023): ndsu.edu
- Scientific Reports, IoT-driven smart irrigation system to improve water use efficiency (PMC12820134): pmc.ncbi.nlm.nih.gov
- WiseConn, Cost of automated irrigation system (vendor page): wiseconn.com
- USDA ERS, Largest farms most likely to adopt precision agriculture guidance systems, Chart of Note (February 2023): ers.usda.gov
- Market.us, IoT in Precision Agriculture Market report: market.us
- 16 U.S.C. 3839aa-2: law.cornell.edu
Discussion
Questions, corrections or field experience? Share them below. First-time comments are reviewed before they appear, and your email is never published.
No comments yet. Be the first to add a question or your experience.

 Suminter India Organics
 Crossprod
 Patrick America
 Liquify Digital
 CU Foods
 BeyondTech Global
 Rouge VC
 AgroGreen Dynamics
 AgroRisk
 Oath Inc
 Reddane Farming
 Esri North East Africa
 Cresol
 MDCV UK
 Zerella Group
 Etech Consulting Madagascar
 Vestlandsforsking
 Delicio
 WB Dev
 Sama Premium

 Exploration consultancy · South Africa · Gold
 Licence holder · Niger · Gold
 Client · Tanzania · Gold










