

Australia · Silver mines compared
Silver Mines in Australia: 7 Mines and Projects
Australia’s silver comes mostly from lead-zinc, copper and gold mines. Cannington in Queensland produced 8.9 million payable ounces in the year to June 2026. This guide compares seven mines and projects with dated figures.
Key takeaways
- Cannington (South32) produced 8,906 koz of payable silver in the year to 30 June 2026, down 13% from 10,292 koz (South32, July 2026).
- Geoscience Australia gives 2025 mine production of 0.94 kt of silver: ninth in the world for production, second for economic resources with about 16% (Geoscience Australia, October 2026).
- Glencore reports 3,405 koz of silver in concentrates at Mount Isa and 2,081 koz at McArthur River for 2025; Dugald River (MMG) reported 1,568,609 oz contained.
- Bowdens in New South Wales has no valid consent; the IPC hearing was set for 14 and 15 October 2026 and a decision is expected on or before 9 December 2026.
- Refined silver exports were 397 t worth A$1,169 million in 2025, 0.4% of mineral export earnings (Geoscience Australia).
In this article
- Silver mines in Australia: seven operations and projects compared
- How we chose and ordered the mines
- Cannington in Queensland
- Mount Isa, McArthur River and Dugald River
- Broken Hill and the Rasp mine
- Bowdens and other silver projects
- How much silver does Australia produce
- What the silver price does to mine revenue
- Where Australian silver goes
- Why most Australian silver comes with lead and zinc
- What to check before relying on a silver mine claim
- Frequently asked questions
Australia’s silver comes mostly from lead-zinc, copper and gold mines rather than from mines that dig for silver alone. The biggest single source with a published figure is South32’s Cannington mine in Queensland, which produced 8.9 million payable ounces of silver in the year to June 2026 (South32 quarterly report, July 2026). Nationally, Geoscience Australia puts 2025 mine production at 0.94 thousand tonnes of silver and ranks Australia ninth in the world for production but second for economic resources (Geoscience Australia, preliminary tables, October 2026). The table below compares seven mines and projects, with the output figure each source gives and its date.
Silver mines in Australia: seven operations and projects compared
Silver is measured in troy ounces (oz, 31.1035 grams) or in tonnes of contained metal. Output figures differ in basis: “payable” silver is what the buyer of the concentrate pays for, “contained” silver is the metal inside the concentrate, and “recovered” is what the plant extracts from the ore. The table keeps each company’s own basis and does not add the numbers together. Where a company does not publish a silver figure for a single mine, the table says so.
| Mine or project | State | Main metals | Latest silver figure in the sources | Status in the sources |
|---|---|---|---|---|
| Cannington (South32) | Queensland | Silver, lead, zinc | 8,906 koz payable, year to June 2026 (10,292 koz the year before) | Operating; studies for an underground and an open pit extension |
| Mount Isa Mines (Glencore) | Queensland | Copper, zinc, lead, silver | 3,405 koz silver in concentrates, 2025 (plus 341 koz in copper metal) | Operating |
| McArthur River (Glencore) | Northern Territory | Zinc, lead, silver | 2,081 koz silver in concentrates, 2025 (1,760 koz in 2024); zinc up 14,900 t | Operating |
| Dugald River (MMG) | Queensland | Zinc, lead, silver | 1,568,609 oz contained, calendar 2025 | Operating; record zinc output in 2025 |
| Olympic Dam (BHP) | South Australia | Copper, uranium, gold, silver | 1,100 koz refined silver, year to June 2026; silver is a by-product of copper | Operating |
| Rasp (Broken Hill Mines Ltd) | New South Wales | Silver, lead, zinc | 78,649 oz in the March 2026 quarter (company report) | Operating; ramping up to 750,000 tonnes a year |
| Bowdens Silver (Silver Mines Ltd) | New South Wales | Silver, lead, zinc | No production yet | Development consent voided; IPC hearing set for 14 and 15 October 2026, decision expected on or before 9 December 2026 |
How we chose and ordered the mines
We included the mines and one project that the 2026 company reports and Geoscience Australia name as sources of Australian silver, and that have a report from 2025 or 2026 to check. We ordered them by the size of the silver figure that the operator itself publishes: payable ounces first, then contained ounces, then a single quarter. The development project comes last. This is not a ranking of reserves or value. It leaves out smaller operations and silver credits from gold and copper mines that do not report silver separately; Geoscience Australia notes that many gold and copper mines also produce silver as a by-product and that its mine count does not include them.
For each mine we give three things: who runs it, what the latest report shows, and what to watch. We use no price targets, and the page names no share prices.
Cannington in Queensland
Cannington, in north-west Queensland, is a 100% South32 operation. South32 reports that payable silver production fell 13% to 8,906 koz in the year to 30 June 2026, from 10,292 koz a year earlier, while payable lead was 82.9 kt and payable zinc 39.2 kt (South32 quarterly report, July 2026). The company ties the lower annual metal output to lower grades: it milled 11% more ore, but part of the feed was lower-grade stockpile. The June 2026 quarter was stronger, with silver output of 2,506 koz, up 31% on the March quarter after weather-related outages.
The same report says South32 is running studies for underground and open-pit development to extend the mine’s life, with a final investment decision on the open pit targeted for the first half of its 2028 financial year (July to December 2027). For FY27, South32 guides to payable zinc-equivalent output of 204.7 kt, which is about the same as FY26’s 205.4 kt (South32 quarterly report, July 2026). Zinc equivalent adds silver, lead and zinc into one number using the company’s prices.
On a rough conversion, 8,906 koz is about 277 tonnes of silver. Geoscience Australia’s national production figure for 2025 is 940 tonnes, but the bases differ (payable silver for a South32 financial year against national mine production for a calendar year), so read the comparison as an indication only.
Mount Isa, McArthur River and Dugald River
Mount Isa Mines and McArthur River Mine both appear among Glencore’s Australian operations in its full-year 2025 production report. That report gives group figures and notes that group zinc output rose 7% to 969,400 tonnes, partly on a 14,900-tonne increase at McArthur River (Glencore, full-year 2025 production report). The report’s tables do give silver by mine (Glencore, full-year 2025 production tables): Mount Isa produced 3,405 koz of silver in concentrates in 2025 (plus 341 koz in copper metal), and McArthur River 2,081 koz, up from 1,760 koz in 2024. These are silver in concentrates, not payable ounces, so they are not directly comparable with Cannington’s figure. Geoscience Australia describes the Carpentaria Zinc Belt, which runs from north-west Queensland into the north-east Northern Territory, as the largest repository of zinc-lead-silver deposits in the country, with George Fisher-Hilton and McArthur River as its major mines (Geoscience Australia, Australia’s Identified Mineral Resources, 2020 edition, 2019 data).
Dugald River in Queensland is operated by MMG. MMG’s fourth-quarter report of 22 January 2026 shows record zinc output of 183,463 tonnes in zinc concentrate for 2025 and 1,568,609 oz of contained silver, down 4% on 2024 (MMG, 4th quarter production report, January 2026). MMG reports it as contained metal in concentrate. For 2024 MMG’s annual report gave 1,853,146 oz of payable silver in product sold, a different basis from the 2025 contained figure, so the two should not be set side by side (MMG annual report, 2024). MMG guides to 170,000 to 180,000 tonnes of zinc in concentrate from Dugald River for 2026.
Olympic Dam in South Australia is mainly a copper and uranium mine, and gold and silver are recovered with the copper. It is in the table because Geoscience Australia counts it among the places where the silver sits, and BHP’s operational review for the year to June 2026 reports 1,100 koz of refined silver and 856 koz of payable silver in concentrate for Olympic Dam (BHP, operational review, July 2026).
Broken Hill and the Rasp mine
Broken Hill in New South Wales is the older silver-lead-zinc district, and the Rasp mine is an operating mine there in 2026. Broken Hill Mines Limited (ASX: BHM) is raising Rasp to 750,000 tonnes of ore a year. Its March 2026 quarterly report shows silver production rising from 41,478 oz in the September 2025 quarter to 51,832 oz in December and 78,649 oz in March, a 52% quarterly increase, as a second ore source, the Main Lode, came online and average milled grade rose 29% (Broken Hill Mines, quarterly activities report, 24 April 2026). The March report lists a third source, the Pinnacles mine, as ready to start mining in the June quarter, and says mineral resource upgrades are scheduled for late 2026.
Chart
Rasp mine silver production by quarter
Ounces of silver, Rasp operations, Broken Hill Mines Ltd
Rasp is small beside Cannington: 78,649 oz is about 2.4 tonnes. The point of the chart is the trend, three quarters of rising output as new ore sources are added, which is the usual way a ramp-up shows up in the numbers. Figures are from the March 2026 quarterly report.
Bowdens and other silver projects
Bowdens is a silver-led development project. It sits about 26 kilometres east of Mudgee in central New South Wales. The NSW Independent Planning Commission (IPC) approved it on 3 April 2023, and the company says the development consent was later voided on a technical planning point (Silver Mines Limited, ASX announcement, 16 September 2026). In that announcement the New South Wales planning department told the IPC that the additional information does not change its earlier view that the project is in the public interest and approvable subject to strict conditions. As of that announcement, the IPC hearing was set for 14 and 15 October 2026 and the company expected a decision on or before 9 December 2026. Bowdens has no valid development consent and no production.
The 2,115 square kilometre project area covers about 80 kilometres of the Rylstone Volcanics, according to the same announcement. Project size, timeline and costs are the company’s figures, not independent estimates, and a new consent would carry its own conditions. Approvals for mines also weigh effects on land and water.

▶ A plain-language claymation on the seven environmental impacts of mining, which approvals for projects like Bowdens weigh. · 2:31
How much silver does Australia produce
The US Geological Survey estimates Australian mine production at 1,050 tonnes in 2024 and 1,000 tonnes in 2025, which ranks Australia ninth among the countries it lists, behind the United States (1,100 tonnes) and Russia (1,200 tonnes), against 6,300 tonnes for Mexico and 3,600 for Peru (USGS, Mineral Commodity Summaries 2026: Silver). World mine production was 26,000 tonnes in 2025 on the same table. Geoscience Australia’s preliminary tables put Australian production at 0.94 kt for 2025, down 10% from 1.05 kt in 2024, with 31 operating mines in its silver count and a reserve life of 21 years at that rate (Geoscience Australia, preliminary tables, October 2026). The two agencies differ a little because they use different data and rounding.
Chart
Silver mine production, selected countries, 2025
Tonnes of silver, USGS estimates; Australia and the eight larger producers shown
What the silver price does to mine revenue
Silver mines earn the price of silver plus the price of the other metals in the ore, less treatment charges. For Cannington, South32 used a payable silver price of US$31.9 per ounce in FY25 and US$66.4 in FY26, with US$58.4 in the first half and US$75.2 in the second half of FY26 (South32 quarterly report, July 2026). That is more than double in a year, while Cannington’s payable silver volume fell 13%. USGS gives an average 2025 bullion price of US$38 per troy ounce (USGS, 2026). On 15 October 2026 at 14:50 New York time, Kitco showed a bid of US$56.98 per ounce (Kitco silver chart). That is a spot quote, not a forecast, and it moves every day.
Chart
Payable silver price used by South32 at Cannington
US$ per ounce; earlier period to later period
The calculator below turns tonnes of ore, silver grade, recovery and payable share into ounces and revenue. It uses example numbers only. For a mine, revenue is only part of the picture: the cost per ounce, taxes and royalties decide the margin, and the video below explains how all-in sustaining cost per ounce is built.
Calculator
What is the silver in my ore worth?
Enter your own ore tonnes, grade, recovery, payable share and price.
- Payable silver (oz): 2,596,171
- Revenue from silver (US$): $129,808,542
- Silver revenue per tonne of ore (US$): 129.81
Example values only, not a forecast or any mine’s figures. The silver price is an input: use today’s price. Ounces are troy ounces (31.1035 g). Recovery and payable shares vary by ore and contract.
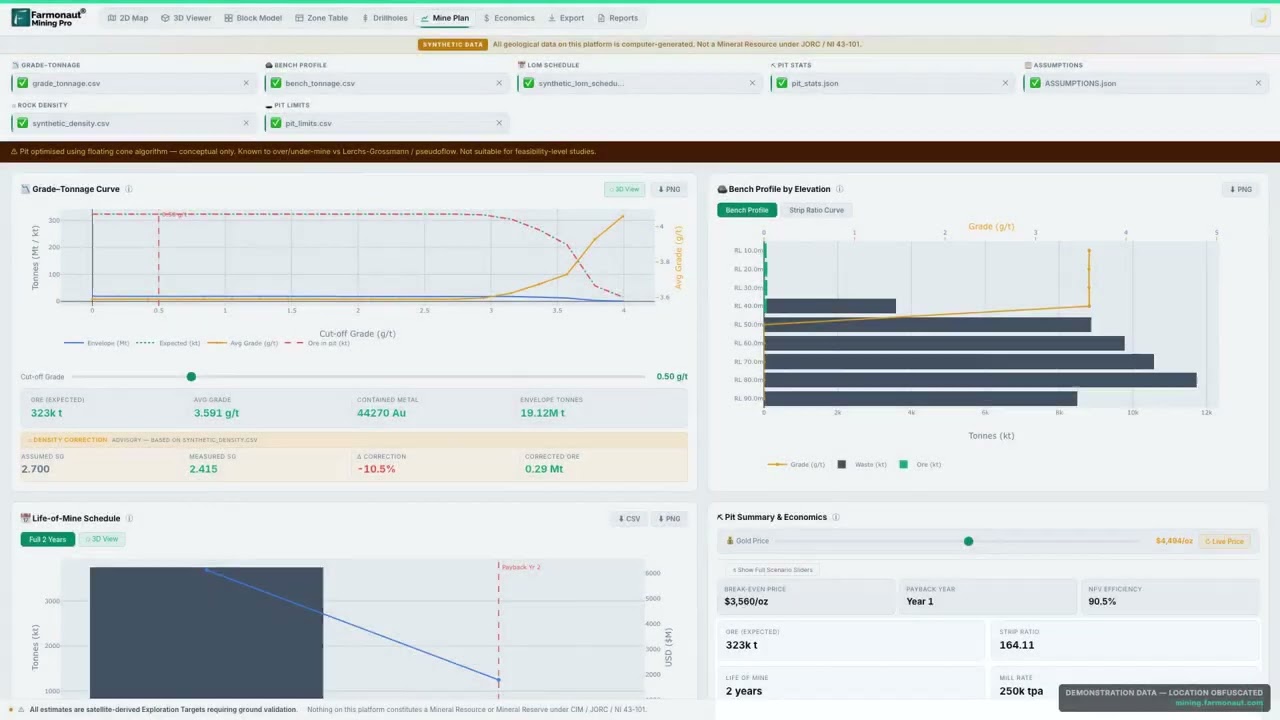
▶ How all-in sustaining cost per ounce, break-even price and payback are built in a mine plan. · 14:58
Where Australian silver goes
Geoscience Australia’s export table lists refined silver exports of 397 tonnes worth A$1,169 million in 2025, or 0.4% of mineral export earnings, compared with 0.2% in 2024, because export value rose 83% on a 29% rise in volume and a 42% rise in value per tonne (Geoscience Australia, preliminary tables, October 2026).
On the demand side, the USGS lists the 2025 estimated US uses of silver as electrical and electronics 25%, other industrial uses and photography 19%, net physical investment 18%, photovoltaics 15%, coins and medals 14%, jewelry and silverware 6%, and brazing and solder 3% (USGS, Mineral Commodity Summaries 2026: Silver). These are US shares, not world shares, and the USGS does not give a split for Australian exports.
Why most Australian silver comes with lead and zinc
Silver sits in sulphide minerals, mostly with lead and zinc. The USGS says worldwide that silver is primarily obtained as a by-product from lead-zinc, copper and gold mines, in descending order of silver production, and that polymetallic deposits hold more than two-thirds of resources (USGS, 2026). Geoscience Australia reports the same pattern at home: virtually all Australian zinc, lead and silver economic resources occur in hard-rock sulphide deposits, with the largest share in Queensland (Geoscience Australia, 2020 edition). An earlier Geoscience Australia edition put Queensland’s share of economic silver resources at 42 kt, or 60% of the national total, in 2009 (Geoscience Australia, Australia’s Identified Mineral Resources 2010).
Chart
Australia’s silver reserves and resources, December 2025
Thousand tonnes of contained silver. Reserves and measured-and-indicated resources: operating mines only. EDR: all deposits
The chart shows the national position in 2025. Economic Demonstrated Resources (EDR) are the part of identified resources that Geoscience Australia judges can be mined at a profit: Australia’s silver EDR was 99.74 kt, up 17% from 85.37 kt a year earlier. Ore Reserves are the part of that which operating mines have already planned to mine. The gap between 19.94 kt of reserves at operating mines and 99.74 kt of EDR is why a mine’s life can be extended by drilling and study, as South32 is doing at Cannington. An explorer who wants to find new ground can use satellite spectral data to rank areas of alteration before drilling; satellite-based mineral detection covers silver among 20+ minerals as an exploration target ahead of a resource estimate. For gold-focused ground in the same states, see gold exploration in Australia by state and the Victoria gold fields. To scope your own licence, you can send a mining query.
▶ What remote sensing for mining measures, in three minutes. · 2:01
What to check before relying on a silver mine claim
- The basis: payable, contained, recovered and zinc-equivalent figures are not interchangeable.
- The period: a financial year to June, a calendar year and a single quarter give different numbers for the same mine.
- Reserves versus resources: an Ore Reserve has passed mining and cost tests; a Mineral Resource has not. Inferred resources have the lowest confidence.
- Approvals: a project without a valid consent, such as Bowdens, has no production date.
- Silver price in the revenue case: check the price used and whether it is an average or a spot quote.
Prospecting and exploration in Australia need the right tenure and landholder permission under state rules, so confirm the position with the state mining department before you work on any ground.
Frequently asked questions
Which is the biggest silver mine in Australia?
Among the mines that publish a silver figure, Cannington in Queensland is the largest in this guide, with 8,906 koz of payable silver in the year to June 2026 (South32). Glencore reports Mount Isa at 3,405 koz and McArthur River at 2,081 koz of silver in concentrates for 2025, so Cannington is still the largest, but on a different basis.
Does Australia mine silver as a main product?
Mostly no. Silver is recovered with lead, zinc, copper and gold. South32 reports Cannington’s output as silver, lead and zinc, while Dugald River and McArthur River are zinc-led. Bowdens is the main silver-led project, but it has no valid consent yet.
How much silver does Australia produce each year?
Geoscience Australia gives 0.94 kt (about 30 million ounces) for 2025, down from 1.05 kt in 2024. The USGS estimate is 1,000 tonnes for 2025.
Where does Australia rank for silver?
Geoscience Australia ranks it ninth for production and second for economic resources, with about 16% of the world total, as at December 2025.
Which state has the most silver?
Queensland holds the largest share of Australia’s zinc-lead-silver resources, per Geoscience Australia. In the older 2009 data, South Australia (11 kt), the Northern Territory (7 kt) and New South Wales (6 kt) follow.
What is Economic Demonstrated Resources (EDR)?
It is the part of an identified resource that Geoscience Australia considers economic to mine. Ore Reserves are a smaller subset that a mine has planned to extract.
Is a new silver mine opening in Australia?
Bowdens, in central New South Wales, is the main proposed silver-led mine. The company expects an IPC decision on or before 9 December 2026. Rasp at Broken Hill is increasing output under its existing operation.
How much were Australian silver exports worth?
Refined silver exports were 397 tonnes worth A$1,169 million in 2025, about 0.4% of mineral export earnings (Geoscience Australia).
How do I estimate what silver in ore is worth?
Multiply tonnes by grade in grams per tonne, divide by 31.1035 to get ounces, apply recovery and the payable share, then multiply by the silver price. The calculator on this page does that with your own numbers.
Why did the silver price matter more than output at Cannington?
South32 used US$31.9 per payable ounce in FY25 and US$66.4 in FY26, so revenue per ounce more than doubled while volume fell 13%.
This page is for information only. It is not investment advice.
This page is for information only. It is not investment advice. It gives no share prices or targets. Check each company’s filings before you decide anything. Confirm tenure and access rules with the state mining department before prospecting.
Farmonaut mining
Map your mining site from space
Consultants can screen a licence area with satellite data for silver and other minerals as an exploration target ahead of a resource estimate.

Mining Pro sample view, synthetic data
Keep reading
Sources
- South32, Quarterly Report June 2026 (ASX, 20 July 2026): announcements.asx.com.au
- Geoscience Australia, AIMR 2026 Preliminary Tables: ga.gov.au
- Geoscience Australia, AIMR 2020 Commodity Summaries: ga.gov.au
- Geoscience Australia, AIMR 2010: ga.gov.au
- USGS, Mineral Commodity Summaries 2026: Silver: pubs.usgs.gov
- MMG, 4th quarter production report (22 January 2026): mmg.com
- MMG, Annual Report 2024, Management Discussion and Analysis: mmg.com
- Glencore, Full Year 2025 Production Report: glencore.com
- Broken Hill Mines, Quarterly Activities Report March 2026: bulletin.webull.com
- Silver Mines Limited, Bowdens approvals announcement (16 September 2026): investorpa.com
- Kitco, Silver price chart (15 October 2026): kitco.com
- Glencore, Full Year 2025 Production Report tables: glencore.com
- BHP, Operational Review for the year ended 30 June 2026: bhp.com
Discussion
Questions, corrections or field experience? Share them below. First-time comments are reviewed before they appear, and your email is never published.
No comments yet. Be the first to add a question or your experience.

 GKY Mining
 Alkimy SARL
 Double A Trading
 GemSprout Metals Limited
 Qader Group
 Ileys General Trading
 SG Gold Mining LLC
 VRV Global Pte Ltd
 Omsri International FZE
 G.I.T.T.
 Jaunita Erss Ltd
 Almosi SARL
 SRK Consulting
 Berks Gold Limited
 Mwerezi Minerals Company Limited
 Mining SARL
 SenGold Invest SAS
 Sean Mining Limited
 NTS Group (Pty) Ltd











