

Gold technology · Ranked guide
Gold Mining Technology: 7 Innovations Ranked by Evidence
Autonomous haulage, ore sorting, satellite mapping, biooxidation, tailings reprocessing, digital twins and 3D modelling, ranked by how much public evidence backs each. Includes an ore sorting calculator.
Key takeaways
- Komatsu reported its 1,000th autonomous ultra-class truck in April 2026, placed at Nevada Gold Mines (International Mining, 21 April 2026).
- An 80-tonne Cariboo test rejected 42-59% of feed as waste and kept 84-92% of the gold, depending on particle size (Osisko Development, July 2025).
- DRDGOLD treated 25.07 million tonnes of tailings at 0.193 g/t to produce 4,839 kg of gold in FY2026 (DRDGOLD results, August 2026).
- Biooxidation operating cost could be about one third of pressure oxidation or roasting, depending on method, in a paper evaluation (University of Arizona, IMPC 2016).
- World mine output was about 3,300 tonnes in 2025 on USGS estimates and 3,672 tonnes on World Gold Council estimates; datasets differ.
In this article
- Gold mining technology: which of the seven changes the numbers
- How we ranked the seven technologies
- Why technology matters more as grade falls
- 1. Autonomous haulage: driverless trucks at gold mines
- 2. X-ray ore sorting before the mill
- 3. Satellite mapping before you drill
- 4. Biooxidation for refractory gold ore
- 5. Tailings reprocessing: gold from old waste
- 6. Digital twins and plant sensors
- 7. 3D modelling and drill planning
- Gold ore sorting calculator: tonnes, ounces and the gold you reject
- What to check before you adopt any of these
- Frequently asked questions
Gold mining technology: which of the seven changes the numbers
The gold mining technologies with the strongest published evidence today are autonomous haul trucks, X-ray ore sorting, satellite mapping before drilling, biooxidation, tailings reprocessing, digital twins and 3D modelling. They do different jobs, and only some of them reduce cost per ounce on a typical mine. This guide ranks the seven by how much public, checkable evidence exists for each, gives the best published number for each, and ends with a calculator for ore sorting: what it does to the tonnes you send to the mill.
It is written for mining consultants and project owners who must decide where to spend first. Mining here means gold extraction; for the wider picture of what mining does to land and water, see our guide to the effects of mining on the environment. Grade means the amount of gold in a tonne of rock, measured in grams per tonne (g/t). A tonne is 1,000 kg; a troy ounce is 31.1035 g.
How we ranked the seven technologies
The table follows the order of the sections below. We graded each technology by one metric: the strength of the evidence in documents you can open yourself. Company press releases and stock-exchange filings count as evidence of what a company reports, not as independent proof. Where a number comes from a supplier or a single test, the table says so.
| No. | Technology | Where it acts | Best published number | Evidence type |
|---|---|---|---|---|
| 1 | Autonomous haulage | Moving ore and waste | 1,000 autonomous ultra-class trucks commissioned by one supplier (April 2026) | Supplier report, trade press |
| 2 | X-ray ore sorting | Before the mill | 42-59% waste rejected with 84-92% gold recovered in an 80-tonne test | Company test release |
| 3 | Satellite mapping | Early exploration | 13 spectral bands, 5-day revisit at the Equator | Agency specification |
| 4 | Biooxidation | Refractory ore | Operating cost could be one third of pressure oxidation or roasting, depending on method | Conference paper |
| 5 | Tailings reprocessing | Old waste dumps | 4,839 kg of gold from 25.07 million tonnes at 0.193 g/t (FY2026) | Company results (reviewed financial statements) |
| 6 | Digital twins | The processing plant | R-squared near 0.9 on data from one plant | Conference paper |
| 7 | 3D modelling | Drill planning | Fault control and a new plunge found at one deposit | Consultant case |
Satellite mapping ranks last on this metric only because its gains are hard to publish for individual projects, not because it matters least; it is the only technology on the list that works before you hold any ground data.
Why technology matters more as grade falls
World mine production was about 3,300 tonnes in 2025 (estimate), and the top seven countries produced roughly 1,620 tonnes of it (USGS Mineral Commodity Summaries, 2026). The World Gold Council puts 2025 mine production at a provisional 3,672 tonnes, a gain of about 1% that only just passes the 2018 record, and warns that the figures are subject to revision (World Gold Council, Gold Demand Trends, full year 2025). The two agencies use different datasets, which is why the totals differ.
Chart
Average gold price, United States table
US$ per troy ounce, annual average
Chart
Largest gold mine producers
Tonnes of gold, 2025 estimate
World output was nearly flat in 2025 (3,280 tonnes in 2024, an estimated 3,300 in 2025) while the price rose. The USGS average price in its US table went from US$1,801 per troy ounce in 2021 to an estimated US$3,300 in 2025. A higher price pays for lower-grade ore, and lower-grade ore needs more tonnes moved and treated per ounce. An AusIMM paper on AngloGold Ashanti ore says mines have delivered lower grades and more complex mineralogy, so mills must process more material to meet plan (AusIMM, World Gold 2019). Every technology below is a way of moving fewer tonnes, treating them better, or finding the right ones sooner.
1. Autonomous haulage: driverless trucks at gold mines
Autonomous haulage means large trucks that follow a fleet-management system instead of a driver. Komatsu reported in April 2026 that it had commissioned its 1,000th autonomous ultra-class haul truck, a 290-tonne-payload 930E-5AT working at Barrick’s Nevada Gold Mines in the United States, and that its customers have moved more than 11.5 billion tonnes with the system (International Mining, 21 April 2026). Nevada Gold Mines and Komatsu announced the partnership in July 2025 to automate 300-tonne and 230-tonne trucks on its surface operations, with a private 5G network from Sedna and Nokia carrying the data (Nevada Gold Mines press release, 31 July 2025).
Productivity numbers mostly come from iron ore, where the technology is older. Caterpillar reported in 2019 that autonomous haulage had delivered a 30% improvement in productivity at Fortescue’s iron ore site (Canadian Mining Journal, 13 November 2019). That is a supplier-quoted figure from a very large single-commodity iron ore operation. Treat it as an upper marker, not a forecast for a mid-sized gold pit.
Best for: open pits with long, steady haul cycles. Pros: fewer people near moving trucks, steadier fleet behaviour. Cons: needs a reliable network and road discipline, and it moves rock faster without making the rock richer.
2. X-ray ore sorting before the mill
Ore sorting uses sensors, such as X-ray transmission (XRT), to scan rock on a belt and blow waste out with air jets before grinding. Two terms matter. Mass pull is the share of feed that is kept; waste rejection is the rest. Upgrade ratio is the sorted grade divided by the feed grade, so a ratio of 2.0 turns a 2 g/t feed into 4 g/t.
Chart
Ore sorting test by particle size
Cariboo project, about 80 tonnes, XRT sorter
Osisko Development tested about 80 tonnes from its Cariboo project in British Columbia and reported 42-55% waste rejection with 84-89% gold recovery in the 10-30 mm and 30-70 mm size fractions, and 59% rejection with 92% recovery in a 6-10 mm fraction that had not been tested before (Osisko Development release, 7 July 2025, corrected). Its feasibility study assumed an upgrade ratio of 1.95; the test gave 2.0 to 2.1. The AusIMM paper on AngloGold ores says its method showed potential for gold recovery above 95% at a 40% mass pull using one or two pre-concentration steps; that is a potential, not a plant result.
The trade-off is plain in the chart: coarse rock rejected less waste and lost more gold. The company also estimated that 76% of the gold in the sample sat in the fines size fraction, against 45% assumed in the feasibility study, so the sorter is only one part of the flow sheet. The calculator below turns these test ratios into tonnes, ounces and the value of gold that leaves with the waste.
Best for: deposits where gold sits in veins in barren host rock. Pros: less material sent to the mill, which can open up mill capacity and lower the cut-off grade. Cons: results depend on rock texture, so a bulk test on your own ore is required before any decision.
3. Satellite mapping before you drill
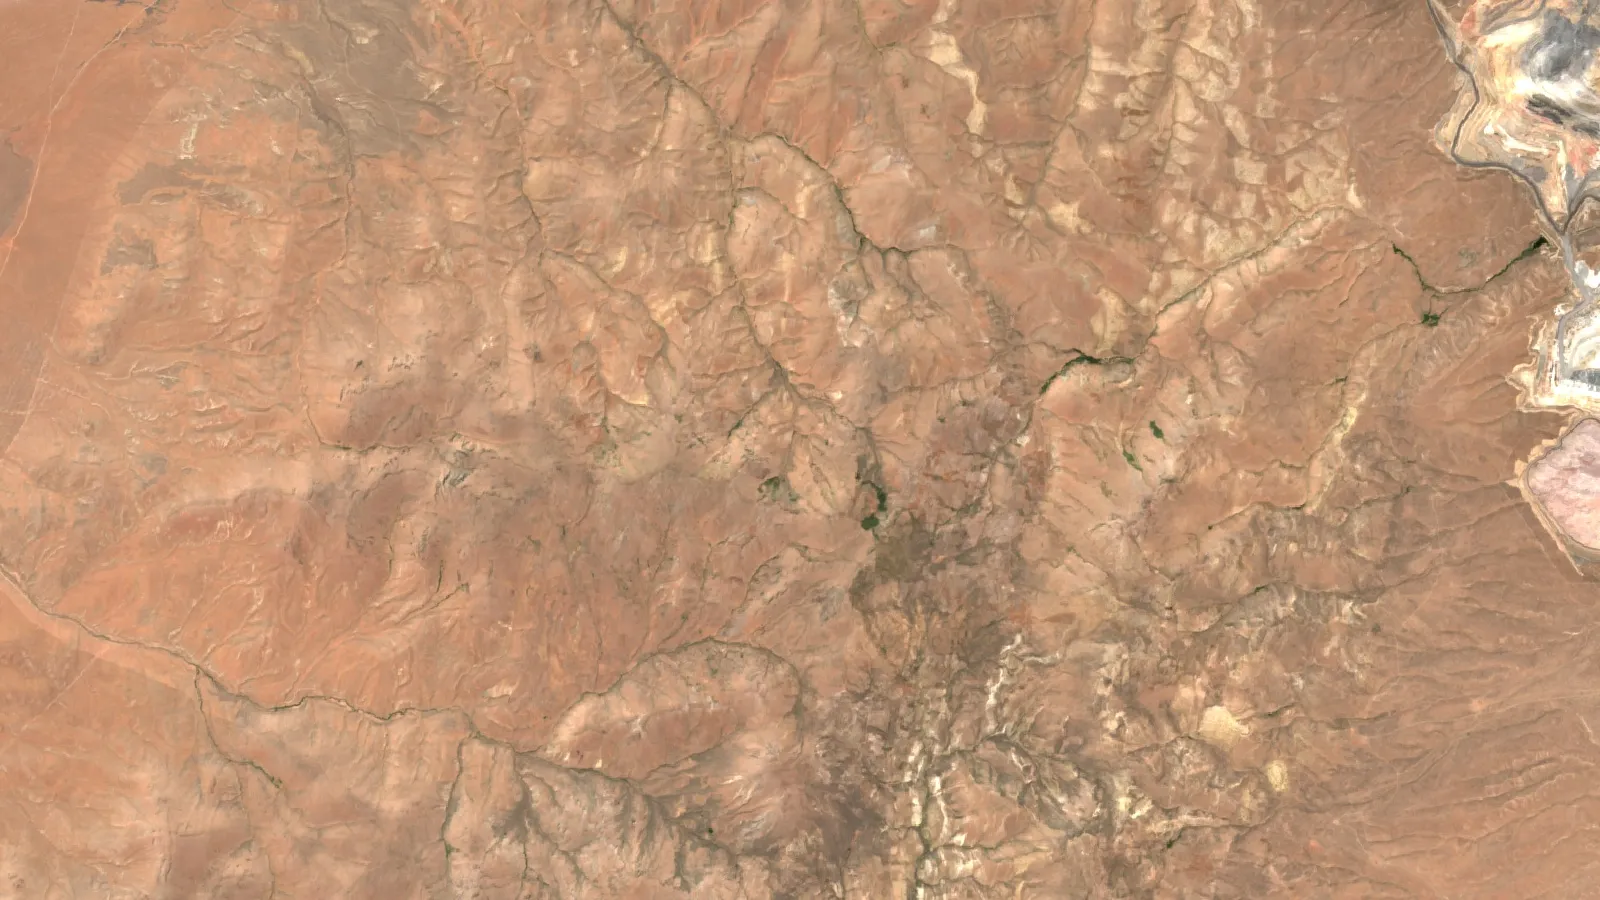
Satellites do not see gold. They see the rock and soil around it. Gold systems often leave altered rock, for example the sericite, carbonate and pyrite alteration described at the Golden Mile in Kalgoorlie, Western Australia (Geoscience Frontiers, 2016). Sentinel-2 carries 13 spectral bands from visible light to short-wave infrared, at 10, 20 and 60 m pixels, and the two-satellite pair revisits the Equator every 5 days (Copernicus SentiWiki, Sentinel-2 mission). Mapping those bands lets a geologist rank areas for ground work before a rig or a field crew is booked.
The output is an exploration target, which sits ahead of a resource estimate. It tells you where to look first; drilling still decides what is there. Our video below explains what a satellite can and cannot tell you about gold. Farmonaut applies this approach to a client’s licence boundary; read more on our satellite mineral detection page.
Best for: large or poorly mapped licences. Pros: no ground disturbance, covers many hectares quickly. Cons: cloud, soil and vegetation cover can hide the signal, and a map cannot give grade.

▶ Explains how satellites help find gold by mapping rusty stains, clay minerals and faults rather than gold itself. · 4:25
4. Biooxidation for refractory gold ore
Refractory ore holds gold inside sulphide minerals, so cyanide cannot reach it. Biooxidation uses bacteria to break down the sulphides first. A University of Arizona paper presented at the 2016 International Mineral Processing Congress says biooxidation can be a very attractive alternative to pressure oxidation or roasting, that its capital cost can be a fraction of a pressure-oxidation plant, and that its operating cost could be about one third of pressure oxidation or roasting, depending on the method used (University of Arizona, IMPC 2016). The same abstract notes that crushed-heap bioleaching worked in the United States and that tank bioleaching of concentrate is running at operations around the world.
The World Gold Council lists biomining, meaning metal recovery with the help of micro-organisms, among the process changes that could cut the emissions of gold production (World Gold Council, Gold and climate change). That is a statement of potential. Biooxidation does not remove the need for a leach circuit afterwards, and each ore needs its own test work.
Best for: sulphide-hosted ore where roasting or pressure oxidation is too costly. Pros: lower operating cost in the paper’s evaluation. Cons: cost depends on crush size and method, and each ore needs its own test work.
▶ Follows gold from rock to ring: drilling, crushing, leaching, carbon recovery and refining. · 5:27
5. Tailings reprocessing: gold from old waste
Tailings are the finely ground waste left after processing. Where old tailings still carry gold, a company can pump them to a new plant. DRDGOLD, listed in Johannesburg and New York, does this around Johannesburg through its ERGO and Far West Gold Recoveries operations. In its year to June 2026 it processed 25.07 million tonnes at an average yield of 0.193 g/t and produced 4,839 kg of gold; its all-in sustaining cost was R1,078,068 per kg (DRDGOLD annual results, FY2026). It describes a roughly R10 billion programme, Vision 2028, to lift output towards six tonnes a year (DRDGOLD media release, 19 August 2026).
The lesson is the grade. A yield of 0.193 g/t is about one-tenth of the 2 g/t used in the calculator example. The material is already mined and milled, and DRDGOLD moves it by pipeline to large plants: 25.07 million tonnes in FY2026. A small tailings dump with similar grade would not pay.
Best for: large, accessible tailings with known gold content. Pros: no new mine, and the dump becomes a managed storage facility. Cons: thin margins at low grade, and water and storage licences can delay projects, as the same results show for a reclamation pump station.
6. Digital twins and plant sensors
A digital twin is a computer model of a plant that predicts its output from live measurements. A conference paper built a physics-plus-AI model of a carbon-in-leach plant from Barrick’s Cortez operation in Nevada, covering the path from stockpile to the last tank, and reported an R-squared near 0.9 on its predictions (AusIMM, Future Mining Conference 2019). R-squared is a score from 0 to 1 for how closely predictions follow measurements. The authors point out that unknown ore composition, poor sensors and uneven measurement intervals limit any such model.
The result shows the model can follow the plant. It does not, on its own, show a gain in recovery in ounces, and the cited abstract reports no recovery gain. For a plant manager, the practical step is better sensors and cleaner data first. Our overview of technological innovations in mining covers the safety side of the same tools.
7. 3D modelling and drill planning
Implicit 3D modelling builds a smooth model of rock units and grade from drill data, instead of tracing each section by hand. SRK Consulting describes using Leapfrog at the Maud Creek gold project in Australia: drilling, pit mapping, regional geology and geophysics went into one model, which showed strong fault control on gold, with gold dipping along the main fault, and a previously unrecognised south-east plunge (SRK Consulting, Geological and structural modelling). That kind of finding changes where the next holes go.
Best for: deposits with structural control and enough drill holes. Pros: exposes trends that are easy to miss on paper. Cons: a model is only as good as the logging behind it, and it is an interpretation, not a measurement.
One more point on reading these numbers: a technology that works at a 20-million-tonne tailings plant or a 290-tonne-truck fleet says little about a small underground vein mine. Match the technology to the size of the operation first, then to the ore. For a licence owner with no drilling yet, the order is usually satellite screening, then ground checks and sampling, then 3D modelling once holes exist, and only then a decision on sorting or processing changes. Haulage automation comes last, because it pays only when there is a steady tonnage to move.
Gold ore sorting calculator: tonnes, ounces and the gold you reject
Use the calculator in this section with your own test results. The defaults are the Cariboo mid-size fraction (45% mass pull, 89% recovery) applied to a round 100,000 tonnes at 2 g/t. They are an example, not a prediction for your ore.
Calculator
What does ore sorting do to your tonnes and ounces?
Enter your feed, grade and test results. Defaults are examples.
- Tonnes sent to the mill: 45,000 tonnes
- Gold in the sorted feed: 5,723 oz
- Gold lost with the waste: 707 oz
- Value of gold lost with the waste: $2,829,264
Example values only, not a benchmark. Defaults use the Cariboo 10-30 mm test result (Osisko Development, July 2025). The gold price is an input in US$ per troy ounce: example, use today’s price. One troy ounce is 31.1035 g.
What to check before you adopt any of these
- Ask for the test on your ore. Ore sorting, biooxidation and tailings plants all depend on mineralogy. A result from another deposit is a reason to test, not a result.
- Separate the supplier claim from the site result. The 30% haulage figure and the 1,000-truck milestone are supplier reports.
- Price the whole chain. A sorter that rejects waste still leaves you with a smaller mill, a stockpile of reject and a recovery loss; add all three to the model.
- Check the permits and the network. Autonomous fleets need radio coverage; tailings plants need water and storage licences.
- Start with the cheapest information. Screening a licence by satellite and by 3D review of existing drilling costs less than any plant change. If you want a site screened, request a quote through our mining query form or contact us.
For field methods that sit alongside these tools, see our guide to mining prospecting for gold.
Frequently asked questions
What is the newest technology in gold mining?
No single technology is newest. The most recent milestones in this guide are autonomous haulage reaching 1,000 trucks (April 2026), sorting tests on fine 6-10 mm particles made possible by AI (July 2025) and tailings plants expanding (FY2026).
How does ore sorting work in gold mining?
Rock passes on a belt under sensors such as X-ray transmission. A computer decides ore or waste for each piece, and air jets eject waste. Only the kept share goes to the mill.
Can satellites find gold?
No. Satellites map the rock and alteration around gold systems. The output is a ranked list of places to check on the ground, and drilling confirms what is there.
What is a refractory gold ore?
It is ore in which gold is locked inside minerals such as pyrite, so normal cyanide leaching recovers little. It needs a pre-treatment such as roasting, pressure oxidation or biooxidation.
Is reprocessing tailings profitable?
It can be at very large scale. DRDGOLD recovers gold from tailings that average 0.193 g/t, using large plants and pipelines. Small dumps with similar grade are unlikely to pay.
Are autonomous trucks used at gold mines?
Yes. Komatsu reports that its 1,000th autonomous ultra-class truck went to Nevada Gold Mines, a gold operation, and Nevada Gold Mines announced a fleet automation partnership in July 2025.
What is a digital twin in a gold plant?
It is a computer model of the plant, fed by sensors, that predicts results such as recovery. A published model of a Nevada carbon-in-leach plant reached an R-squared near 0.9.
Which technology cuts cost the most?
There is no public ranking across ore types. The strongest single numbers are biooxidation operating cost that could be one third of pressure oxidation or roasting, depending on method (paper evaluation) and sorting that removes 42-59% of feed as waste in one test.
How is gold produced worldwide?
The USGS estimates 3,300 tonnes of mine production in 2025, led by China, Russia and Australia. The World Gold Council estimates 3,672 tonnes using a different dataset.
Do these technologies reduce environmental impact?
Some can. Sorting means less rock is ground, and tailings reprocessing turns old waste into a managed facility. Each project still needs its own environmental review.
This page is for information only. It is not investment advice or engineering advice. Test any technology on your own ore and confirm permits with the regulator.
Farmonaut mining
Map your mining site from space
Consultants can see how a satellite screen ranks a licence area as an exploration target, ahead of a resource estimate, before planning field work.

Mining Pro sample view, synthetic data
Keep reading
Sources
- USGS, Mineral Commodity Summaries 2026: Gold: pubs.usgs.gov
- World Gold Council, Gold Demand Trends full year 2025: supply: gold.org
- International Mining, Komatsu commissions 1,000 autonomous ultra-class trucks (21 April 2026): im-mining.com
- Nevada Gold Mines and Komatsu, autonomous haulage partnership (31 July 2025): s25.q4cdn.com
- Canadian Mining Journal, Caterpillar and Fortescue autonomous haulage (13 November 2019): mining.com
- Osisko Development, Cariboo bulk ore sorting results (7 July 2025, corrected): manilatimes.net
- AusIMM, Sensor-based ore sorting applied to gold ores (World Gold 2019): ausimm.com
- Copernicus SentiWiki, Sentinel-2 mission: sentiwiki.copernicus.eu
- Geoscience Frontiers, The giant Kalgoorlie Gold Field revisited (2016): geosciencefrontiers.com
- University of Arizona, Economic evaluation of biooxidation of gold ores (IMPC 2016): experts.arizona.edu
- World Gold Council, Gold and climate change: current and future impacts: gold.org
- DRDGOLD, annual results FY2026: drdgold.com
- DRDGOLD, FY2026 media release (19 August 2026): drdgold.com
- AusIMM, Physics-AI hybrid digital twin for gold recovery (2019): ausimm.com
- SRK Consulting, Geological and structural modelling: srk.com
Discussion
Questions, corrections or field experience? Share them below. First-time comments are reviewed before they appear, and your email is never published.
No comments yet. Be the first to add a question or your experience.

 Lithspo Minerals Limited
 Tintina Mining Group
 Dalgety Minerals Pty Ltd
 Vortex Minerals Pty Ltd
 Faith At Work (Pty) Ltd
 Geotech Mining Solutions plc
 Vulcan International Limited
 Kidepo Associates
 GKY Mining
 Alkimy SARL
 Double A Trading
 GemSprout Metals Limited
 Qader Group
 Ileys General Trading
 SG Gold Mining LLC
 VRV Global Pte Ltd
 Omsri International FZE
 G.I.T.T.
 Jaunita Erss Ltd
 Almosi SARL
 SRK Consulting
 Berks Gold Limited
 Mwerezi Minerals Company Limited
