

Hunter Valley, NSW · Mine list and map guide
Hunter Valley Coal Mines Map and Mine List
Twelve Hunter Valley coal mines with owner, latest reported output and approval status, plus where to see lease boundaries on the official NSW map. Includes charts of output and royalties and a royalty calculator.
Key takeaways
- Mt Arthur (BHP) reported 16.4 Mt in the year to June 2026 and plans to close in 2030; Bengalla sold 10.2 Mt saleable in the year to July 2026 (BHP and New Hope, 2026).
- HVO is owned 51% by Yancoal and 49% by Glencore; the NSW Independent Planning Commission approved it to the end of 2045 on 30 September 2026, with federal approval still pending (Yancoal, 2026).
- On 7 October 2026 the High Court dismissed MACH Energy’s appeal on Mount Pleasant, so scope 3 emissions must be considered; the mine’s permit runs to the end of 2032 (ABC, 2026).
- NSW open-cut coal pays a 10.8% royalty; the state collected about A$2.84 billion in coal royalties in 2025-26 (NSW Resources).
- Port Waratah exported 96.5 Mt through its Newcastle terminals in 2025, against 100.8 Mt in 2024 (Port Waratah, 2026).
In this article
- Hunter Valley coal mines map: where the main mines sit
- List of Hunter Valley coal mines with owners and output
- How we chose these mines and how to read the output figures
- How open-cut coal mining works in the Hunter
- Hunter Valley coal mines by size: what the figures show
- Hunter Valley Operations: the approval that matters most
- Mount Pleasant and the High Court ruling on emissions
- Mines that are closing or closed
- NSW coal royalties and what a Hunter mine pays
- From Hunter pit to Newcastle port
- Looking at a mine site from space
- What to check before relying on a Hunter coal project
- Frequently asked questions
The Hunter Valley coal mines sit in the Upper Hunter, a belt of open cuts around Singleton and Muswellbrook in New South Wales (NSW), Australia. The biggest names are Hunter Valley Operations (HVO), Mount Thorley Warkworth, Mt Arthur, Bengalla, Mangoola and Ravensworth. Most produce thermal coal, which burns in power stations; several also make semi-soft or metallurgical coal for steel. This page lists the main mines by town, owner and latest reported output, and shows how to pull up the official title maps yourself.
Australia had 93 operating black coal mines in 2022, and NSW produced 43% of the country’s black coal that year (Geoscience Australia, 2024 resources assessment). The Hunter is only one of the NSW coalfields, so it is not the whole state. The coal sits in the Sydney Basin, which Geoscience Australia puts at 15,757 million tonnes (Mt) of economic demonstrated resources (a measured, mineable category) at 31 December 2022.
Hunter Valley coal mines map: where the main mines sit
No single public page draws every Hunter coal mine on one map with owners and output, so use this section as a guide and the official layers as the base map. The NSW Department of Primary Industries and Regional Development runs MinView, a web map that lets anyone view, search and download NSW geoscience data, including current and historic exploration and mining titles. Type a mine name or a town into the search box, switch on the title layers, and you can see the lease boundary of any mine on this page.
The operators’ own pages give straight-line distances, which is enough to place the mines on the ground:
- North and west of Singleton: the Mt Owen complex is 20 km north of Singleton (Glencore). Liddell is about 25 km north-west of the town (Glencore). United Wambo is 16 km west (Glencore).
- South-west of Singleton: Bulga open cut is 15 km south-west, near the villages of Broke and Bulga (Glencore).
- Between the two towns: Ravensworth Operations lies between Muswellbrook and Singleton, and its coal goes to the Port of Newcastle (Glencore).
- West of Muswellbrook: Mangoola is in the Wybong area, 20 km west of Muswellbrook and 10 km north of Denman (Glencore).
- Around Singleton and Muswellbrook: HVO is near the Upper Hunter town of Singleton (HVO). Mt Arthur and Mount Pleasant are both near Muswellbrook.
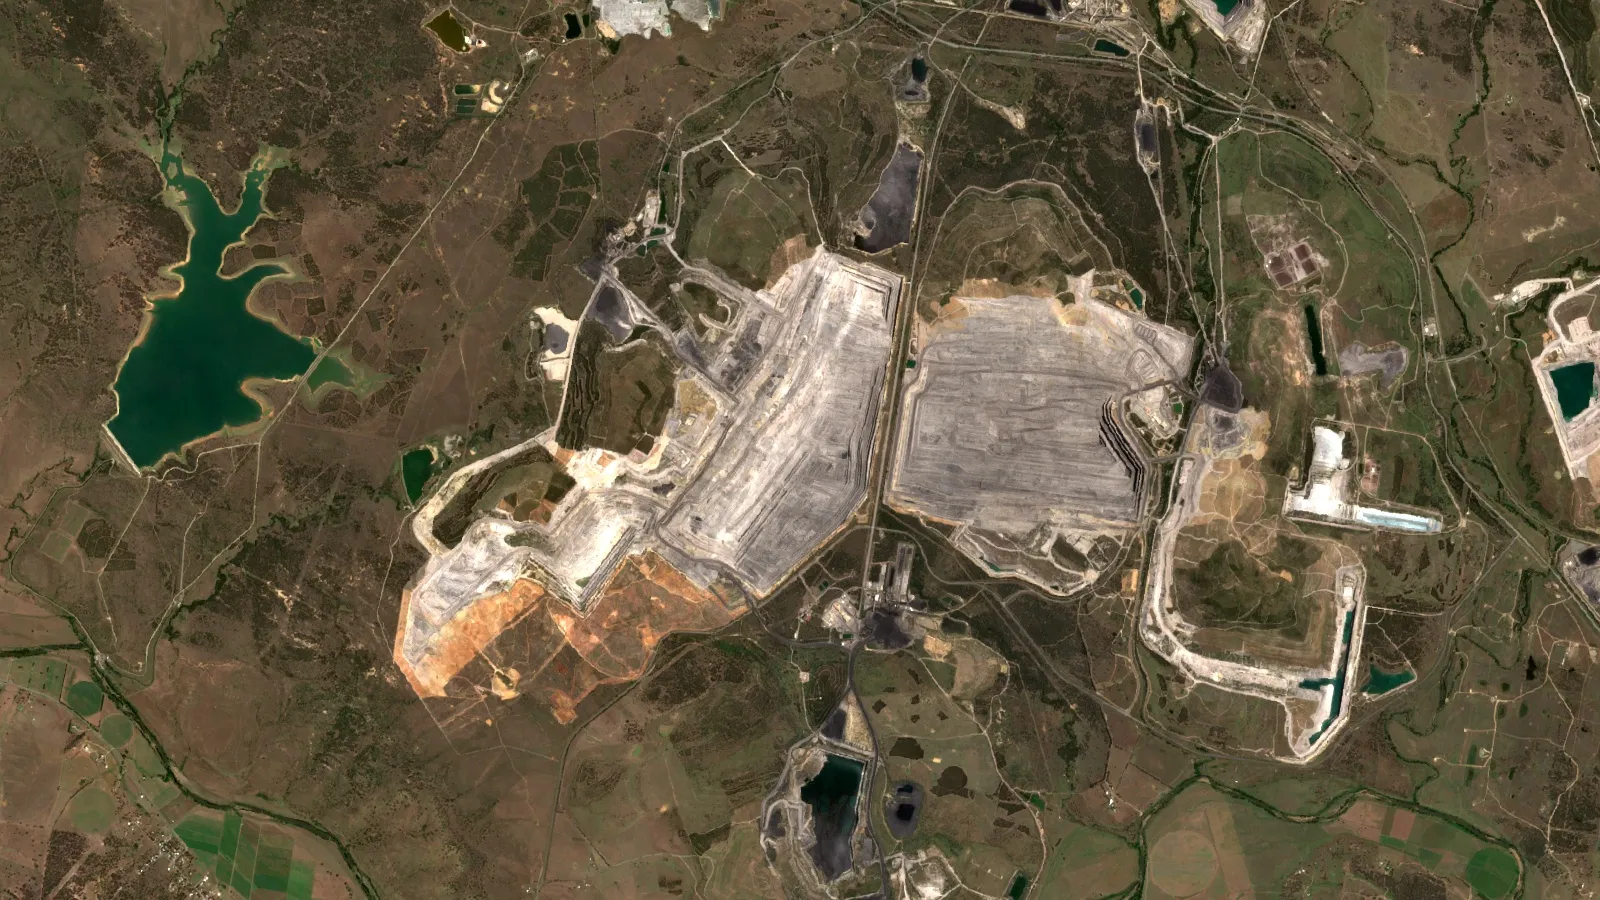
For a picture of the ground itself, the hero image on this page is a Sentinel-2 satellite composite of the Singleton area. At 10 m resolution you can see pit outlines, waste dumps (the piles of rock moved to reach the coal) and rehabilitated slopes, but not coal seams; those are mapped from drill holes.
List of Hunter Valley coal mines with owners and output
The table covers the larger operations that have recent operator or company reports. It is not a complete census: smaller mines, such as Rix’s Creek, and underground operations that report only to the regulator are left out because no 2025 or 2026 output figure was found for them in the sources opened for this page. Output is saleable coal (washed, ready to sell) unless the row says otherwise, and each figure keeps its own reporting period.
| Mine | Owner (as reported) | Latest output reported | Status |
|---|---|---|---|
| Hunter Valley Operations (HVO) | Yancoal 51%, Glencore 49% | 7.4 Mt saleable in the first half of 2026 (100% basis) | State approval to the end of 2045 granted 30 September 2026; federal approval pending |
| Mount Thorley Warkworth | Yancoal, 83.6% economic interest | 5.4 Mt saleable in the first half of 2026 (100% basis) | Operating; underground option under assessment |
| Mt Arthur | BHP, 100% | 16.4 Mt in the year to June 2026 | BHP plans to close the mine in 2030 |
| Bengalla | New Hope, 80% | 10.2 Mt saleable in the year to July 2026 (100% basis) | Operating |
| Mangoola | Glencore, 100% | 9.9 Mt saleable in 2025 | Operating; consent granted April 2021 |
| Ravensworth Operations | Glencore, 100% | 8.5 Mt saleable in 2025 | Operating |
| Bulga open cut | Saxonvale 87.5%, Nippon Steel Australia 12.5% | 6.9 Mt saleable in 2025 | Operating |
| United Wambo | 50:50 joint venture, Glencore group and Peabody | 6.2 Mt saleable in 2025 | Operating |
| Mt Owen complex | Glencore, 100% | 4.2 Mt saleable in 2025 | Operating |
| Mount Pleasant | MACH Energy | No recent figure found in company reports | NSW permit allows mining to the end of 2032; 2022 expansion approval halted by the NSW Court of Appeal in 2025 |
| Ashton (underground) | Yancoal, 100% | 0.8 Mt saleable in the first half of 2026 | Operations to cease from early 2028 |
| Liddell | Glencore, 100% | None; last coal mined in 2023 | Closure and rehabilitation |
Sources for the table: Yancoal June 2026 quarterly report (HVO, Mount Thorley Warkworth, Ashton), BHP operational review for the year to June 2026 (Mt Arthur), New Hope full-year results to 31 July 2026 (Bengalla), and the Glencore site pages linked above (2025 output).
How we chose these mines and how to read the output figures
The ranking metric is the latest saleable or reported production that the operator itself publishes, taken from an annual or quarterly report or the operator’s site page. Three cautions apply before you compare rows.
- Glencore rows are saleable. Glencore’s site pages report 2025 saleable product, not ROM, for Mangoola, Ravensworth, Bulga, United Wambo and the Mt Owen complex.
- Periods differ. Glencore reports calendar 2025; BHP reports the year to 30 June 2026; New Hope reports the year to 31 July 2026; Yancoal reports half-years. A column that mixes them is a snapshot, not a league table.
- Saleable is not run-of-mine (ROM). ROM is the coal as dug, including rock and moisture; saleable is what is left after washing. Bengalla, for example, mined 12.5 Mt ROM and sold 10.2 Mt saleable on a 100% basis in the year to July 2026 (New Hope).
- Ownership shares change what “attributable” means. Yancoal reports HVO at 51%, but the output in the table is the whole mine. New Hope’s headline Bengalla numbers are on its 80% interest; the table uses the 100% line.
Mt Arthur’s figure is BHP’s reported production for its NSW energy coal business, which is only Mt Arthur; BHP’s review does not label it saleable. Mount Pleasant is shown without a number because the sources opened here gave no output for it.
How open-cut coal mining works in the Hunter
An open-cut mine removes soil and the rock above the coal, then digs the exposed seam. Mangoola, Mt Owen and Glendell, Bulga and United Wambo are described by Glencore as open-cut operations; Ashton is underground. Cost per tonne falls when the strip ratio is low, which is why BHP says it is mining lower-strip areas of Mt Arthur as it heads to closure.
The disadvantage is the footprint. The overburden has to go somewhere, the pit floor has to be drained or pumped, and the land has to be reshaped and replanted at the end. Rehabilitation planning is therefore part of the mine design from the start, not an afterthought.

▶ Explains strip (surface) mining, where soil and rock above the coal are removed first. · 4:37
Hunter Valley coal mines by size: what the figures show
Mt Arthur led the group in its last reported year at 16.4 Mt, up 9% on 15.0 Mt the year before, and BHP expects 14 to 16 Mt in the year to June 2027 as it works lower-strip areas ahead of closure in 2030 (BHP, 2026). Strip ratio is the volume of waste rock that must be moved for each tonne of coal; a low ratio means cheaper coal.
Chart
Latest reported output at seven Hunter mines
Million tonnes; periods differ (see labels)
Below it, Bengalla, Mangoola and Ravensworth each sold between 8 and 10 Mt. Bengalla’s 2026 year followed a recovery from wet weather in the Hunter that disrupted the pit sequence late in the prior year; New Hope says the mine returned to its 13.4 Mt per year ROM rate in the second half (New Hope, September 2026). Its cash cost before royalty was A$81.3 per tonne sold, up from A$76.5.
At Yancoal, the first half of 2026 was higher than a year earlier at HVO (7.4 Mt against 6.6 Mt) and at Ashton, and about level at Mount Thorley Warkworth. Yancoal says the second-quarter lift came from a planned move from waste removal to coal mining, and that its average realised price in that quarter was A$160 per tonne (Yancoal, July 2026).
Hunter Valley Operations: the approval that matters most
HVO is two mines, HVO North and HVO South, run by a joint venture in which Yancoal holds 51% and Glencore 49%, according to the HVO site. It makes thermal and semi-soft metallurgical coal and supports up to 1,500 jobs, according to the HVO site; Yancoal’s September 2026 release refers to about 1,570 mine workers.
Chart
Saleable coal at three Yancoal Hunter mines, a year apart
Million tonnes, 100% basis
On 30 September 2026 the NSW Independent Planning Commission approved the HVO Continuation Project, which extends mining at the complex to the end of 2045. That decision ended a six-year state process, but the mine still needs federal environmental approval by 31 December 2026 (Yancoal market release). The HVO site describes the plan as extending HVO North from 2026 to 2045 and HVO South from 2030 to 2042. Yancoal says current HVO operations are not affected while the approvals proceed.
A planning approval is not a mining licence by itself: the mine also holds mining leases, and the project must stay inside lease boundaries. Yancoal’s quarterly report describes the extension as sitting within the existing mining leases, which is why the lease layers in MinView are the quickest way to see what the project changes on the ground.
Mount Pleasant and the High Court ruling on emissions
Mount Pleasant, near Muswellbrook, is operated by MACH Energy. A NSW permit issued in August 2026 allows it to operate to the end of 2032. The larger plan, approved by NSW authorities in 2022, would take total output to 444 Mt of coal until 2048 and almost double the annual rate. On 7 October 2026 the High Court dismissed MACH’s appeal against a lower court finding that the 2022 approval had to consider emissions from burning the exported coal overseas, known as scope 3 emissions (ABC News, 7 October 2026).
The ruling does not close the mine. ABC reports that MACH says it will review the decision and pursue its options, and does not say what happens next to the 2022 expansion approval. Anyone modelling a Hunter project should expect scope 3 emissions to be part of the assessment.
Mines that are closing or closed
Three Hunter sites show what end of life looks like.
- Mt Arthur: BHP’s plan is to stop mining in 2030.
- Ashton: Yancoal decided in late June 2026 to cease operations at its underground mine from early 2028, citing technical, geotechnical and economic challenges.
- Liddell: Glencore mined its last coal in 2023. A May 2023 change to the development consent lets the final voids (the pits left after mining) be used for tailings and water storage until 2050.

▶ Walks through the seven environmental impacts of mining in plain words. · 2:31
NSW coal royalties and what a Hunter mine pays
NSW charges royalty on coal as a percentage of the value of disposals, less allowable deductions. The rates are 10.8% for open-cut coal, 9.8% for underground coal above 400 m and 8.8% for coal from below 400 m, with separate rules for coal reject (NSW Resources). A mine selling 5 Mt of open-cut coal at A$160 per tonne has about A$800 million of revenue; before deductions, the royalty would be about A$86 million. The calculator below lets you change each input.
Chart
NSW coal royalties collected each financial year
A$ million, whole state (not Hunter only)
Across NSW, coal royalties were A$2.84 billion in 2025-26 (preliminary) and A$2.95 billion in 2024-25, down from a peak of A$4.49 billion in 2022-23 (NSW Resources royalty page). These totals cover the whole state, not just the Hunter.
Calculator
What royalty does an open-cut coal mine pay in NSW?
Enter your own tonnes, price and deductions. Results update as you type.
- Revenue before deductions: $800,000,000
- Value after deductions: $720,000,000
- Royalty per tonne sold: $15.55
- Revenue after royalty: $722,240,000
Example values only, not benchmarks. The price is an input: use today’s price. The rate shown (10.8%) is the NSW open-cut rate and 9.8% or 8.8% apply to underground coal (NSW Resources). The royalty is a percentage of the value of disposals less allowable deductions, so enter your own deductions. All money in A$.
From Hunter pit to Newcastle port
Most Hunter coal leaves through Newcastle. Port Waratah Coal Services, which runs the Carrington and Kooragang coal terminals, exported 96.5 Mt in 2025, down from 100.8 Mt the year before after heavy weather mid-year; it expects customer demand of about 100 Mt in 2026, with Japan the largest destination and China second (Port Waratah community news). Weather is a real risk along the chain: New Hope cites Hunter weather events late in its 2025 financial year, and Port Waratah cites weather in 2025.
Looking at a mine site from space
Public satellite images such as Sentinel-2 are enough to track pit growth, spoil dumps and rehabilitation season by season, and they are a cheap first check before a site visit. They cannot replace drill data or a resource estimate; for how those estimates are staged, see mineral resource estimation from inferred to measured. For other Australian deposits, see Australia gold deposits by state.
Farmonaut screens licence areas from satellite data for the minerals on its detection list, such as gold, copper, lithium and uranium. Coal is not on that list, so the service is not a coal-seam finder. A consultant can send a KML, KMZ or polygon through the mining query form to ask whether a licence suits the service, read about satellite-based mineral detection, or contact us.
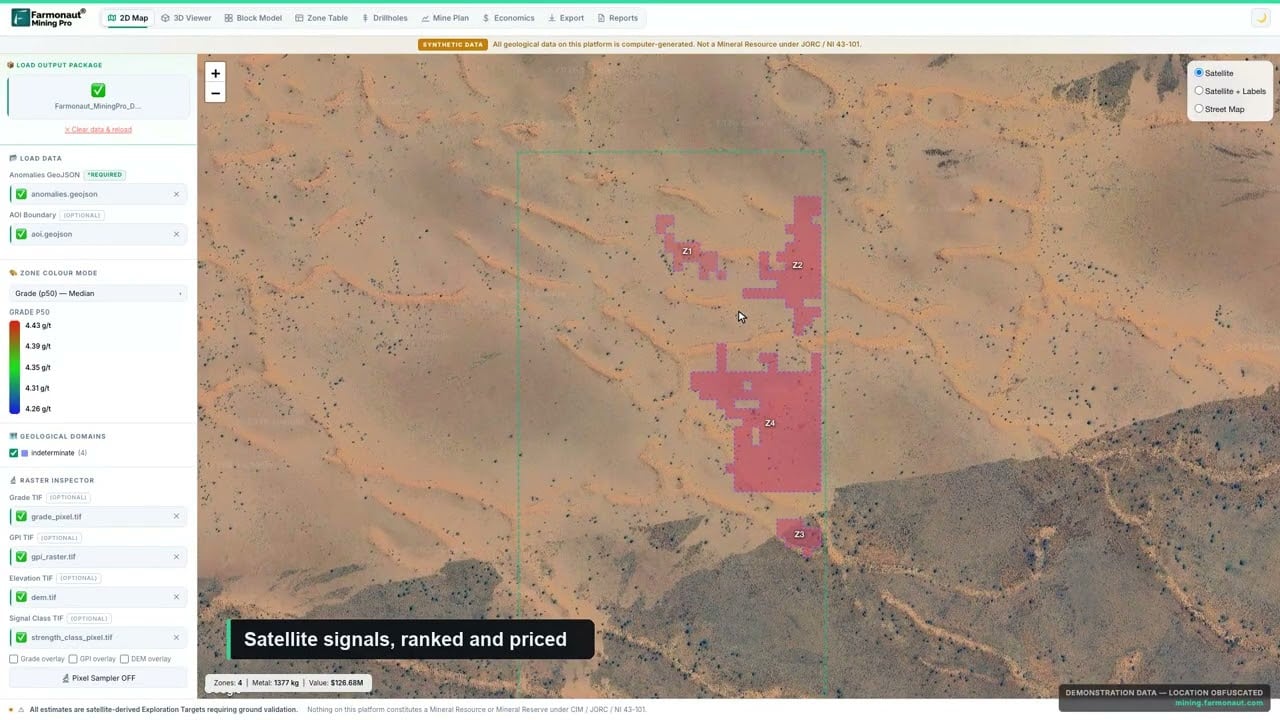
▶ A short look at Farmonaut Mining Pro, the satellite platform that turns a licence boundary into a geological picture. · 4:56
What to check before relying on a Hunter coal project
- The mine’s consent end date and whether a modification or continuation project is pending.
- Whether the figure you have is ROM or saleable, 100% or the owner’s share, and which year.
- Whether a federal approval under the national environment law is still required, as at HVO.
- Whether the assessment includes scope 3 emissions, after the Mount Pleasant ruling.
- Closure date and rehabilitation plans, as the Liddell and Mt Arthur examples show.
Frequently asked questions
Where are the Hunter Valley coal mines located?
They cluster around Singleton and Muswellbrook in the Upper Hunter of NSW. Mt Owen is 20 km north of Singleton, United Wambo 16 km west, Bulga 15 km south-west, and Mangoola 20 km west of Muswellbrook, according to the operators.
Which is the biggest coal mine in the Hunter Valley?
By the latest figures in this list, Mt Arthur, with 16.4 Mt produced in the year to June 2026 (BHP). Measured by the year to July 2026, Bengalla sold 10.2 Mt saleable. Periods and measures differ, so check the reporting basis before comparing.
Who owns Hunter Valley Operations?
The joint venture is owned 51% by Yancoal and 49% by Glencore, and it is run independently on behalf of the two partners.
Is Hunter Valley Operations approved to keep mining?
The NSW Independent Planning Commission approved the continuation project on 30 September 2026, extending mining to the end of 2045. It still needs federal environmental approval by 31 December 2026.
When will Mt Arthur close?
BHP plans to cease mining at Mt Arthur in 2030. It guides to 14 to 16 Mt of production in the year to June 2027.
What did the High Court decide about Mount Pleasant?
On 7 October 2026 the court dismissed MACH Energy’s appeal and left in place the finding that planners had to consider emissions from burning exported coal overseas. The mine can still operate to the end of 2032 under its current permit.
What is the NSW royalty rate on coal?
Open-cut coal pays 10.8% of the value of disposals less allowable deductions; underground coal above 400 m pays 9.8% and deeper underground coal 8.8% (NSW Resources).
Where can I see Hunter mining leases on a map?
Use MinView, the NSW geoscience web map, and switch on the exploration and mining title layers. It lets you search by title, address or local government area.
How much coal leaves Newcastle each year?
Port Waratah exported 96.5 Mt through its Carrington and Kooragang terminals in 2025, against 100.8 Mt the year before.
Does the Hunter Valley only produce thermal coal?
No. HVO and Mount Thorley Warkworth produce thermal and metallurgical coal, Ashton produces metallurgical coal, and several Glencore mines sell thermal and semi-soft metallurgical coal.
This page is for information only. It is not investment advice. Output figures are taken from operator reports for the periods stated and may be restated.
Farmonaut mining
Map your mining site from space
Send a KML, KMZ or polygon and Farmonaut screens the area from satellite images for the minerals on its detection list before ground crews go in.

Mining Pro sample view, synthetic data
Keep reading
Sources
- Geoscience Australia, Australia’s Energy Commodity Resources: Coal (2024 assessment): ga.gov.au
- NSW Department of Primary Industries and Regional Development, MinView: minview.geoscience.nsw.gov.au
- Glencore Australia, Mt Owen Glendell Open Cut (2025 figures): glencore.com.au
- Glencore Australia, Liddell Coal Operations: glencore.com.au
- Glencore Australia, United Wambo Open Cut (2025 figures): glencore.com.au
- Glencore Australia, Bulga Coal (2025 figures): glencore.com.au
- Glencore Australia, Ravensworth Operations (2025 figures): glencore.com.au
- Glencore Australia, Mangoola Open Cut (2025 figures): glencore.com.au
- Hunter Valley Operations, About us: hvo.com.au
- Yancoal Australia, Quarterly report, June 2026 quarter (ASX, 20 July 2026): announcements.asx.com.au
- BHP, Operational review for the year ended 30 June 2026 (ASX, 16 July 2026): announcements.asx.com.au
- New Hope Corporation, Full year results to 31 July 2026 (ASX, 15 September 2026): announcements.asx.com.au
- Yancoal Australia, Market release on the IPC decision on HVO Continuation Project (ASX, 30 September 2026): announcements.asx.com.au
- ABC News, High Court rules in favour of climate group in Hunter Valley coalmine case (7 October 2026): abc.net.au
- NSW Resources, Paying royalties (coal royalty rates): resources.nsw.gov.au
- NSW Resources, Royalties (collections by year): resources.nsw.gov.au
- Port Waratah Coal Services, Community news, 2026 edition 1: pwcs.com.au
Discussion
Questions, corrections or field experience? Share them below. First-time comments are reviewed before they appear, and your email is never published.
No comments yet. Be the first to add a question or your experience.

 GemSprout Metals Limited
 Qader Group
 Ileys General Trading
 SG Gold Mining LLC
 VRV Global Pte Ltd
 Omsri International FZE
 G.I.T.T.
 Jaunita Erss Ltd
 Almosi SARL
 SRK Consulting
 Berks Gold Limited
 Mwerezi Minerals Company Limited
 Mining SARL
 SenGold Invest SAS
 Sean Mining Limited
 NTS Group (Pty) Ltd
 Mine4Africa
 Lithspo Minerals Limited











