

Phosphate rock · Producers, reserves and impacts
Phosphorus Mining by Country: Output and Reserves
China mined an estimated 110 million tonnes of phosphate rock in 2025, 44% of the world total; Morocco holds about 68% of reserves (USGS, 2026). Ranked tables, grades, costs, waste and a calculator follow.
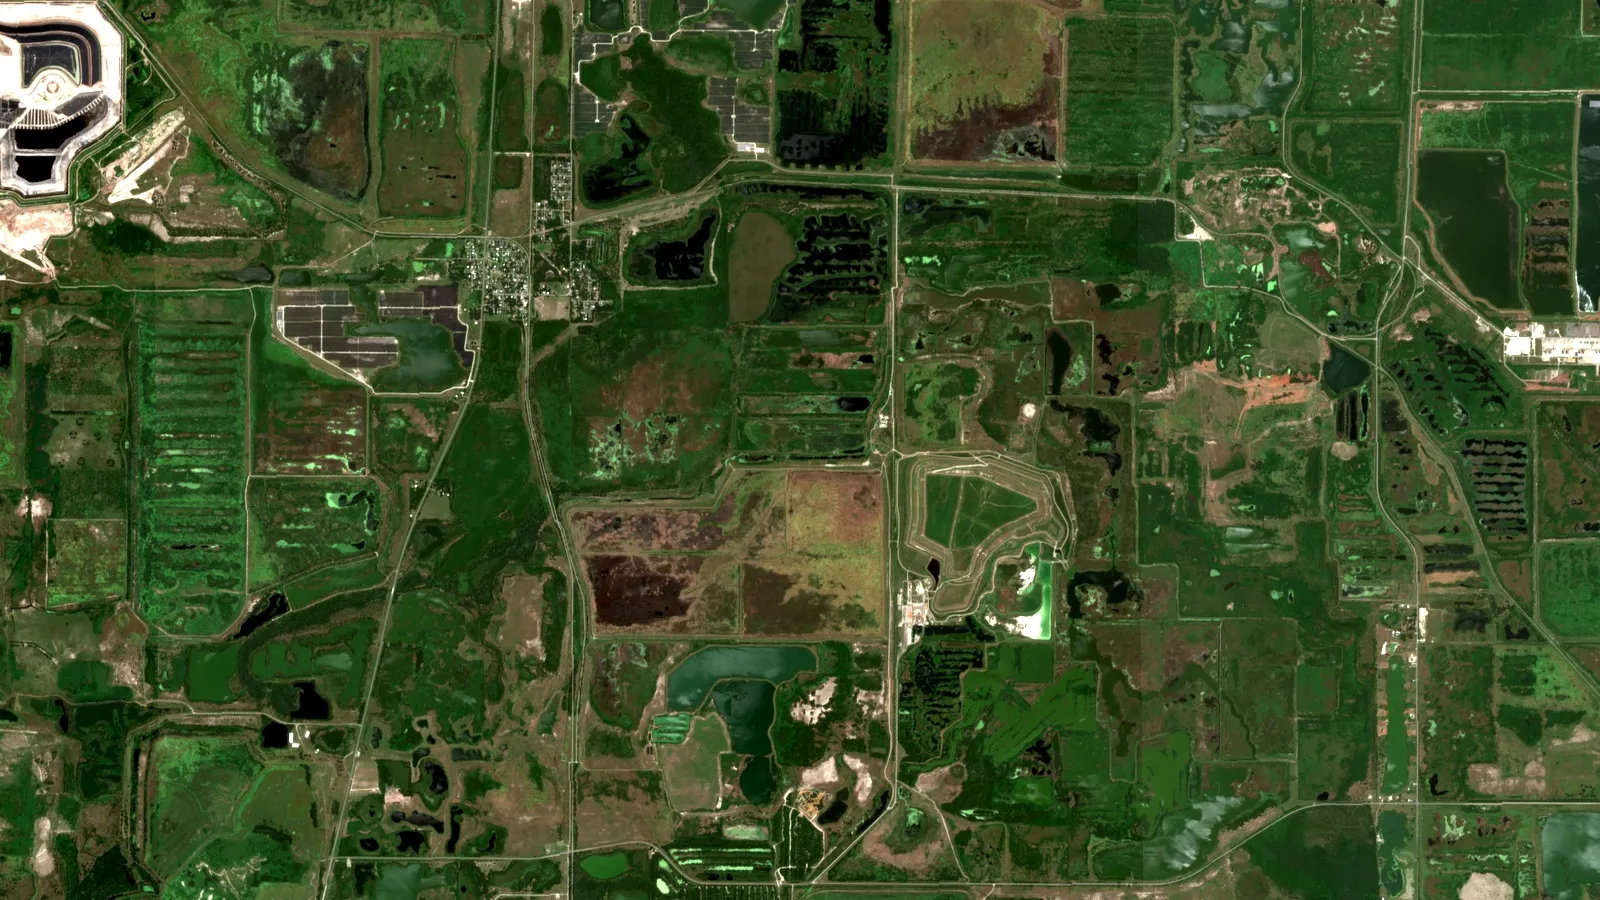
Key takeaways
- World phosphate rock output was an estimated 250 million tonnes in 2025; China, Morocco, the United States and Russia mined about 72% of it (USGS, 2026).
- Morocco holds 50 of the world’s 73 billion tonnes of reserves, about 68%; USGS says there are no imminent shortages and resources exceed 300 billion tonnes.
- Rock above 31% P2O5 is acid grade; lower-grade rock is upgraded by beneficiation (BC Geological Survey, 2012).
- Wet-process acid makes about 5.2 tons of phosphogypsum per ton of phosphoric acid (US EPA); Florida mining disturbs 3,000 to 6,000 acres a year (Florida DEP).
- Phosphate rock is a critical raw material in the EU and was added to the US critical minerals list in 2025.
In this article
- Which countries produce the most phosphate rock
- Phosphate rock reserves by country and years of supply
- How phosphate rock is mined, graded and turned into fertilizer
- What phosphate rock and phosphate fertilizer cost
- Environmental impacts of phosphorus mining and how they are managed
- Five ways to cut a phosphate mine's footprint: what the evidence shows
- Phosphorus recycling and policy: what is changing
- What mining consultants should check on a phosphate project
- Frequently asked questions
Phosphorus mining means digging phosphate rock out of the ground and turning it into fertilizer, animal feed and industrial chemicals. China mined an estimated 110 million tonnes of phosphate rock in 2025, followed by Morocco at 36 million, the United States at 20 million and Russia at 14 million (USGS Mineral Commodity Summaries, February 2026). Those four countries make up about 72% of world output of 250 million tonnes. This page ranks the producers, shows who holds the reserves, explains how the rock becomes fertilizer, and sets out the environmental costs and fixes that matter to licence holders, consultants and investors.
All production figures below are in tonnes of marketable phosphate rock, as reported by USGS. The 2025 values are USGS estimates. Terms are explained the first time they appear: phosphate rock is the mined ore, P2O5 is the standard way to state its phosphorus content, and reserves are the part of a deposit that can be mined at a profit with today’s prices and technology.
Which countries produce the most phosphate rock
Production is concentrated. China alone supplies about 44% of the world’s phosphate rock, and the top four producers supply about 72%. Jordan (12 million tonnes), Saudi Arabia (10 million), Egypt (5.5 million), Brazil (5 million) and Peru (4.8 million) follow. The table lists the ten largest producers in USGS data, with the change from 2024 to 2025.
Chart
Phosphate rock production by country
Million tonnes, 2025 estimate, eight largest producers
| Rank | Country | 2024 (Mt) | 2025 estimate (Mt) | Share of world 2025 |
|---|---|---|---|---|
| 1 | China | 105 | 110 | 44% |
| 2 | Morocco | 35.3 | 36 | 14% |
| 3 | United States | 19.4 | 20 | 8% |
| 4 | Russia | 14.4 | 14 | 6% |
| 5 | Jordan | 11.5 | 12 | 5% |
| 6 | Saudi Arabia | 10 | 10 | 4% |
| 7 | Egypt | 5.3 | 5.5 | 2% |
| 8 | Brazil | 5.3 | 5 | 2% |
| 9 | Peru | 4.8 | 4.8 | 2% |
| 10 | Tunisia | 3.28 | 3.3 | 1% |
Source: USGS Mineral Commodity Summaries, February 2026 (phosphate rock chapter). Mt means million tonnes. Shares are calculated from the USGS world total of 250 Mt. China’s figure covers large mines only, as reported by China’s National Bureau of Statistics.
USGS estimates world output rose about 5% in 2025 and expects capacity to grow. It reports world phosphate capacity of 63.7 million tonnes of P2O5 in 2025, rising to 71.7 million by 2029, with expansions under way in Brazil, Kazakhstan, Mexico, Morocco and Russia. New mines are planned after 2028 in Canada, Congo (Brazzaville), Guinea-Bissau and Senegal. Demand is rising more slowly: world fertilizer use of P2O5 was an estimated 47.8 million tonnes in 2025 and is projected to reach 51.5 million tonnes by 2029, with Asia and South America expected to grow fastest (same USGS chapter).
Chart
Output change, 2024 to 2025
Million tonnes of phosphate rock, six largest producers
Phosphate rock reserves by country and years of supply
Reserves are even more concentrated than production. USGS lists Morocco with 50 billion tonnes of the world’s 73 billion tonnes of reserves, about 68%. China has 3.4 billion tonnes (about 5%), Egypt 2.8 billion, Tunisia 2.5 billion, Russia 2.4 billion and Algeria 2.2 billion.
Dividing reserves by yearly output gives a rough “years of supply”. For the world, 73 billion tonnes at 250 million tonnes a year is about 290 years. The ratio differs sharply by country: roughly 1,390 years for Morocco, 50 for the United States and 31 for China. This is a crude measure, because reserves change as prices, costs and exploration change. USGS also reports that world phosphate rock resources, a wider category that includes material not yet economic, exceed 300 billion tonnes, and states that there are no imminent shortages of phosphate rock.
Definitions differ between countries, which can mislead comparisons. For Australia, USGS lists reserves of 800 million tonnes, and notes that the reserves compliant with the JORC Code (the Australasian reporting standard) or equivalent were 120 million tonnes. Always check which standard a quoted reserve figure follows.
Not every producer is equally secure. In the United States, production has stayed near 20 million tonnes a year while producers in Florida deal with falling reserves and lower P2O5 content, which has pushed imports up (USGS). In October 2025 the US Bureau of Land Management approved a new phosphate mine in Caribou County, Idaho, to replace an existing mine when it is depleted within the next decade.
Chart
Phosphate rock reserves by country
Billion tonnes of reserves, eight largest holders
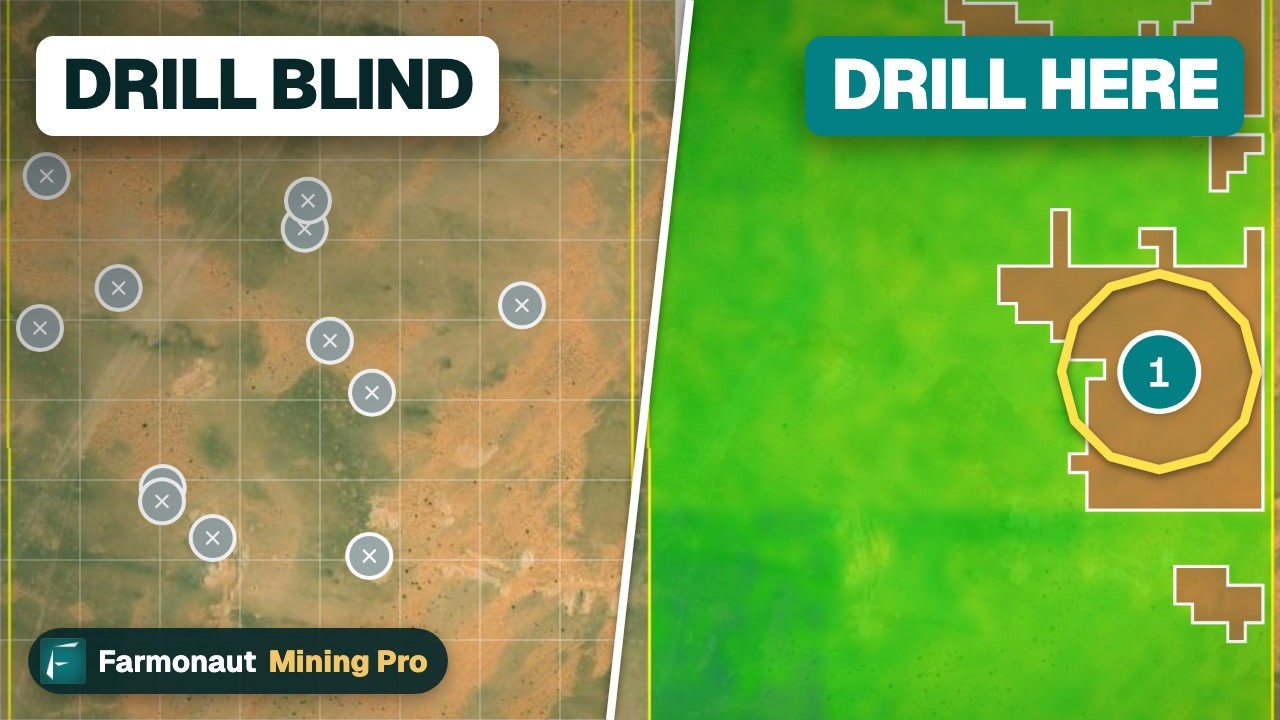
▶ Explains what mining contributes to economies, from exports and jobs to energy-transition minerals. · 5:03
How phosphate rock is mined, graded and turned into fertilizer
Most phosphate rock is sedimentary: it formed in warm marine basins and sits in flat, bedded layers called phosphorites. The British Columbia Geological Survey describes the main ore mineral as microcrystalline francolite and defines phosphorites as rocks with 18% P2O5 or more (Simandl and others, BC Geological Survey, 2012). USGS adds that the largest sedimentary deposits are in northern Africa, the Middle East, China and the United States, while significant igneous (volcanic-origin) deposits occur in Brazil, Canada, Finland, Russia and South Africa. Apatite from some carbonatites and iron-oxide copper-gold deposits can also be recovered as a by-product, as the same BC survey profile notes. Rare earth elements can occur with phosphate rock, which links this commodity to our guide on a rare earth elements map.
Infographic
From phosphate rock to fertilizer in 5 steps
- 1Mine the oreOpen-pit methods remove the phosphate-bearing layer.
- 2Upgrade the rockWashing, screening or flotation lift the P2O5 grade.
- 3Make phosphoric acidSulfuric acid dissolves the rock; phosphogypsum is left behind.
- 4Make fertilizerThe acid is reacted with ammonia to give DAP or MAP.
- 5Stack and reclaimWaste is stored in stacks and mined land is reclaimed.
Ore grade and beneficiation
Grade is the P2O5 content of the rock. The BC survey gives an example from Idaho: rock above 31% P2O5 (“acid grade”) goes straight into fertilizer plants, rock at 24 to 31% (“furnace grade”) feeds elemental phosphorus plants, and rock at 15 to 24% is mined but must be beneficiated, meaning upgraded by washing, screening or flotation, to reach those specifications. Near an existing flotation plant, as in Florida, rock as low as 3% P2O5 can be worth mining. As rich deposits are used up, lower grades become acceptable and upgrading becomes routine.
From rock to DAP and MAP
USGS reports that more than 95% of US phosphate rock goes into wet-process phosphoric acid, which is then turned into granular and liquid ammonium phosphate fertilizers. The remainder makes elemental phosphorus for industrial uses. The acid step needs sulfur: the Fertilizer Institute states that it takes about 4 tonnes of sulfur to make every 10 tonnes of finished MAP or DAP, and that most sulfur is a by-product of oil refining and gas processing (The Fertilizer Institute, August 2026). This is why phosphate fertilizer prices follow sulfur prices as well as rock prices.
Only a part of a phosphate project’s value sits in the ground. A mine without access to sulfuric acid, ammonia, rail or port capacity has to sell rock at a discount or ship it to a processor, which is why consultants look at the whole chain before the geology.
What phosphate rock and phosphate fertilizer cost
USGS puts the average US phosphate rock price at US$100 per tonne f.o.b. mine (the price at the mine, before freight) in 2025 (estimate), up from US$83 in 2021, with a peak of US$101 in 2023. Mosaic, a US producer, reported an average consumed cost of purchased and produced rock of US$85 per tonne in 2024, compared with US$75 a year earlier (Mosaic annual report, 2024). Its North American rock production was 9.0 million tonnes in 2024.
Fertilizer prices move more than rock prices. University of Illinois economists tracking weekly US retail prices found that DAP was up 14.5% on a year earlier in the week of 13 April 2026, and that by mid-February 2022 urea, DAP, MAP and potash retail prices were 72% to 142% above early 2021 (farmdoc daily, April 2026). The same article notes that roughly one-third of global seaborne fertilizer volumes pass through the Strait of Hormuz, and that the Gulf is a major sulfur producer. Check a live source such as the World Bank commodity price data for today’s DAP and rock prices before you use any figure in a model.
Mine-gate value and reserve-life calculator
The calculator below turns a mine’s reserves, output, grade and price into years of supply, the P2O5 produced each year, and the annual rock value at the mine gate. The defaults are the USGS figures for the United States (2025 estimate), but the price and grade are examples only: enter today’s price and your own grade.
Chart
US phosphate rock price at the mine
US$ per tonne, average value f.o.b. mine, marketable rock
Calculator
How long do reserves last and what is the rock worth?
Enter your own reserves, output, grade and price.
- P2O5 produced per year (Mt): 6.0
- Annual rock value (US$ million): 2,000
Example values only. Defaults for reserves and output are the USGS United States figures (Mineral Commodity Summaries, February 2026: 1,000 Mt reserves, 20 Mt output in 2025 estimate). Grade and price are examples: use today’s price. Result is gross rock value at the mine gate, not profit.
Environmental impacts of phosphorus mining and how they are managed
Three impacts dominate: land disturbance, waste from processing, and nutrient pollution downstream.
Land and water
The Florida Department of Environmental Protection reports 28 phosphate mines in the state covering more than 450,000 acres. Eleven are active and ten are fully reclaimed and released from reclamation obligations. Mining there disturbs 3,000 to 6,000 acres a year, and about 25 to 30% of that land is wetlands or other surface waters (Florida DEP, phosphate mining). Reclamation standards are set in state statute and administrative code, and permits are needed for work in wetlands.
Phosphogypsum
The wet process makes a solid waste called phosphogypsum, a form of calcium sulfate. The US EPA states that industry estimates about 5.2 tons of phosphogypsum for every ton of phosphoric acid, and that about 80% of the radium-226 in the rock ends up in it. It is piled in “stacks”: EPA counts more than 70 in the United States, between 2 and 324 hectares in area and 3 to 60 metres high, with Florida holding the most (US EPA, TENORM from fertilizer production). Full stacks are graded, covered and seeded. EPA notes that the main use today is in agriculture and that researchers proposing new uses must apply to the agency.
Runoff and eutrophication
Phosphorus that crops do not use can wash into rivers and lakes. EPA explains that excess nitrogen and phosphorus cause eutrophication (over-enrichment of water), which can lead to low-oxygen “dead zones” and fish kills, and that applying fertilizer in the right amount, at the right time and place can significantly reduce losses (US EPA, nutrient pollution: agriculture). Buffer strips, cover crops and conservation tillage are the practices EPA lists. For the farm side of the topic, see our guide on types of sustainable agriculture.

▶ A plain-language claymation on the seven environmental impacts of mining. · 2:31
Five ways to cut a phosphate mine’s footprint: what the evidence shows
The table below covers five approaches and states only what a named source shows.
| Approach | What the source shows | Source |
|---|---|---|
| Better extraction and beneficiation | Lower-grade rock (15 to 24% P2O5) is mined and upgraded; flotation makes rock as low as 3% P2O5 viable near existing plants | BC Geological Survey |
| Nutrient recycling | Recovery from wastewater is technically possible, but economics were reported as challenging at the fertilizer prices of that time; the revised EU wastewater directive now promotes recovery of resources | BC Geological Survey; European Commission |
| Waste reduction | Phosphogypsum is stacked, then graded, covered and seeded; the main reuse is in agriculture | US EPA |
| Process chemistry | Wet-process acid needs sulfur, about 4 tonnes per 10 tonnes of DAP or MAP, so sulfur supply sets a cost floor | The Fertilizer Institute |
| Reclamation and water care | 10 of Florida’s 28 phosphate mines are fully reclaimed and released; wetlands are 25 to 30% of newly disturbed land | Florida DEP |
Phosphorus recycling and policy: what is changing
Recycling is not yet a large source of phosphorus. USGS reports no recycling of phosphate rock in the United States and says there are no substitutes for phosphorus in agriculture. Policy is moving, though. The revised EU Urban Wastewater Treatment Directive entered into force on 1 January 2025. It requires stronger nutrient removal and aims to advance circularity through the recovery of valuable resources from wastewater (European Commission, urban wastewater).
Supply security is also driving policy. The EU’s Raw Materials Information System lists both phosphate rock and phosphorus among its critical raw materials (European Commission JRC, critical raw materials). In the United States, the final 2025 critical minerals list published on 7 November 2025 added phosphate rock after public comment (USGS). These listings do not change the geology or the cost of a project.
Farmonaut’s view from the mining side: new rock still has to be found and permitted. The satellite-based mineral detection service maps licence areas from space in 5 to 20 business days from a KML, KMZ or polygon boundary, with the result treated as an exploration target and not as a resource estimate. Phosphate is not among the minerals our detection service lists, so ask us first whether a phosphate licence can be screened.
What mining consultants should check on a phosphate project
- Grade and mineralogy. Ask for P2O5 by sample and the share above 18% (phosphorite) or 31% (acid grade), plus the beneficiation route tested.
- Reporting standard. A reserve under JORC, NI 43-101 or a government definition is not the same number, as Australia’s 800 million versus 120 million tonnes shows.
- Access to sulfur and acid. Fertilizer margins depend on sulfur, ammonia and logistics, not rock alone.
- Waste plan. Where will phosphogypsum or tailings go, and what cover and monitoring is planned?
- Land and water. Count wetlands, permits and reclamation bonds. In Florida, about 25 to 30% of land disturbed each year is wetland or other surface water.
- Demand and price basis. Check whether a price is rock at the mine, DAP at a port or DAP at retail, because the three differ several-fold per tonne.
If you hold a licence and want a satellite screening of the boundary, send the area for a quote, or contact our team. For bulk-mineral exploration methods in general, see how bulk deposits such as iron ore, bauxite and phosphate are found and tested.
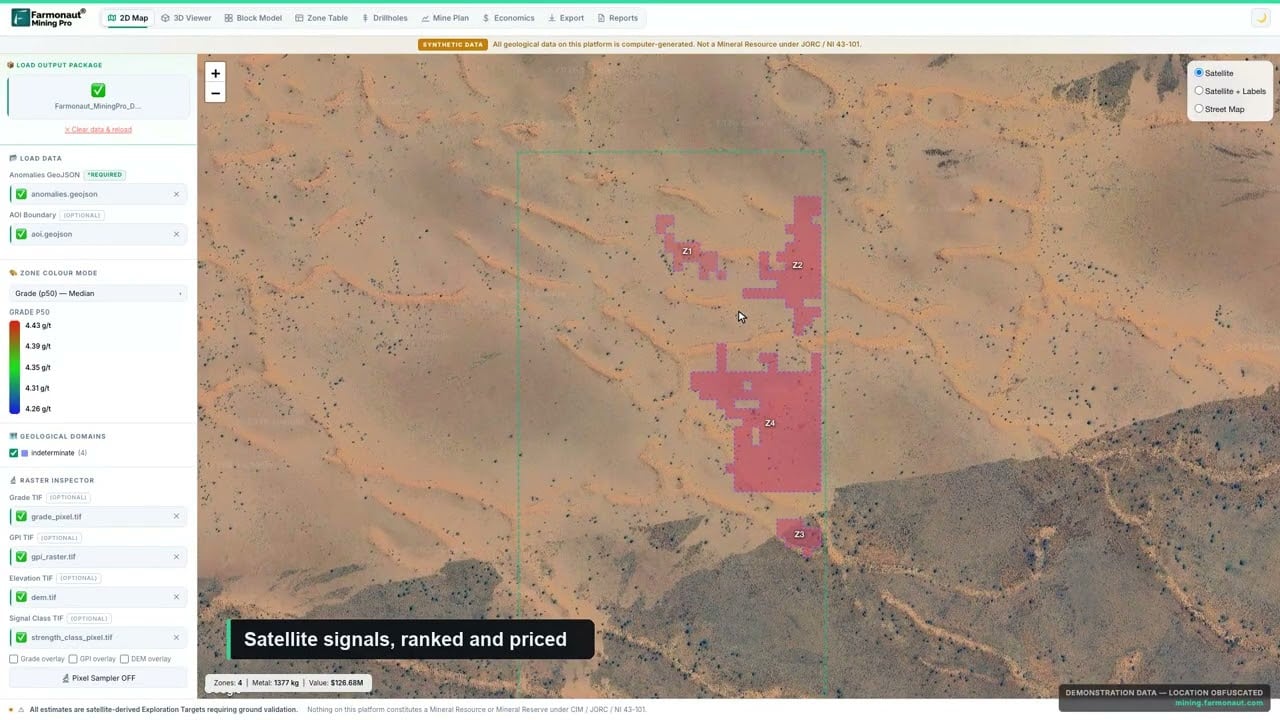
▶ A look at Farmonaut Mining Pro, which turns a licence boundary into a geological and economic picture. · 4:56
Frequently asked questions
What is phosphorus mining?
It is the extraction of phosphate rock, usually by open-pit methods, followed by washing and upgrading. Most of the rock becomes phosphoric acid and then fertilizer; the rest goes to animal feed and industrial chemicals.
Which country mines the most phosphate rock?
China, with an estimated 110 million tonnes in 2025, about 44% of the world’s 250 million tonnes (USGS, February 2026). Morocco is second at 36 million tonnes.
Which country has the largest phosphate reserves?
Morocco, with 50 billion of the world’s 73 billion tonnes of reserves, about 68% (USGS, February 2026).
Will the world run out of phosphate rock?
USGS states there are no imminent shortages and that world resources exceed 300 billion tonnes. Reserves equal about 290 years at current output, but quality is falling in some regions and supply is concentrated in a few countries.
Is phosphate rock a critical mineral?
Yes in both the EU, which lists phosphate rock and phosphorus as critical raw materials, and the United States, where phosphate rock was added to the final 2025 critical minerals list.
What grade of phosphate ore is mined?
Phosphorites contain 18% P2O5 or more. Idaho acid-grade rock is above 31%, furnace grade is 24 to 31%, and lower grades of 15 to 24% are mined and upgraded (BC Geological Survey, 2012).
How is phosphate rock turned into fertilizer?
Sulfuric acid dissolves the rock to make phosphoric acid, which is reacted with ammonia to make DAP or MAP. About 4 tonnes of sulfur are needed per 10 tonnes of DAP or MAP (The Fertilizer Institute).
What is phosphogypsum?
It is the solid waste of wet-process phosphoric acid production. EPA says about 5.2 tons are made per ton of acid, and it contains radium-226 from the ore, so it is stored in managed stacks.
How much land does phosphate mining disturb?
In Florida, 3,000 to 6,000 acres a year, according to the state environmental agency, with 25 to 30% of it wetlands or other surface waters. Ten of the state’s 28 mines are fully reclaimed.
Can phosphorus be recycled?
It can be recovered from wastewater, manure and some residues, but USGS reports no recycling of phosphate rock in the United States and no substitute for phosphorus in farming. EU wastewater rules now encourage recovery.
How much does phosphate rock cost?
USGS puts the average US price at US$100 per tonne f.o.b. mine (the price at the mine, before freight) in 2025 (estimate). Fertilizer products such as DAP cost several times more per tonne.
Why do phosphate fertilizer prices depend on sulfur?
Sulfuric acid, made from sulfur, is needed to convert rock to fertilizer. When sulfur supply tightens, production costs rise (The Fertilizer Institute, August 2026).
This page is for information only. It is not investment advice or legal advice. Confirm licence, permit and reclamation rules with the regulator.
Farmonaut mining
Map your mining site from space
Send a KML, KMZ or polygon boundary and we will quote a satellite screening of your licence area.

Mining Pro sample view, synthetic data
Keep reading
Sources
- USGS, Mineral Commodity Summaries 2026: Phosphate Rock (Feb 2026): pubs.usgs.gov
- BC Geological Survey, Sedimentary phosphate deposits profile (Simandl and others, 2012): cmscontent.nrs.gov.bc.ca
- The Fertilizer Institute, Phosphate Fertilizer: More Complex Than You Think (Aug 2026): tfi.org
- Mosaic Company, 2024 Annual Report: s1.q4cdn.com
- farmdoc daily, University of Illinois (Apr 2026): farmdocdaily.illinois.edu
- Florida Department of Environmental Protection, Phosphate mining: floridadep.gov
- US EPA, TENORM: Fertilizer and fertilizer production wastes: epa.gov
- US EPA, Nutrient pollution: Sources and solutions, agriculture: epa.gov
- European Commission, Urban wastewater: environment.ec.europa.eu
- European Commission JRC, EU critical raw materials (RMIS): rmis.jrc.ec.europa.eu
Discussion
Questions, corrections or field experience? Share them below. First-time comments are reviewed before they appear, and your email is never published.
No comments yet. Be the first to add a question or your experience.

 Mwerezi Minerals Company Limited
 Congo Mining Solutions
 Mining SARL
 SenGold Invest SAS
 Sania Corporation
 Sean Mining Limited
 NTS Group (Pty) Ltd
 Mine4Africa
 Lithspo Minerals Limited
 Tintina Mining Group
 Dalgety Minerals Pty Ltd
 Vortex Minerals Pty Ltd
 Faith At Work (Pty) Ltd
 Geotech Mining Solutions plc
 Vulcan International Limited
 Kidepo Associates
 GKY Mining
 Alkimy SARL
 Double A Trading

 Licence holder · Nigeria · Gold + lithium










