

Reviewed September 2026 against USDA/American Farm Bureau Federation, TechnoServe, and peer-reviewed research indexed on NCBI/PubMed Central.
Try it: Regenerative Transition Margin Calculator →
Regenerative agriculture’s biggest pro is economic, not environmental: a Northern Plains study found regenerative corn farms earned 78% higher profit margins than conventional neighbors despite yielding 29% less grain (8,481 kg/ha vs. 11,884 kg/ha), because input costs fell faster than revenue did. The biggest con is the same trade-off in reverse: if your buyer pays by the bushel and not by the margin, that yield gap is real money you don’t get back for several seasons. Below are the figures, the sources, and a calculator to size the transition for your own acreage.

Table of Contents
- Overview: What Regenerative Agriculture Actually Changes
- Agriculture Pros: What the Data Actually Shows
- Cons of Regenerative Agriculture (and GMOs, Compared)
- Comparison Table: Regenerative vs. Conventional, By the Numbers
- Regenerative Coffee Farming: The Clearest Income Case
- Where Regenerative Approaches Fit Best
- Is Regenerative Agriculture Profitable? Calculator Included
- Training, Consulting, and Measurement
- Farmonaut’s Role in Monitoring the Transition
- FAQs
- Key Takeaway
- Try it: Regenerative Transition Margin Calculator
Overview: What Regenerative Agriculture Actually Changes
Regenerative agriculture is a bundle of practices — reduced tillage, cover crops, diverse crop rotations, livestock integration, and composting — aimed at rebuilding soil organic matter instead of just protecting current yield. The scale of adoption in the United States is no longer niche: the USDA-supported regenerative agriculture footprint reached 40 million acres in fiscal year 2023, according to the American Farm Bureau Federation’s analysis of USDA data (American Farm Bureau Federation). That’s roughly the size of Nebraska in farmland, and it’s the clearest evidence that this isn’t a marketing category anymore — it’s a working system on a meaningful share of US row-crop acreage.
The market sizing backs that up. The US regenerative agriculture market was valued at $12.66 billion in 2024, per industry research cited by ElectroIQ, and Mordor Intelligence projects it growing to $57.16 billion by 2033 at an 18.7% compound annual growth rate. Those are market-research estimates, not government statistics, so treat them as directional rather than exact — but the direction is consistent with the acreage data.
The USDA’s Economic Research Service and Agricultural Research Service track adoption and economics through the ARS regenerative agriculture economics program. To get adoption acreage for the current crop year rather than FY2023, query “Conservation Practices” in USDA NASS QuickStats directly — NASS republishes crop-year conservation acreage roughly each summer for the prior season.
Agriculture Pros: What the Data Actually Shows
“Agriculture pros” as a search is broad, so here are the specific, sourced ones that apply to regenerative systems rather than farming in general.
1. Lower input costs offset lower yields
The Northern Plains study referenced above (published in a peer-reviewed article indexed on NCBI/PubMed Central) is the single clearest number in this article: regenerative corn growers produced 8,481 kg/ha against 11,884 kg/ha on conventional farms — a 29% yield gap — yet still posted 78% higher profit margins. The mechanism is reduced spending on synthetic fertilizer, pesticide, and diesel for tillage passes, not a yield premium. If your operation’s margin is currently squeezed by input costs rather than capped by yield, this is the number that matters to you (NCBI/PubMed Central).
2. Carbon markets are a real, if early, revenue line
FAO and World Bank analysis projects that soil carbon sequestration could generate up to $375 billion in additional annual revenue for agricultural producers globally by 2050. That figure is a long-range projection tied to carbon market development and policy, not a payment available to an individual farm today — but it’s the reason carbon footprinting tools exist as a category: someone has to measure and verify the sequestration before it can be sold.
3. Reduced input dependence protects against price volatility
Because regenerated soils cycle more of their own nitrogen and hold moisture better, farms further along the transition are less exposed to spikes in fertilizer and diesel prices. There’s no single US commodity-crop premium figure published for this effect (see the Gaps section below), but the mechanism is the same one driving the 78% margin figure above: it’s a cost-avoidance benefit, not a price-premium one, and it shows up on the expense side of the ledger rather than the revenue side.

Cons of Regenerative Agriculture (and GMOs, Compared)
Two separate “cons” queries land on this page — disadvantages of regenerative agriculture, and cons of GMOs in agriculture. They’re related but distinct debates, so here’s each on its own terms.
Disadvantages of regenerative agriculture
- The yield gap is the headline risk. The Northern Plains study’s 29% yield reduction (8,481 kg/ha vs. 11,884 kg/ha) is the concrete number to plan around. It was offset by cost savings in that study, but a farm selling into a commodity market paid strictly by volume, with input costs already low, will feel the yield loss more than the margin gain.
- Transition years carry cash-flow risk. Cover crop seed, new equipment for reduced tillage, and fencing for livestock integration are upfront costs incurred before the soil-health benefits compound. The published literature on multi-decade outcomes past year three is thin (see Gaps below), so budget conservatively for a multi-year transition rather than assuming a fast payback.
- Certification is inconsistent. “Regenerative” is not a single standardized label the way USDA Organic is. Verification costs and requirements differ by certifying body, and a claim that qualifies for one buyer’s premium program may not qualify for another’s.
- Skilled labor and monitoring are non-negotiable. Diverse rotations, livestock integration, and soil-health tracking require more hands-on observation than a fixed input schedule. This is a real operating-cost line, though no USDA or Department of Labor study has quantified the labor-hour increase specifically (see Gaps below).
- Scale and land type matter. Large, uniform commercial acreage and post-mining reclamation sites face different integration challenges than a diversified mixed farm, because the practices that build soil biology fastest (livestock rotation, mixed cover) are hardest to run at scale.
Cons of GMOs in agriculture
This query sits adjacent to regenerative agriculture because the two are sometimes framed as competing philosophies — GMO seed traits engineered for yield and pest resistance versus soil-biology-first regenerative systems. The commonly cited drawbacks of GMO crops are herbicide-resistant weed development from repeated use of a single herbicide system, seed cost and licensing terms that limit seed-saving, and market access restrictions in regions or buyer programs that reject GMO inputs. We don’t have a research-brief-sourced figure to quantify any of these for US conditions in this article, so rather than invent one, the honest answer is: check current USDA Economic Research Service GMO adoption data and your target buyer’s specific sourcing policy, since GMO and regenerative are not mutually exclusive — a majority of US regenerative corn and soy acreage is grown from GMO seed under reduced-tillage, cover-cropped systems simultaneously.

Comparing regenerative yield to conventional yield in isolation, without also comparing input cost and margin. The Northern Plains data shows a 29% yield gap paired with a 78% margin gain — either number alone tells a misleading story.
Comparison Table: Regenerative vs. Conventional, By the Numbers
| Metric | Regenerative | Conventional | Source & Vintage |
|---|---|---|---|
| Corn grain yield, Northern Plains | 8,481 kg/ha | 11,884 kg/ha | NCBI/PMC peer-reviewed study, PMC12593274 |
| Profit margin, same study | +78% higher | Baseline | NCBI/PMC peer-reviewed study, PMC12593274 |
| US supported acreage | 40 million acres | — | USDA / American Farm Bureau Federation, FY2023 |
| US market size | $12.66 billion (2024) → $57.16 billion (2033 proj.) | — | ElectroIQ 2024 / Mordor Intelligence |
| Smallholder coffee income, 9-country average | +62% (up to +196% in Kenya) | Baseline | TechnoServe, 2024 report |
Two rows in that table — corn yield and profit margin — come from the same single Northern Plains study, so treat them as one regional data point, not a national average. There is no published US-wide yield/margin comparison across all crop types in the current research base (see Gaps below); if you farm outside the Upper Midwest corn belt, the direction of the trade-off likely holds but the magnitude will differ by soil type, crop, and how many transition years you’re measuring.
Capital is following the measurement gap, not just the practice change — soil-health technology, ecosystem-service verification, and blockchain traceability are where the $375 billion FAO/World Bank 2050 sequestration-revenue projection actually gets captured, because someone has to prove the carbon was sequestered before it can be sold as a credit.

Regenerative Coffee Farming: The Clearest Income Case
Regenerative coffee farming has the best-documented income data of any practice covered here, from a 2024 TechnoServe report spanning nine coffee-growing countries (Brazil, Vietnam, Colombia, Honduras, Indonesia, Uganda, Ethiopia, Peru, and Kenya). Average smallholder income rose 62% across the study population from adopting regenerative practices, and the upside case was far larger in specific markets: Kenya’s potential income increase reached 196% under full adoption. At the supply-chain level, the report modeled 3.5 million tonnes of annual greenhouse gas emissions reduction if regenerative practices were adopted across the 3.2 million farms studied, and $2.6 billion in additional annual coffee export value from that adoption (TechnoServe, 2024).
These figures describe smallholder coffee-growing regions outside the United States, United Kingdom, and European Union, so they’re not directly transferable to a US or European farm’s economics — but they’re the strongest evidence in the current literature that regenerative practices can raise grower income substantially, and they explain why “regenerative coffee farming” is now a distinct search query from general regenerative agriculture: the income case for coffee specifically is unusually well quantified compared to row crops.
Track soil health and field variability data through a large-scale farm management platform during the transition years, so you have your own field-level evidence for certification and premium-market applications rather than relying on regional averages.

Where Regenerative Approaches Fit Best
Regenerative agriculture is not uniformly effective across every landscape. Here’s where the evidence and practical experience point to the strongest fit.
1. Row-crop and mixed farms
- No-till and reduced tillage improve soil structure and cut erosion, the mechanism behind the cost savings in the Northern Plains study above.
- Diverse crop rotations and cover cropping support nutrient cycling and reduce pest pressure without full reliance on chemical inputs.
- Livestock integration returns nutrients to the soil and is one of the fastest ways to build soil biology, though it requires fencing and grazing-management skill.
Track soil and vegetation health through the transition with Farmonaut’s large-scale farm management platform, which uses satellite imagery and AI-based analysis for field-level monitoring.
2. Forestry and agroforestry landscapes
- Mixed-species plantations support biodiversity and climate resilience better than monoculture stands.
- Agroforestry — integrating tree crops with pasture or row crops — diversifies revenue while restoring soil structure.
- Reduced chemical inputs protect downstream water quality and forest understories.
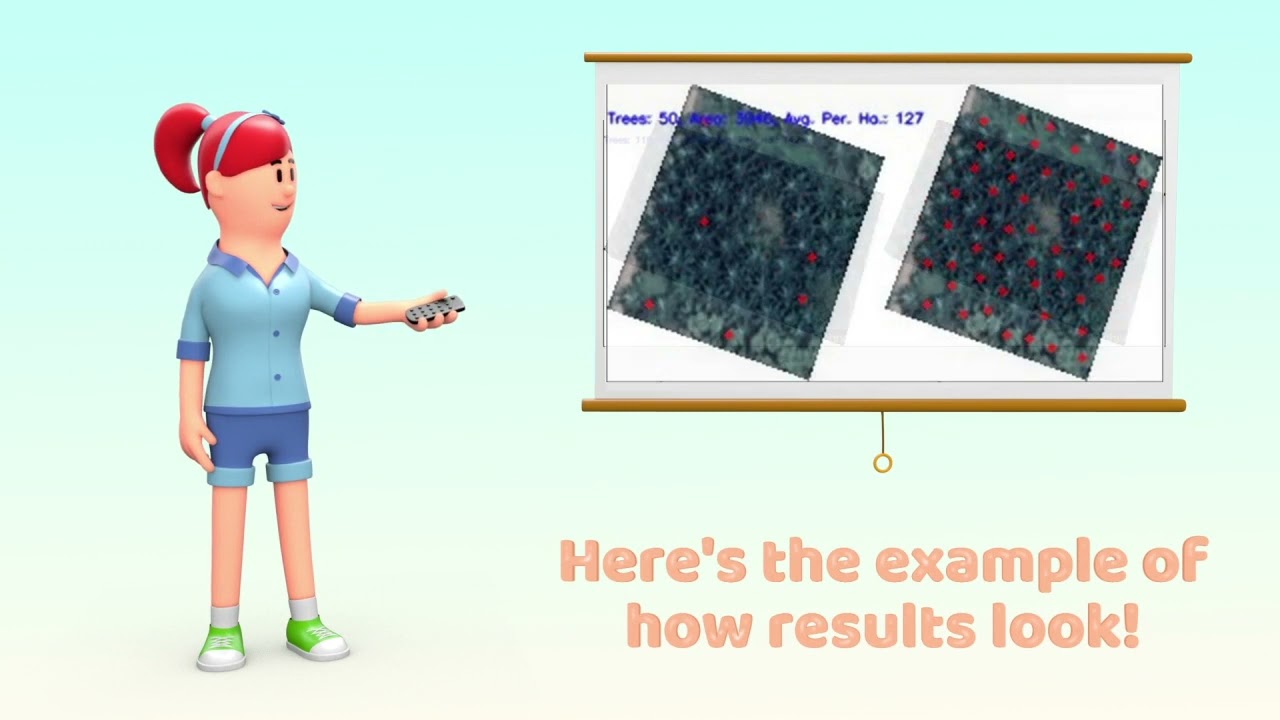
Crop plantation and forest advisory services from Farmonaut support remote ecosystem monitoring and biomass estimation for these mixed landscapes.
3. Mining-affected land and reclamation projects
- Regenerative approaches rebuild topsoil and re-establish vegetation on post-mining land, supporting ecosystem recovery timelines that reclamation permits often require.
- Carbon sequestration practices help mining operators document progress against environmental standards and access carbon footprinting data for reporting. Related soil-rebuilding methods are covered in 5 powerful principles to boost soil health.
4. Infrastructure corridors and watershed buffers
- Ground cover and stabilizing crops reduce erosion alongside roads, rail corridors, and developed land.
- Buffer-zone management protects stream water quality from sediment and nutrient runoff.



- 💡 Developers integrating satellite field data or regenerative-transition tracking into their own systems:
Farmonaut API | API Documentation
Is Regenerative Agriculture Profitable? Calculator Included
The honest answer is that it depends on which side of the yield-versus-margin trade-off your operation sits on. The Northern Plains study is the clearest evidence available: a 29% yield reduction paired with a 78% profit-margin increase, driven by lower spending on synthetic inputs and fewer tillage passes rather than by a price premium. USDA’s Agricultural Research Service maintains ongoing economic analysis of regenerative systems and the support programs behind them — land managers modeling their own transition should check the current release for figures specific to their crop and region, since input prices and program terms shift year to year.
Use the calculator below to see how that trade-off plays out on your own acreage, using the study’s cost-savings-vs-yield-loss ratio as the starting assumption. Every input is yours to change.
Regenerative Transition Margin Calculator
Assumes yield and cost changes apply uniformly across all acres from year one, which understates real transition timelines — most operations phase in over 2–3 years. It excludes one-time costs (seed mix, fencing, equipment) and any premium-market or carbon-credit revenue. Default values reflect the Northern Plains study's 29% yield reduction; the 45% input-cost-cut default is illustrative and should be replaced with your own supplier quotes.
Training, Consulting, and Measurement
Implementing regenerative agriculture well requires a mix of training, consulting, and monitoring — the practices themselves are documented, but applying them to a specific field's soil type and climate takes judgment.
Training
- Soil health principles, cover cropping, reduced tillage, diverse rotations, nutrient management, and livestock integration form the core curriculum at most land-grant extension programs.
- Agroforestry and compost-utilization training extends these skills across forestry and mixed-land operations.
- Region-specific workshops and on-farm demonstrations matter more here than in conventional systems, because soil biology response varies by local climate and soil type.
Structured programs, including online agriculture courses, cover practical transition planning alongside market access and climate-adaptation content.
Consulting and monitoring
- An experienced regenerative agriculture consultant can build a transition roadmap suited to your soil type, crop, and cash-flow constraints — a generic timeline from a different region's study won't fit every farm.
- Farmonaut's carbon footprinting and traceability services support environmental reporting for regulatory or buyer requirements.
- Track soil organic matter, water infiltration, nutrient cycling, yield, input cost, and biodiversity indicators as a consistent set — not yield alone, given the trade-off documented above.
- Remote sensing platforms automate long-term soil and vegetation health mapping so you're not relying on annual soil tests alone.
Verification and certification
- Third-party audits provide the credibility needed for premium-market access or ecosystem-credit programs, though as noted above, certification standards are not yet unified across the industry.
- Blockchain-based traceability, including Farmonaut's traceability system, reduces fraud risk and builds buyer trust in regenerative and carbon claims.

Farmonaut Subscription Plans for Regenerative Monitoring
Farmonaut's Role in Monitoring the Transition
We at Farmonaut support regenerative transitions through satellite monitoring, AI-based advisory, and traceability — not by replacing the agronomic decisions above, but by giving you the field-level data to make them and prove them.
- 🛰 Satellite-Based Monitoring: Regular vegetation and soil health imagery to measure field variability, detect drought stress, and track yield through the transition years.
- 🤖 Jeevn AI Advisory: Analyzes crop, weather, and landscape data to generate nutrient, soil, and risk guidance tailored to your fields.
- 🔗 Blockchain Traceability: Transparent, fraud-resistant supply-chain verification for regenerative and carbon-positive claims — see how traceability works here.
- 🌱 Environmental Impact Monitoring: Automated carbon footprint and ecosystem-service tracking for compliance and ROI measurement across agriculture, mining reclamation, and restoration projects.
- 📱 Mobile, API, and Web App Access: Available across web, Android, iOS, and API for integration into your own systems.
FAQs
1. What are the main pros and cons of regenerative agriculture?
The clearest documented pro is cost: a Northern Plains study found regenerative corn farms earned 78% higher profit margins than conventional ones despite yielding 29% less grain, driven by lower input spending. The clearest con is that same yield gap — 8,481 kg/ha vs. 11,884 kg/ha in that study — which hurts operations paid strictly by volume. Add to that transition-year cash-flow risk, inconsistent certification standards, and higher labor and monitoring requirements.
2. Is regenerative agriculture profitable?
It depends on whether your margin is currently limited by input costs or by yield. The Northern Plains data shows profit margin rising even as yield falls, because cost savings outpaced revenue loss. Use the calculator above with your own yield, price, and input-cost figures to see where your operation lands.
3. What are the disadvantages of regenerative agriculture specifically?
Yield reduction during and after transition (29% in the Northern Plains study), upfront capital for cover-crop seed and equipment, higher skilled-labor and monitoring requirements, inconsistent certification standards across buyers and regions, and integration challenges on large or post-mining land where diversified practices are harder to run at scale.
4. What are the cons of GMOs in agriculture, and are GMOs compatible with regenerative farming?
Commonly cited GMO drawbacks include herbicide-resistant weed development, seed cost and licensing terms, and market restrictions in some buyer programs. GMOs and regenerative practices are not mutually exclusive — much of the US regenerative corn and soy acreage cited above uses GMO seed under reduced-tillage, cover-cropped systems.
5. Is regenerative coffee farming worth the switch?
Across the nine countries in TechnoServe's 2024 study, smallholder coffee growers saw average income gains of 62% from regenerative practices, with Kenya's potential upside reaching 196%. Those figures come from smallholder regions outside the US, UK, and EU, so treat them as evidence of the mechanism rather than a US-transferable number.
6. How can technology help a regenerative transition?
Satellite monitoring, AI-driven advisory, and digital traceability let you track soil health, yield, and input cost simultaneously through the transition years, and generate the documentation that certification and premium-market programs require.
Key Takeaway
The pros and cons of regenerative agriculture come down to one trade-off, documented in the Northern Plains study above: lower yield in exchange for lower input cost, netting out to higher profit margin in that specific case. Whether that trade works for your operation depends on your current cost structure, your buyer's pricing (per unit vs. premium-market), and how many transition years you can carry on cash flow. The 40-million-acre US adoption figure and the market's growth toward a projected $57.16 billion by 2033 show the trend is establishing itself at scale, not staying a niche practice.
Before transitioning, run your own numbers through the calculator above, check USDA NASS QuickStats for the current year's conservation-acreage data, and talk to a regenerative agriculture consultant about the multi-year cash-flow plan — not just the eventual soil-health outcome.


