

In Probolinggo Regency, in the shadow of East Java’s volcanoes, a mango orchard manager put three blocks under satellite watch in February 2026. Eight months, 52 optical looks per block and a renewal every month later, the orchard is still being read from space. The account came in through the Farmonaut affiliate programme.
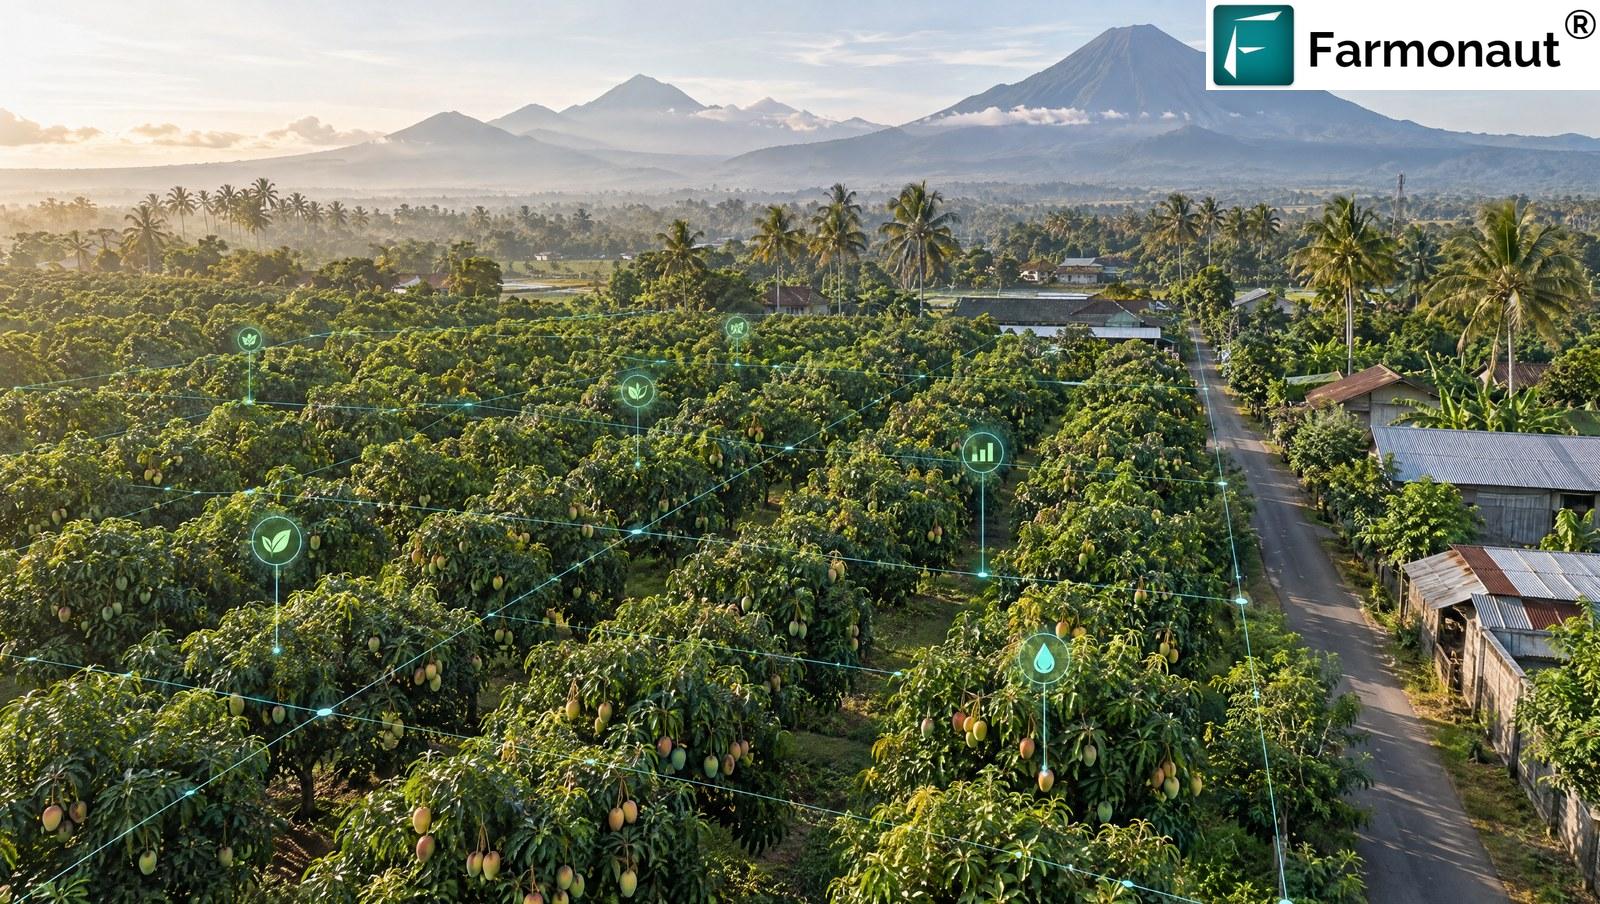
Mango farming in the tropics is hard to read from the ground. The trees are tall, the canopy is dense and the rows go on for hundreds of metres. A problem in one corner can stay hidden for weeks. That is exactly why a mango orchard in East Java chose to watch its trees from orbit, and why the subscription has renewed every month since.
The manager of this 45-hectare orchard subscribed to the Farmonaut Satellite + AI Farm Monitoring System using an affiliate partner’s promo code. Their first three mango blocks were drawn onto the map in early February 2026, and the system has been looking at them ever since. This article follows what it has been recording, and what the benefits other Farmonaut growers report mean for a mango orchard on Java.
“Fifty-two satellite looks at each mango block in eight months.”
A subscription that renews every month for nine months is the clearest verdict a grower can give. In a tropical orchard, where cloud limits what optical satellites can see, the radar record is what keeps the picture continuous.
Satellite monitoring is one layer of precision agriculture, and it works alongside farm management software. For more on the crop itself, see our guide to mango farming in Australia.

Mango farming in Probolinggo: why satellites suit the orchard
Probolinggo is known across Indonesia as a mango region. The orchards sit on the volcanic lowlands of East Java, between the Java Sea coast and the highlands around the Bromo-Tengger area, where warm days, a pronounced dry season and fertile volcanic soils suit the crop. The area is large, the orchards are numerous, and many are managed as big, contiguous blocks rather than small plots.
That scale is where satellites shine. A block of 31 hectares, like the largest in this account, would take a worker the better part of a day to walk. A satellite sees every tree in the block in a single pass, and does it again every few days. The manager does not need to guess which part of the orchard to visit first. The map says.
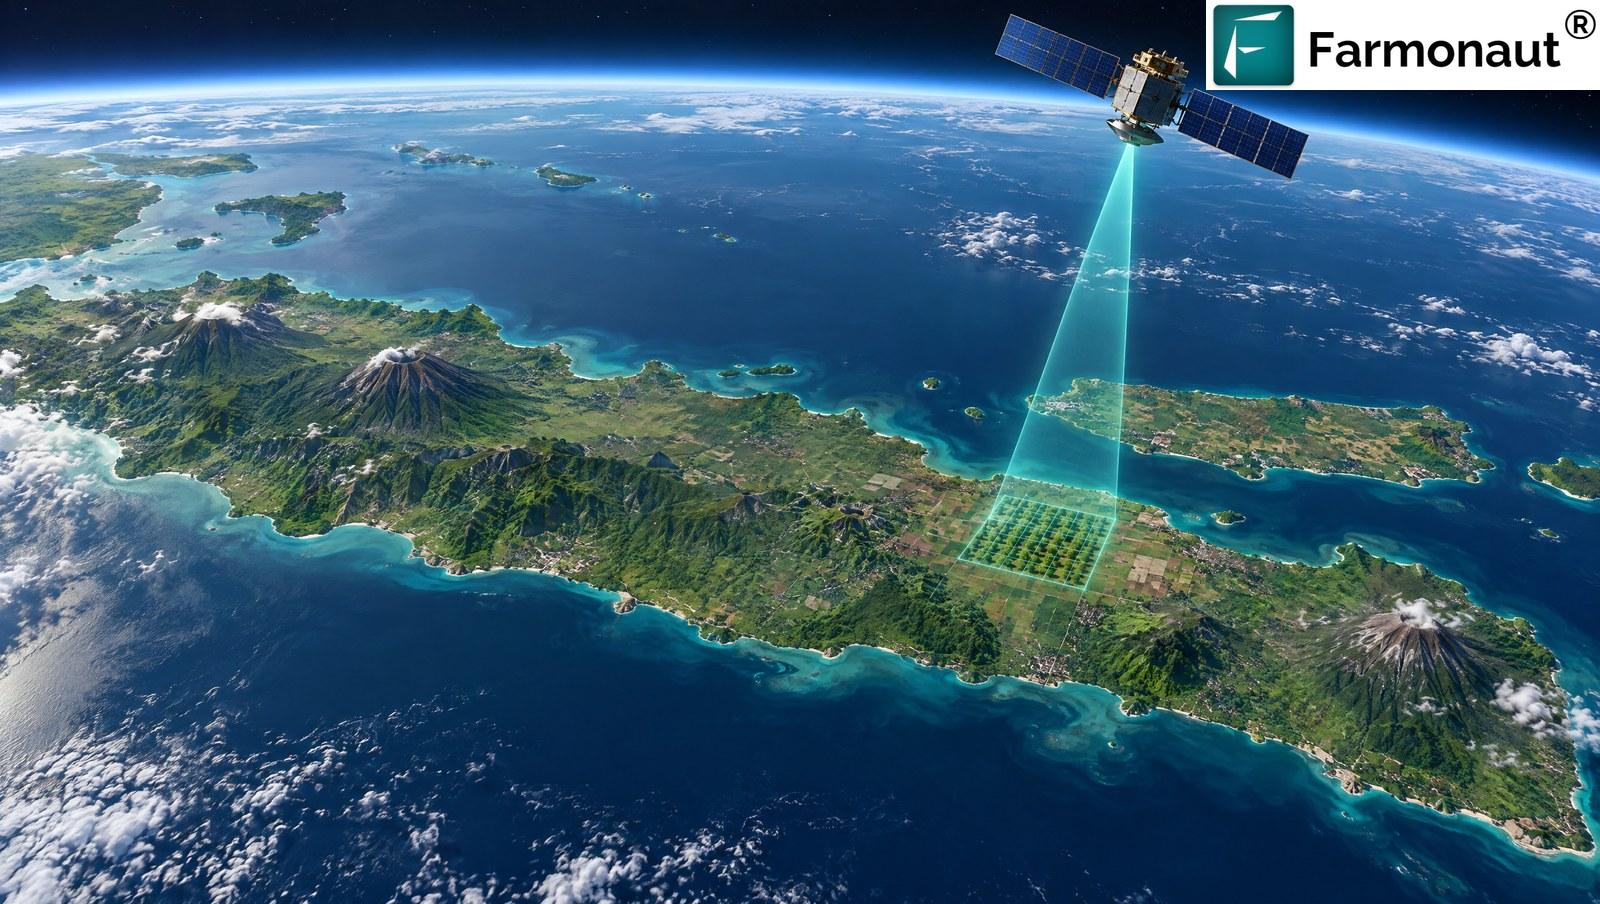
Mango farming at a glance: three blocks, 45 hectares
The account holds three adjacent mango blocks in Gading district, Probolinggo Regency. Together they cover 45 hectares, about 111 acres. One block is large and two are smaller, and each has its own boundary, its own record and its own map.
| Block | Crop | Area (ha) | Area (acres) | Optical looks | Radar passes |
|---|---|---|---|---|---|
| Block A (large) | Mango | 31.2 | 77.1 | 52 | 31 |
| Block B | Mango | 6.8 | 16.9 | 52 | 31 |
| Block C | Mango | 6.9 | 17.1 | 52 | 31 |
| Total | 45.0 | 111.1 |
Monitoring began on 3 February 2026 and the most recent satellite pass on the account was on 11 October 2026. Across that span, each block has been looked at 52 times by optical satellite and 31 times by radar, with 57 daily weather records. The three blocks share a schedule, so the record is consistent across the whole orchard.
Break a large orchard into blocks that match the way you work it. Here the manager kept three blocks, so each can be compared with the others. When one block lags, the map shows it straight away.
Why radar matters in the tropics
Cloud is the enemy of optical satellites, and Indonesia is cloudy. During the wet season it can be weeks between clear optical views. Radar solves this. A radar satellite sends its own signal and listens for the echo, so cloud, rain and darkness make no difference. The Farmonaut system uses both, which is why this orchard has an unbroken record from February to October.
Optical looks are the more intuitive of the two. They give vegetation and moisture indices that a grower can read at a glance. Radar adds structure: it responds to the canopy and to the moisture in the ground, and it fills the gaps between clear days. Together they give a grower something that is rare in the tropics, a map that is always current.
What the satellite reads in mango farming
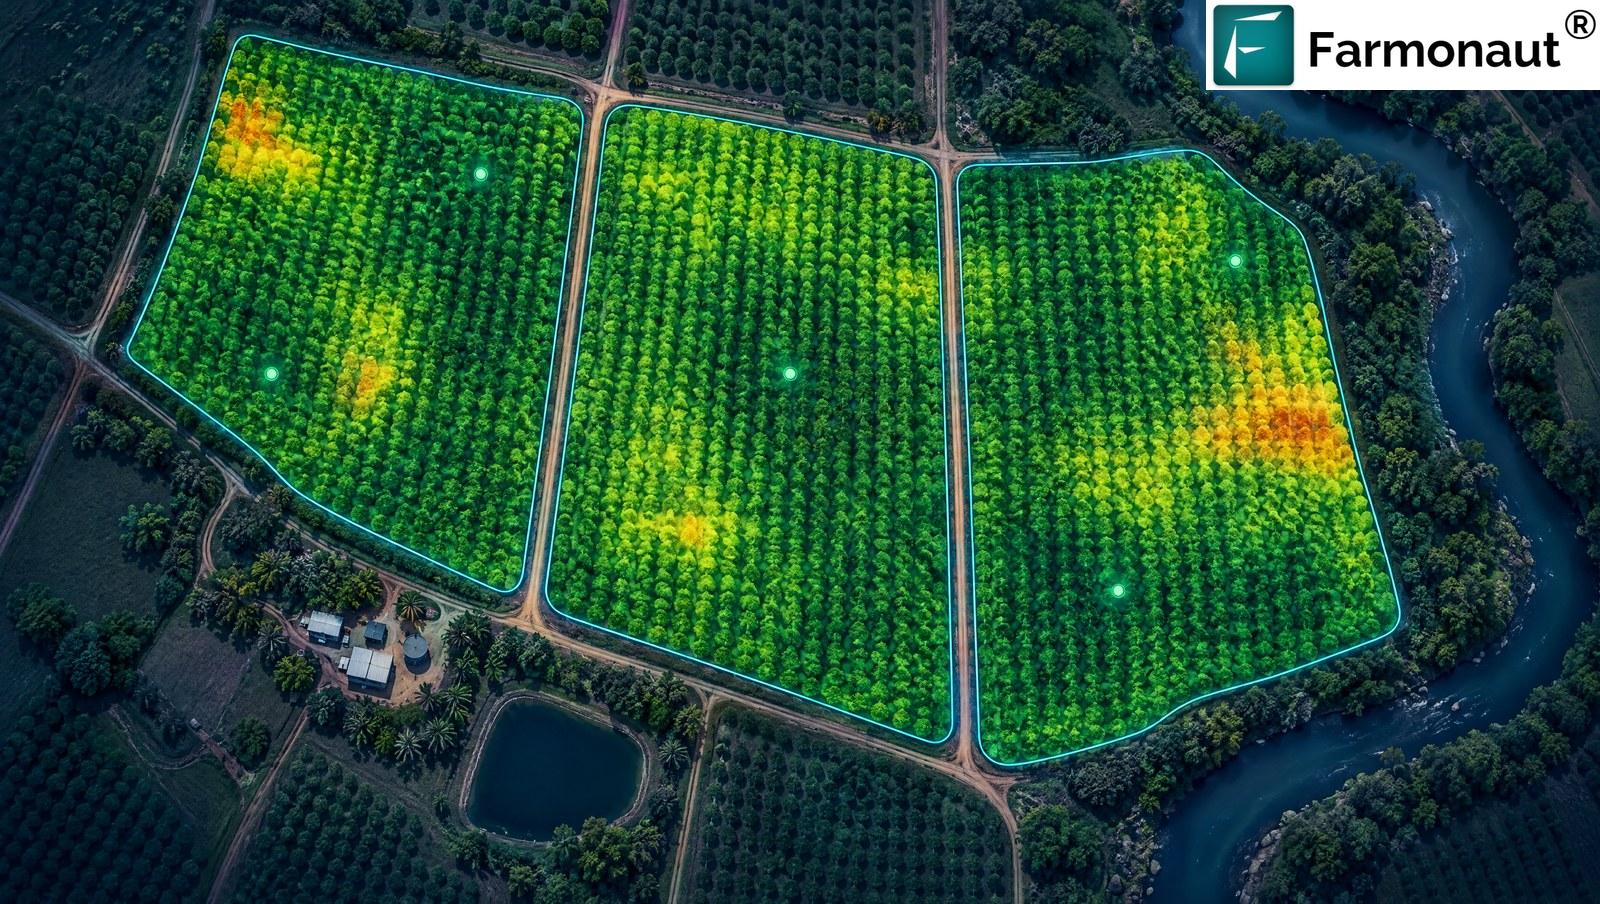
For every look, the system turns reflected light into 15 indices. For a mango grower, these are the ones that matter most.
| Index | The question it answers | Why a mango grower cares |
|---|---|---|
| NDVI | How vigorous is the canopy? | Shows which trees and blocks are growing strongest |
| NDRE | Is the tree short of nitrogen? | Reads chlorophyll in a dense canopy |
| NDMI | Is the canopy holding enough water? | Flags dry stress before leaves droop, vital before flowering |
| NDWI | Where is there standing water? | Finds wet spots after heavy tropical rain |
| EVI & SAVI | How healthy is the crop with soil and haze removed? | Cleaner readings between tree rows |
| Soil organic carbon | How rich is the ground? | Helps explain why one block out-performs another |
Mango flowering and the orchard year: what the satellite shows
Mango flowering drives the whole season, and it is the part of mango farming growers ask about most. Mango has a strong rhythm. Trees flush new leaves, then need a stress period to trigger flowering, then set and swell fruit, then ripen. Each stage has its own needs, and each leaves a mark on the satellite record.
Flushing. New leaf growth shows as a rise in NDVI and EVI. A block that flushes late or unevenly stands out against its neighbours.
Flower induction. Growers manage water and nutrition to push trees toward flowering. The moisture index shows how far the canopy has dried, helping the grower judge timing across a large block.
Fruit set and swelling. Water and nutrition matter again. A weak strip at this stage can mean smaller fruit, and it shows on the map before the fruit does.
Ripening and harvest. The map helps plan picking, so the right crews go to the right blocks at the right time.
Dry season and wet season: reading both
East Java has a clear rhythm of wet and dry months, and a mango orchard follows it. In the dry season, moisture is the main variable. The moisture index shows how far the canopy has dried, which helps a grower judge when trees are ready to flower and where irrigation is needed. Because the sky is clearer, optical looks are frequent and the maps are sharp.
In the wet season the picture flips. Cloud hides the orchard from optical satellites for long stretches, rain can waterlog low corners and disease pressure rises. This is when radar earns its keep. It keeps reading the orchard through the cloud, and the weather record sitting beside it shows how much rain has fallen. A grower can see a wet spot forming and drain it before it harms the roots.
Reading both seasons on one record is what makes the system useful over time. After a full year, the grower has a map of how each block behaves in dry and wet conditions, and can plan with that knowledge instead of memory.
| Stage | What changes in the orchard | What the map shows | What the grower can do |
|---|---|---|---|
| Flushing | New leaves emerge | NDVI and EVI rise, late or uneven blocks stand out | Check nutrition and water on the laggards |
| Flower induction | Trees are stressed to trigger flowering | Moisture index falls as the canopy dries | Time irrigation and treatments across blocks |
| Fruit set and swelling | Fruit forms and grows | Weak strips show against strong ones | Target water and fertiliser to weak strips |
| Ripening and harvest | Fruit matures unevenly | Blocks differ in vigour and condition | Plan crews and transport block by block |
Seen this way, the satellite is a calendar as much as a camera. It marks the orchard’s progress through the year, block by block, and gives the manager a chance to compare this season with the last. Over time, the pattern of each block becomes familiar, and departures from it become easy to spot.
Mango farming pests and diseases: where to look first
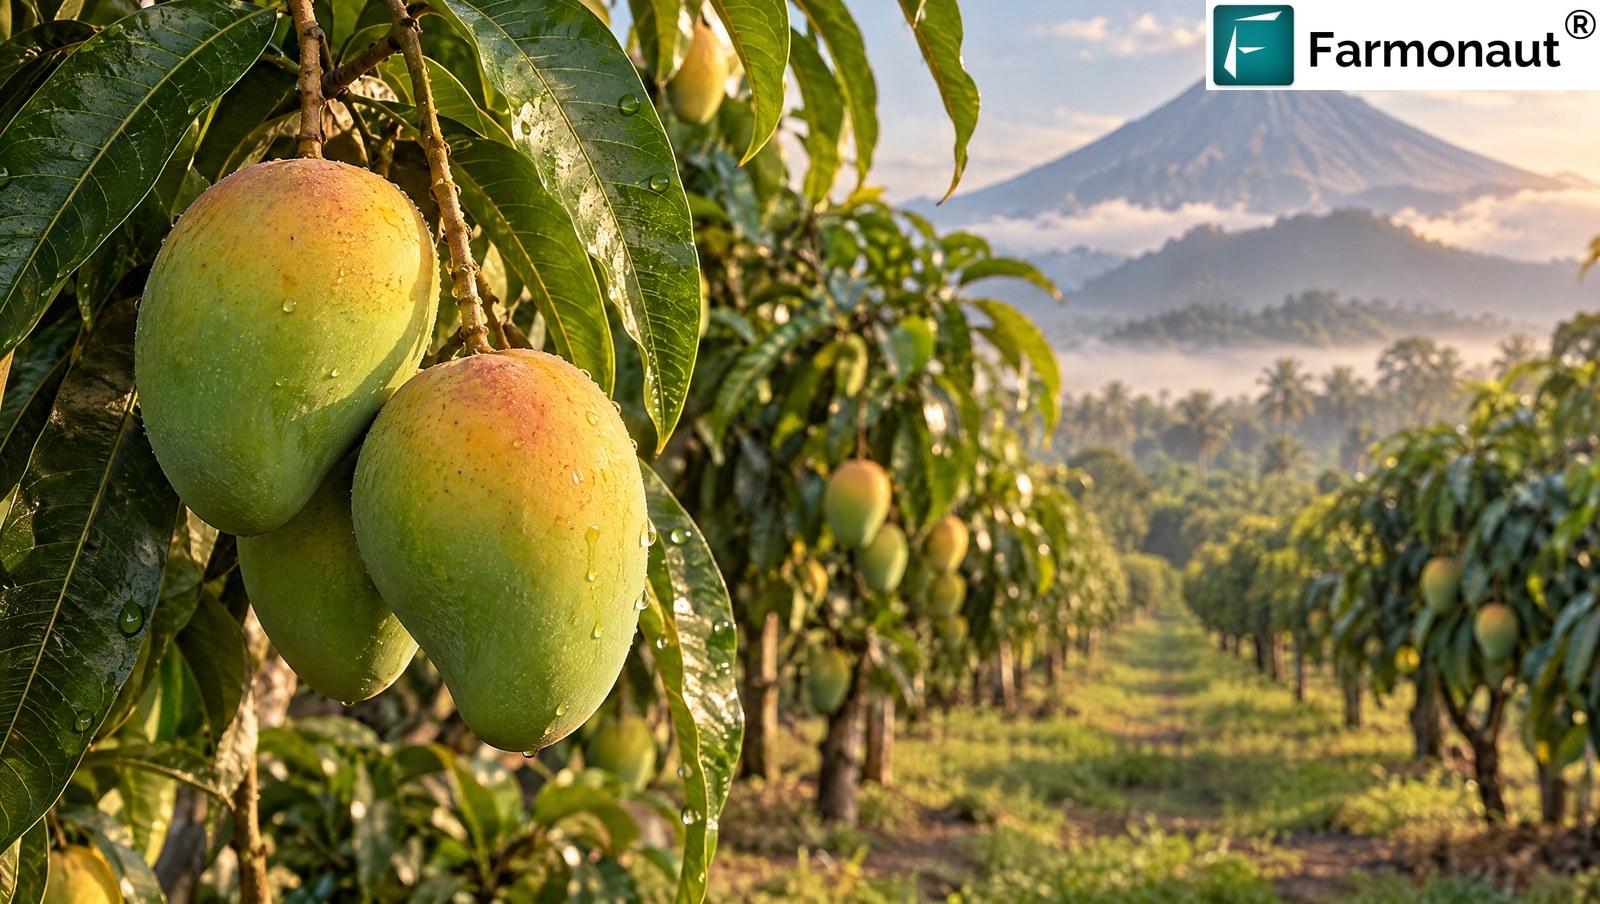
Mango orchards face a familiar list of pests and diseases, from hoppers at flowering to anthracnose in humid weather and fruit flies at ripening. A satellite does not identify these directly. What it does is show where the canopy is under stress, which is where a grower should look first. A block that is greening more slowly than its neighbours, or a strip that has paled, is a prompt to walk that area with a trained eye.
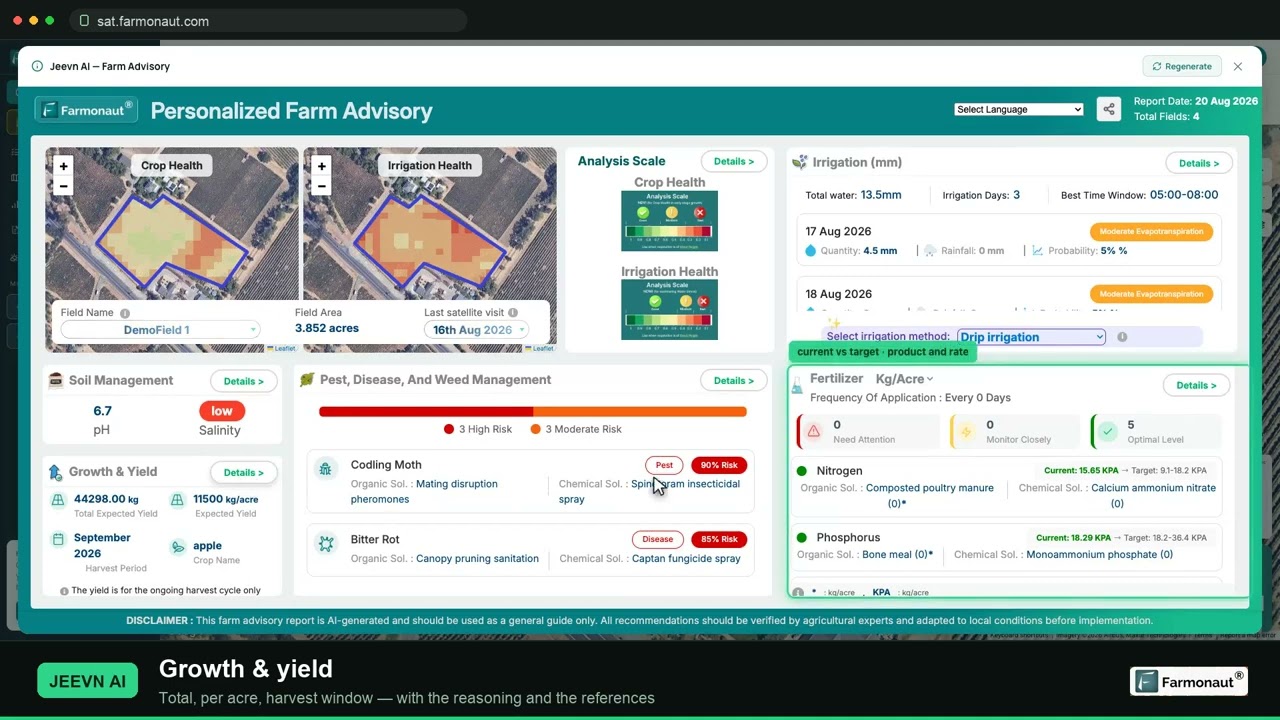
This is a powerful way to use limited scouting time. Instead of checking trees at random, the grower checks the trees the map points to. Problems are found sooner, treatments can be targeted, and healthy blocks are left alone. It is the same principle behind every precision-agriculture tool: put attention where it is needed.
Tropical orchards are sensitive to how water and fertiliser are used. Targeting both to the blocks that need them means less waste, less runoff and healthier soils. Satellite monitoring makes that targeting possible on a scale that walking the orchard never could.
A weekly routine that fits on one page
The best monitoring habit is a simple one. A routine that takes ten minutes a week and is actually followed beats an elaborate one that is skipped. For an orchard like this, a good weekly pattern looks like this:
- Open the three blocks and look at the latest vegetation map for each.
- Compare the blocks with each other and with the same week last year, once a year of data is on file.
- Note any flagged area and check the moisture and weather records for that block.
- Walk the flagged area at the next scouting round, starting there.
- Record what you found so next season’s map is easier to read.
That is the whole loop. The satellite does the watching, and the grower does the deciding. Over a season of repeated rounds, the pattern builds a very clear picture of how the orchard behaves.
What other growers get from the same system
This orchard manager’s own numbers belong to them. But the same system has been working on other farms around the world, and several growers have told us what it did for them. For perennial crops, the closest comparisons are blueberry and grapes, because trees and vines are watched across seasons in just the same way.
The pattern holds across crops and continents: 30 to 50 percent better decisions on water and fertiliser, and in the best cases 50 to 70 percent. A grape grower managing 34 plots reported more than 70 percent. For an orchard on a scale of 45 hectares, even a small share of that is worth chasing.
How much walking time could a map save in your orchard?
Enter your own orchard size and scouting pace. The default is this 45-hectare orchard.
- Hours to walk the whole orchard once: 15.0
- Hours to walk only the flagged part: 4.5
- Hours saved per round: 10.5
Illustrative arithmetic, not a forecast or a result for any grower. All inputs are editable placeholders; replace them with your own pace and rounds. Saved hours can be spent checking the flagged areas more carefully.
What satellite monitoring can mean for mango farming on Java
On a 45-hectare orchard, the benefits come from a few steady habits, each supported by the satellite record.
- ✔ Faster scouting. Walk the flagged blocks first, as the calculator above shows.
- 📊 Smarter inputs. Water and fertiliser go where the map says they are needed, which is where the 30 to 50 percent reported by other growers comes from.
- ✔ Earlier stress flags. Dry stress and weak vigour show on the map before the fruit is affected.
- 📊 Harvest planning. Seeing which blocks are ahead helps match crews and transport.
- ✔ A season-on-season record. Each year’s canopy curve becomes the baseline for the next.
Mango is a high-volume, high-value crop, so small gains are large in money terms. Protecting fruit size on even a part of a 45-hectare orchard protects a great deal of fruit. That is why monitoring tends to be easy to justify on a plantation this size.
Managing three blocks as one mango farming operation
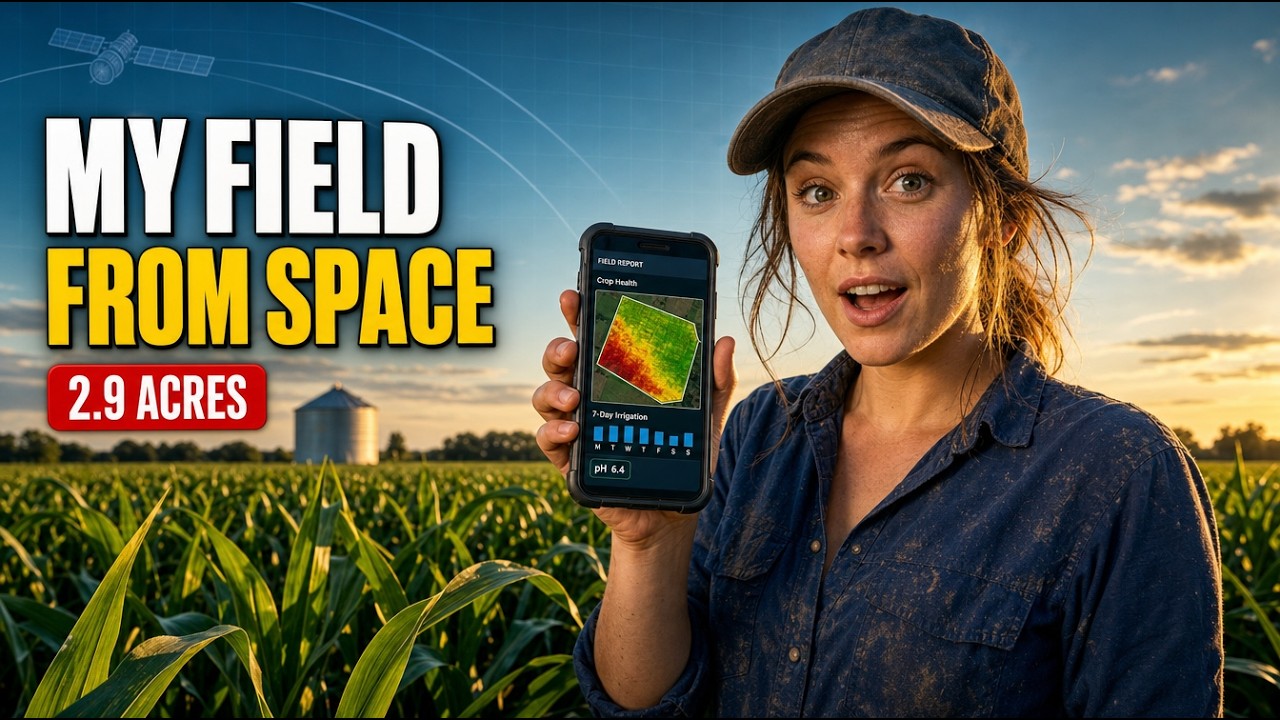
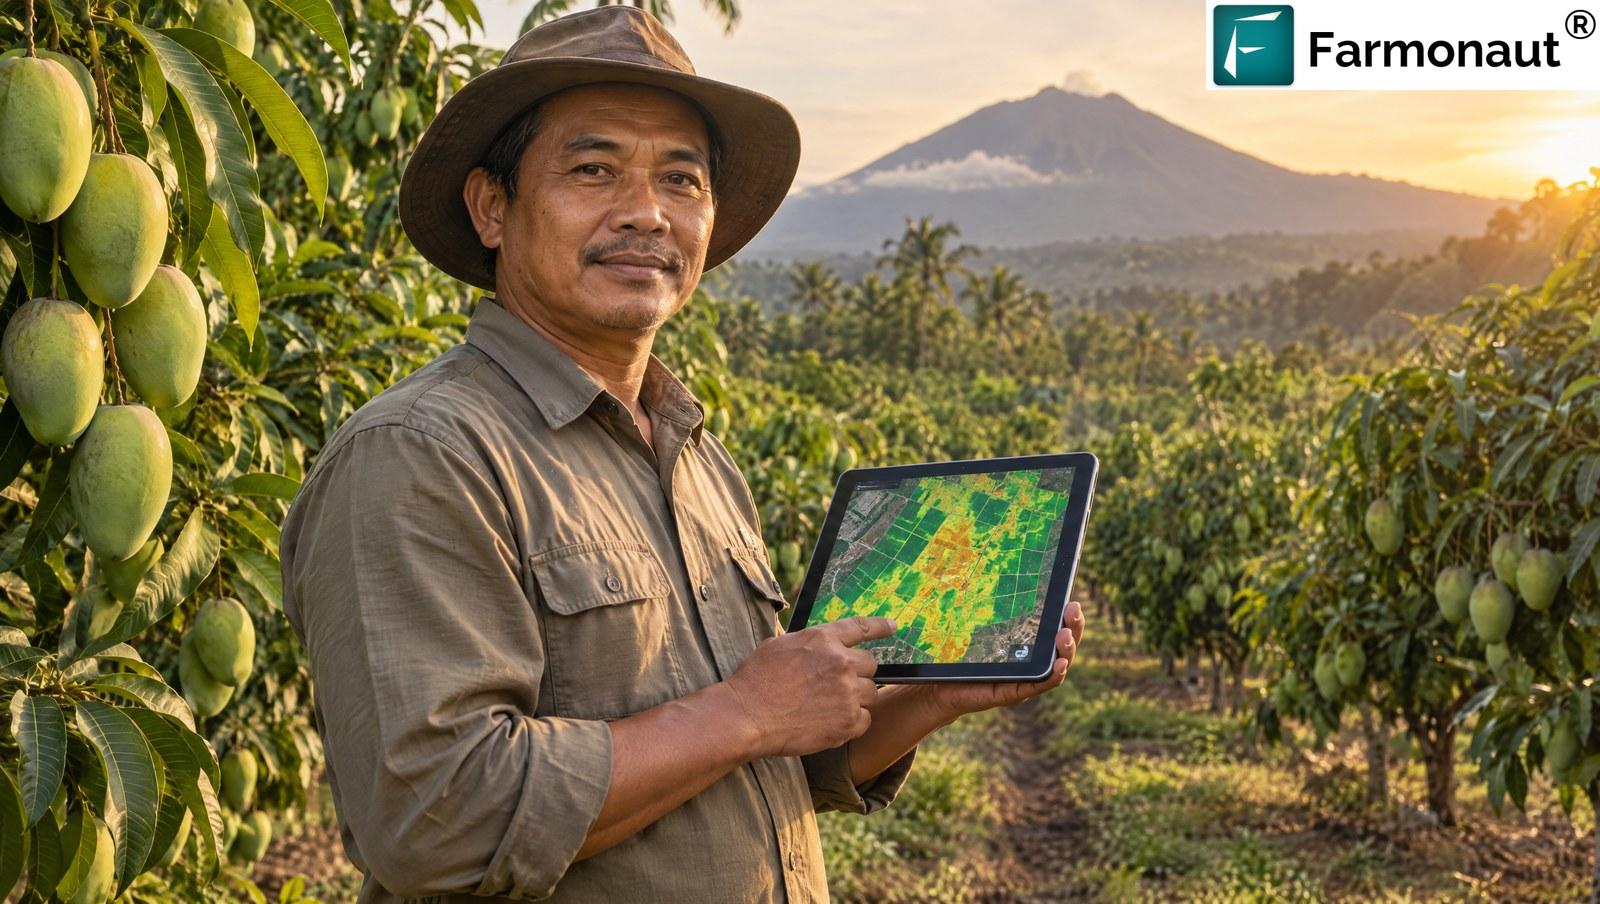
One of the quiet strengths of this set-up is that the three blocks sit side by side on one account. The manager can open all three on one screen, compare their vigour and moisture directly, and see at a glance which block is leading and which is lagging. The same weather and the same management produce different results on different blocks, and that difference is where the learning is.
If the largest block lags behind the two smaller ones in a particular month, the question is why. Is it soil, drainage, tree age or irrigation? The map does not answer that on its own, but it frames the question clearly and points to where to dig. A manager who can ask a clear question is already halfway to the answer.
“Eight months, three blocks, one unbroken record.”
Do not wait for a problem to open the map. A two-minute look each week teaches you what normal looks like for each block, and that makes the abnormal obvious.
What eight months of monitoring adds up to
It is easy to judge a monitoring subscription by a single map. The real value builds up over time. After eight months, this orchard has a record of 52 optical looks and 31 radar passes for each of three blocks, and 57 days of weather for each. That is more than 150 optical looks and nearly 100 radar passes across the orchard, all stored, all comparable.
That archive is an asset in its own right. It shows how each block flushed, flowered and set fruit this year, and it gives next year a benchmark to beat. A manager who has a clear picture of this season can walk into the next one knowing what to expect and where to look first. The second year of a monitoring record is always more useful than the first, and the third more useful than the second.
What a renewal tells you
A grower who renews every month is not renewing out of habit. Each payment is a fresh decision that the maps are worth having. Nine monthly renewals from January to September 2026 is a quiet but clear sign that the orchard finds the system useful. It is the kind of evidence a brochure cannot give, and it is what makes an affiliate introduction valuable: the partner has introduced a tool that stays.
Room to grow
Three blocks and 45 hectares is a start, not a limit. The same account can hold more blocks, more crops and more estates. Many mango growers also run other crops or neighbouring plots, and everything can sit under one login. As the record grows, so does the benefit, because every new season adds to a history that makes each map easier to read.
How the affiliate programme brought this orchard in
The orchard subscribed using an affiliate partner’s promo code. That is all the programme asks: a partner shares a code, a grower uses it, and the account is linked. The partner does not need to run the orchard or explain agronomy. They only need to introduce the tool.
The account has renewed every month since January 2026 and has been watching the orchard ever since. If you work with plantations, advise them, supply them or manage one, the same route is open. The code is personal, the link is permanent and the tool does its own work.
- ✔ Any crop, any country. The same code works for mango on Java, blueberry in Transylvania and corn in Illinois.
- 📊 Large estates welcome. One account can hold many blocks under one login.
- ✔ A working tool. Partners introduce a system with an eight-month record on a 45-hectare orchard, not a promise.
Bring satellite monitoring to your mango farming
Draw each block, set the crop and get vegetation, moisture and soil readings from your own trees, every few days, in every kind of weather.
More affiliate success stories
- ✔ Corn yield calculator and satellite monitoring: an Illinois case study
- ✔ Blueberry farming with satellite monitoring in Romania
- ✔ Small scale farming with satellites: five Indian farms
Frequently asked questions
What is satellite mango monitoring and how does it help mango farming?
It uses images from orbit to measure how vigorous, how thirsty and how well fed a mango orchard is, block by block. Growers use the maps to scout the right trees, time irrigation and fertiliser, and plan harvest.
Does satellite monitoring work for mango farming in Indonesia?
Yes. This 45-hectare orchard in Probolinggo Regency, East Java, has been looked at 52 times per block by optical satellite and 31 times by radar between February and October 2026. Radar keeps the record going through cloud.
Why does radar matter in a tropical orchard?
Cloud often blocks optical satellites in the wet season. Radar sends its own signal and works through cloud, rain and darkness, so the record never has long gaps.
What improvements do other growers report?
Across our published case studies, growers report optimising irrigation and fertiliser by 30 to 50 percent, and in some cases 50 to 70 percent. These are the growers’ own estimates from the in-app feedback form, not metered volumes.
How much scouting time can a map save?
It depends on the orchard and how much the map flags. The calculator in this article lets you enter your own size and pace; with a 45-hectare orchard and 30 percent flagged it shows well over a hundred hours a season.
Can satellite monitoring detect mango pests and diseases?
Not directly. It shows where the canopy is under stress, which is where to scout first, so problems are found sooner and treatments can be targeted.
Can I manage several blocks on one account?
Yes. This orchard holds three blocks under one login, each with its own boundary and record, so they can be compared side by side.
How does the affiliate programme work?
A partner receives a personal promo code. Growers who subscribe using that code are linked to the partner. To join, contact our team through the link on this page.
Is Farmonaut Satellite + AI free?
No. The Farmonaut Satellite + AI Farm Monitoring System is a paid subscription. Plan details are on the platform.
Glossary
- NDVI
- Normalised Difference Vegetation Index, a satellite measure of how green and vigorous the canopy is.
- NDMI
- Normalised Difference Moisture Index, a measure of how much water the canopy is holding.
- SAR (radar)
- Synthetic aperture radar, a satellite signal that works through cloud and in darkness.
- Flower induction
- The management of water and nutrition to push mango trees into flowering.
- Flush
- A burst of new leaf growth on a tree, common in mango before flowering.
Case-study basis: the Farmonaut platform records for a single account, covering 3 February to 11 October 2026, including field boundaries, crop settings, satellite and radar acquisition dates, weather records and subscription activity. Crop, region, area and monitoring dates are reported from the account’s own records. The orchard manager is not named and precise locations are withheld. The percentages shown for other growers are those growers’ own estimates from the in-app feedback form, as published in the corresponding Farmonaut customer case studies, and are not metered or independently audited. The scouting calculator is illustrative arithmetic with editable placeholders, not a forecast. Individual results vary with crop, weather, soil and management. Satellite indices describe crop condition and do not on their own diagnose a cause. Photographs and scene images in this article are AI-generated illustrations, labelled as such in their captions; they do not depict the manager, their staff or their orchard. The Farmonaut Satellite + AI Farm Monitoring System is a paid product.
Discussion
Questions, corrections or field experience? Share them below. First-time comments are reviewed before they appear, and your email is never published.
No comments yet. Be the first to add a question or your experience.

 Grow Indigo
 FFBS
FFBS Jontra
 Kalustyan
 Tucor
Tucor Geno
Geno Hayleys Agriculture
 Linx Agritech
 Adinet
 Save Your Soils
 Grandstream Algérie
 XOS Realty
 Geospatial Lab Africa
 Agro La Gándara
 HIPSAC
 ZOL Zimbabwe
 Juligerm
