

Banana in Maharashtra, cotton and black gram in the Deccan, lemons in Andhra Pradesh, paddy in the Cauvery delta, mango and soybean in Telangana. Five smallholder farms, from a tenth of a hectare to four and a half, each put under satellite watch through a Farmonaut affiliate partner.
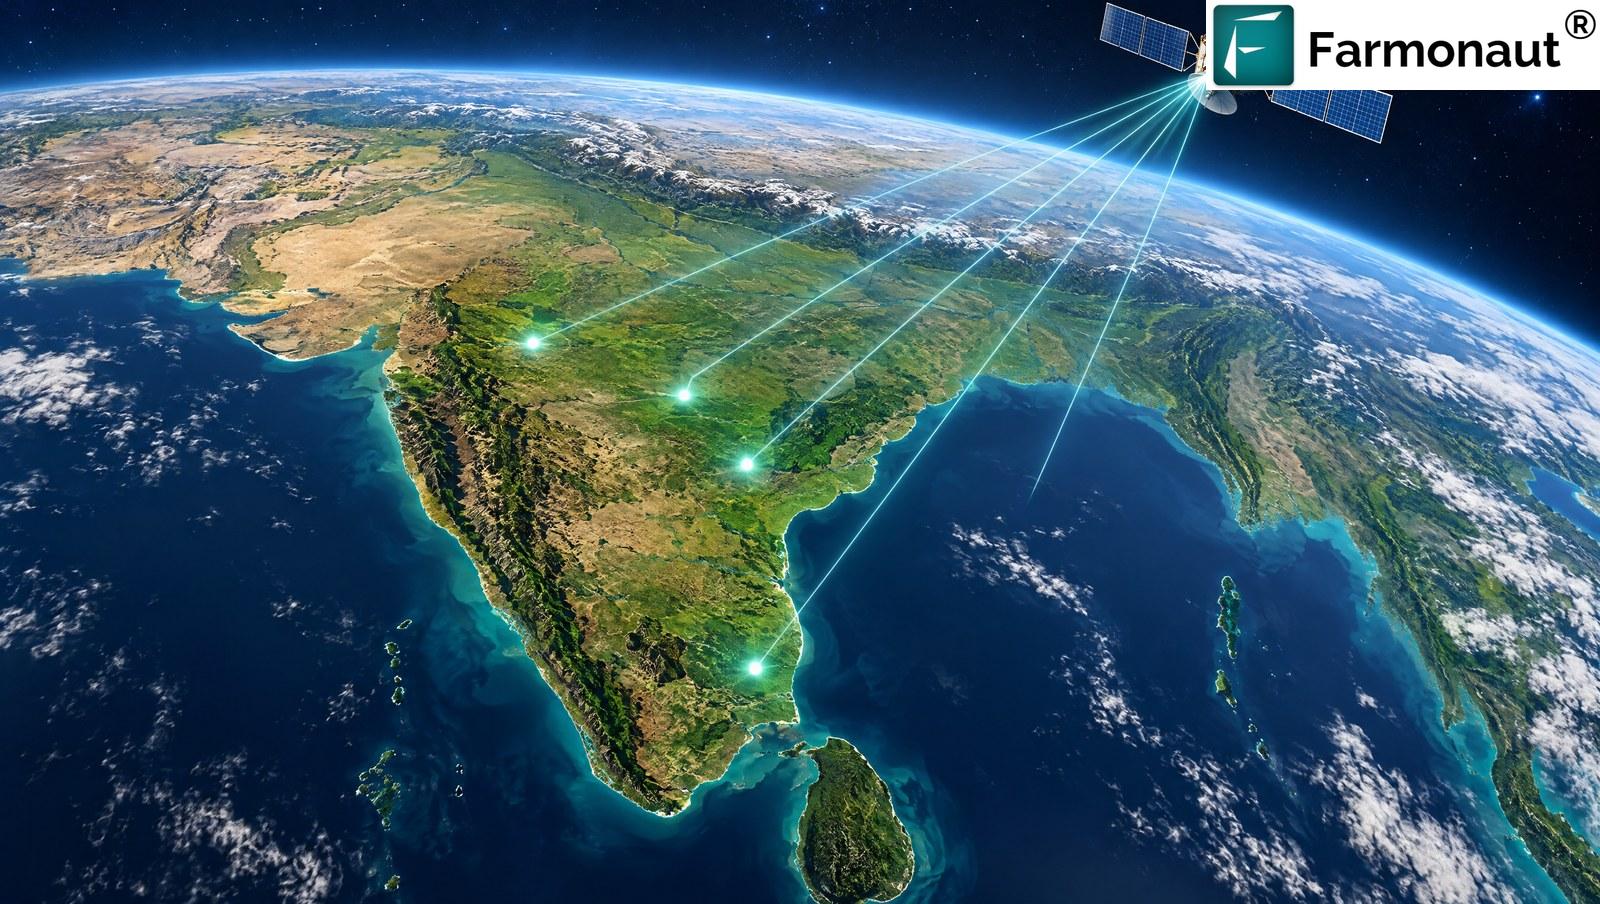
Small scale farming is the backbone of Indian agriculture: India has more farms than any other country on earth, and most of them are small. A satellite that can only help a thousand-hectare estate is of little use here. This collection of five farms shows the opposite: satellite monitoring working on plots as small as an eighth of a hectare, brought to each farmer by a local affiliate partner.
Each of these farms uses the Farmonaut Satellite + AI Farm Monitoring System. Each came through an affiliate promo code, shared by an agri-business or an adviser who knew what the system could do. None of them needed new equipment, a field visit or a long set-up. A boundary on a map and a crop name were enough to start.
“The smallest farm in this story is a tenth of a hectare, and it was looked at fifty times.”
The old objection to satellite monitoring was scale: pixels too big, plots too small. That is no longer true. Modern satellites resolve fields of a fraction of a hectare, which means a smallholder gets the same map quality as an estate.
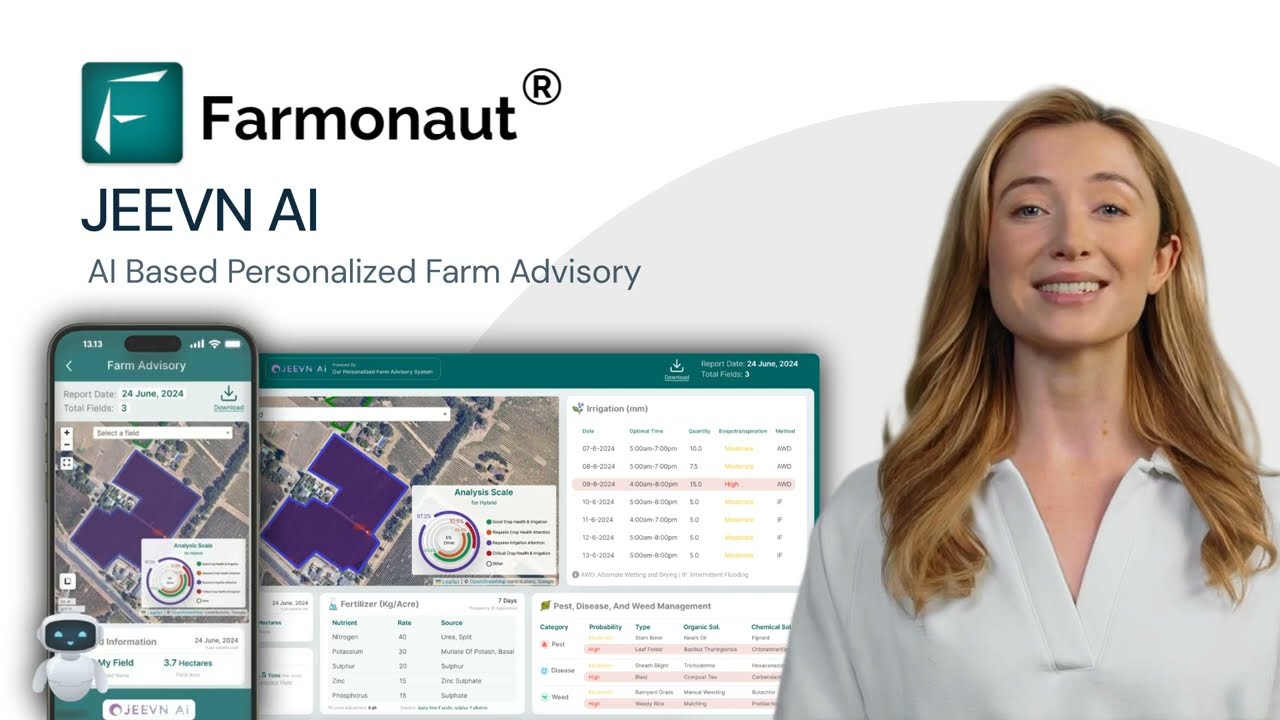
Five farms at a glance: small scale farming across four states
The farms differ in crop, size and state, but they share the same basic route: a promo code from an affiliate partner, a boundary drawn on the map, and a regular stream of readings. Here is each of them in turn.
| Farm | Crop | State | Size | Monitored | Optical looks |
|---|---|---|---|---|---|
| 1 | Banana | Maharashtra (Marathwada) | 0.12 ha | July 2025 to March 2026 | 50 |
| 2 | Cotton and black gram | Maharashtra | 0.5 ha and 0.33 ha | September to October 2025 | 7 each |
| 3 | Lemon and sweet lemon, five-year-old trees | Andhra Pradesh (Rayalaseema) | 0.98 ha | October to November 2025 | 7 |
| 4 | Paddy, four plots | Tamil Nadu (Cauvery delta) | 3.4 ha total | February to May 2026 | 15 (31 on one plot) |
| 5 | Mango, soybean and cotton, four plots | Telangana (Sangareddy district) | 4.5 ha total | July to August 2026 | 7 (one plot 1) |
Farm 1: banana in Maharashtra
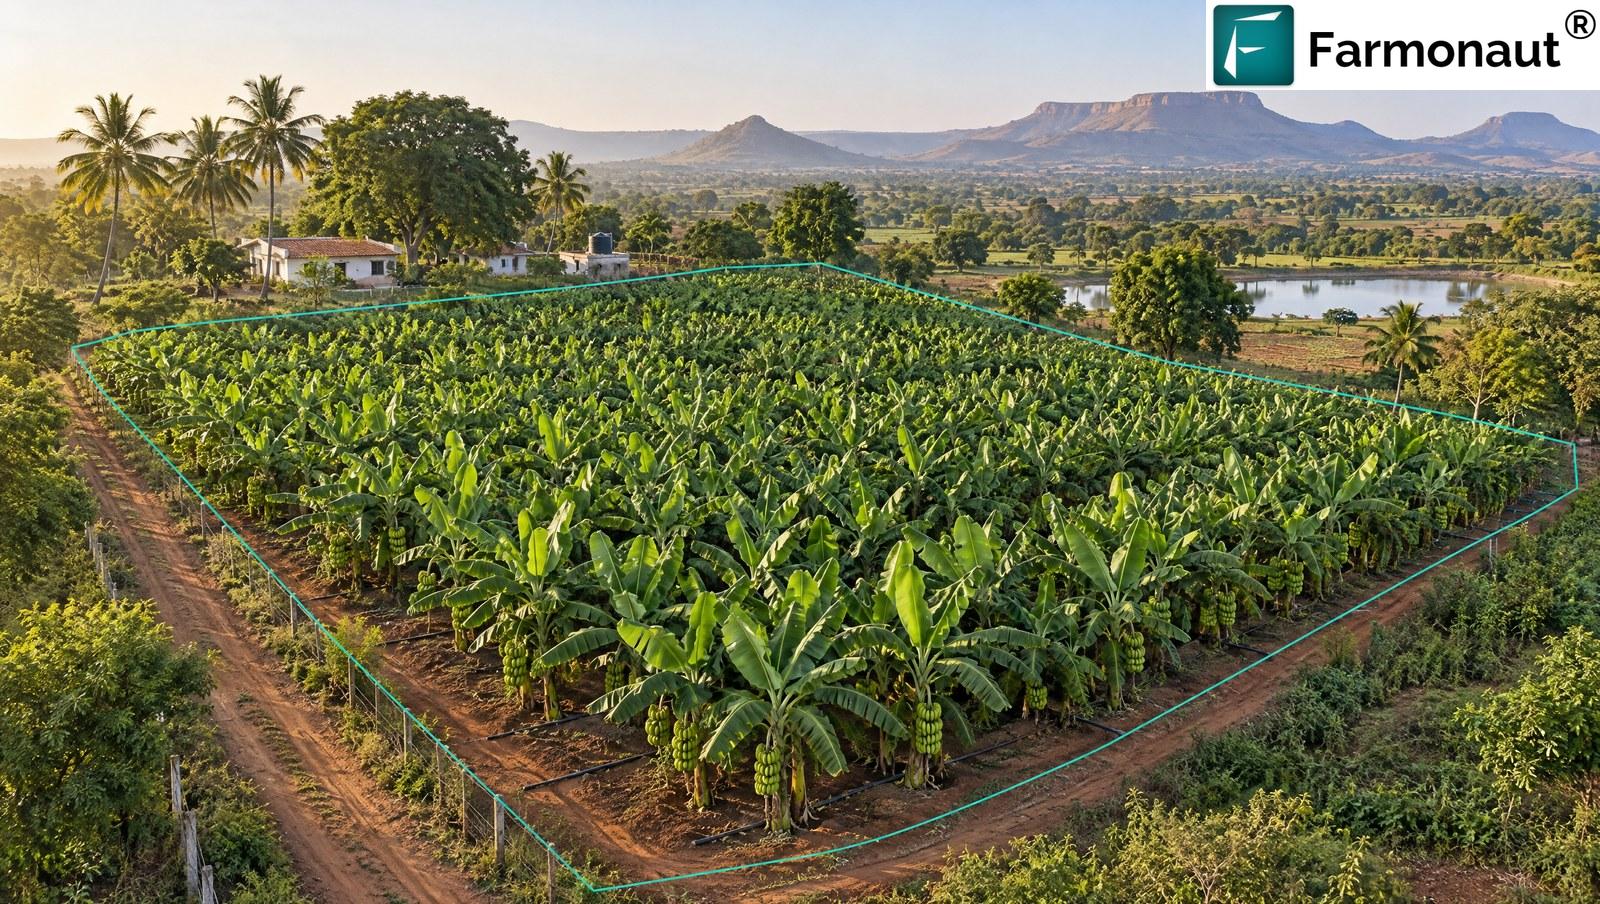
The smallest farm here is a banana plot of just 0.12 hectare, about 0.3 acre, in the Marathwada region of Maharashtra. It was drawn onto the map in July 2025, and the satellite system followed it through to March 2026. That is 50 optical looks, 37 radar passes and 65 days of weather records for a plot a little bigger than a tennis court.
Banana farming rewards steady water and nutrition, and banana is a thirsty, fast-growing crop with distinct stages from planting through shooting to harvest. The plot’s record shows the whole run, and it gives the farmer something rare on a farm this size: a clear, dated picture of how the crop actually grew. The affiliate who introduced it is an agri-business that works with growers in the area.
Farm 2: cotton and black gram in Maharashtra
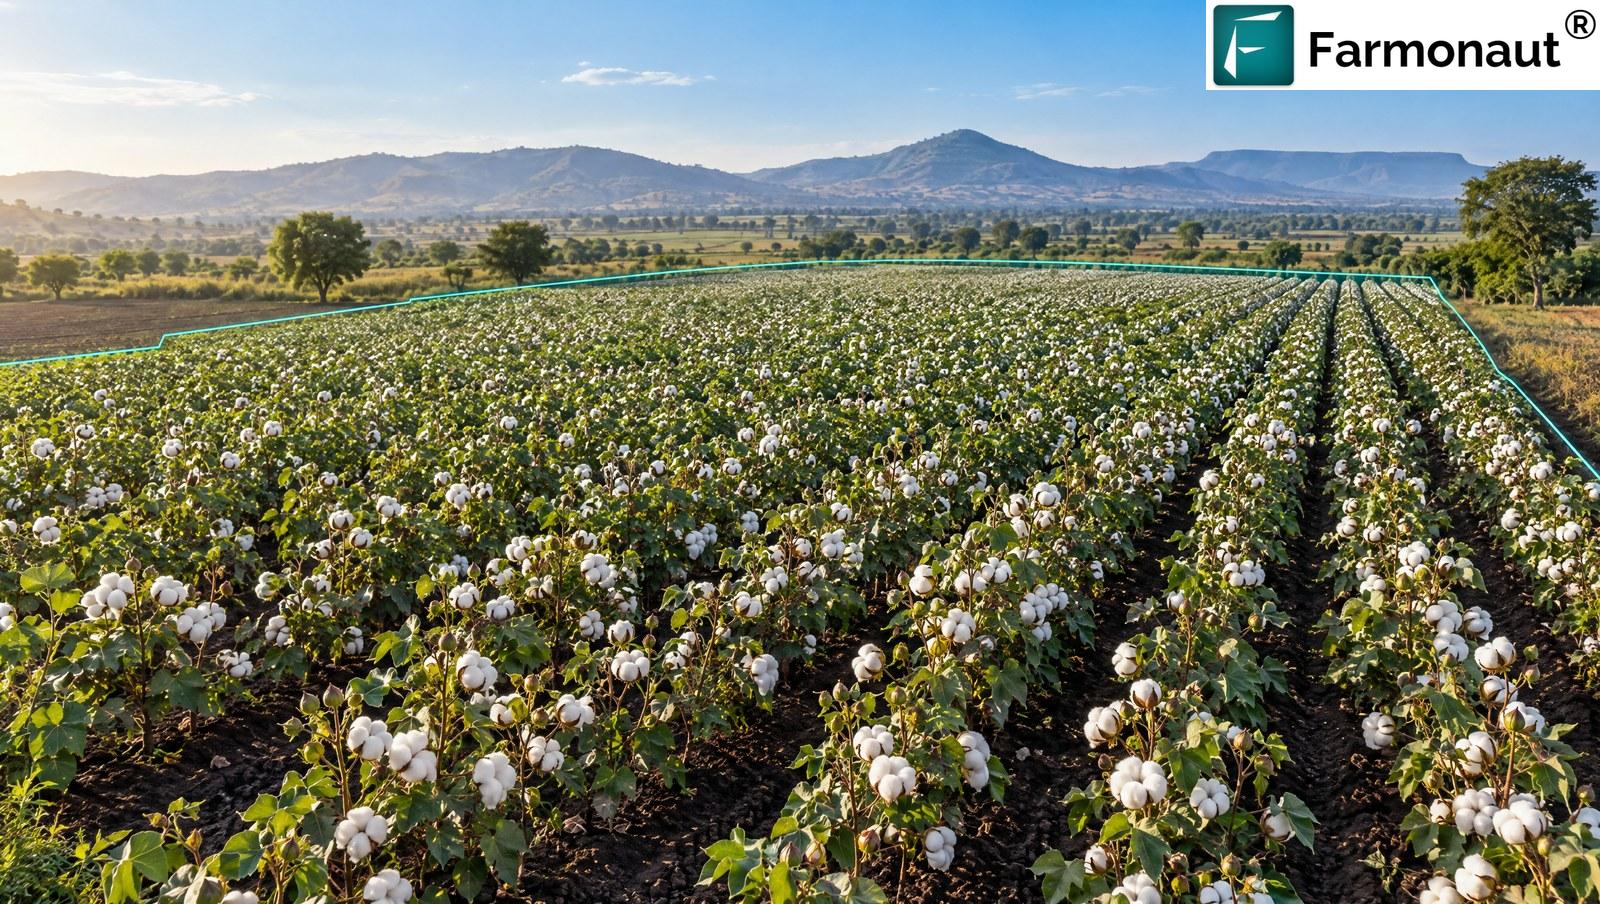
The second account holds two small plots in Maharashtra: a 0.5-hectare cotton field sown at the end of June 2025 and a 0.33-hectare black gram plot sown in early July. Satellite coverage began on 24 September 2025 and followed both crops through to harvest time in late October, with seven optical looks and a radar record on each.
Cotton farming and black gram sit on very different calendars (see our guide to cotton growth stages). Cotton is a long-season crop that needs steady moisture through boll development, while black gram is a short pulse crop that matures quickly. Watching both on one login shows how differently they move through the same season. An agri-input partner brought the farmer to the platform.
Farm 3: lemons in Andhra Pradesh
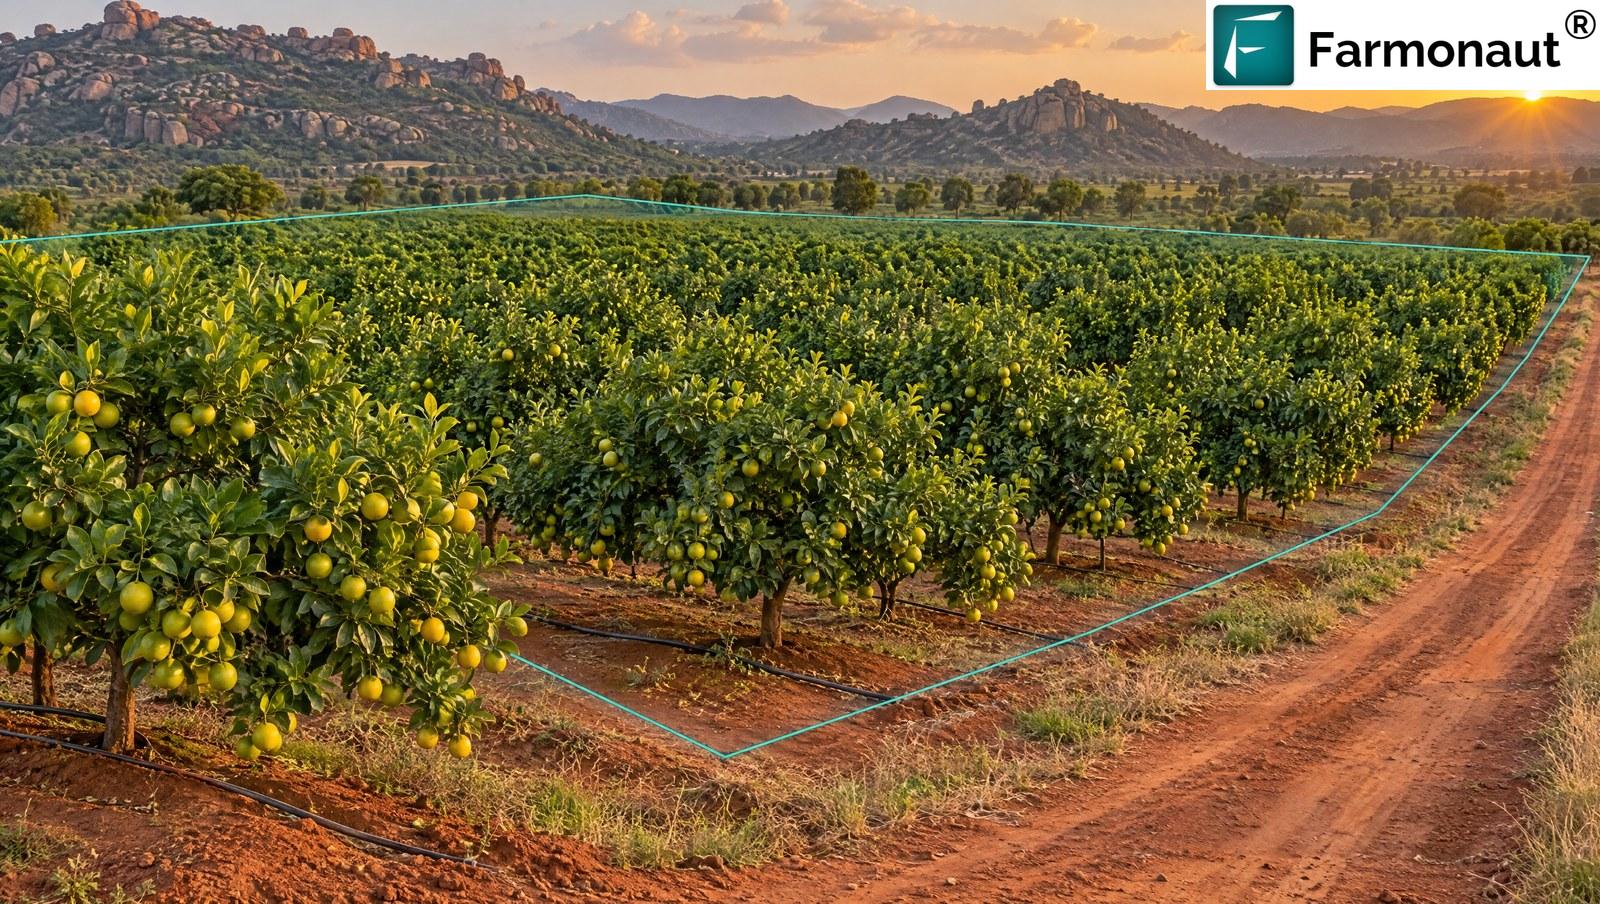
In the Rayalaseema region of Andhra Pradesh, a 0.98-hectare orchard of mixed lemon and sweet lemon trees, about five years old, went under satellite watch on 29 October 2025. Seven optical looks followed through November, each with 15 indices on vegetation, moisture and soil.
Lemon farming and other citrus is perennial work, so every month of data adds to a long-term record of how the orchard behaves. Five-year-old trees are coming into full production, which is exactly when a farmer wants to know which part of the orchard is leading and which is lagging. The partner who introduced the orchard is an agri-technology company in the region.
Farm 4: paddy in the Cauvery delta
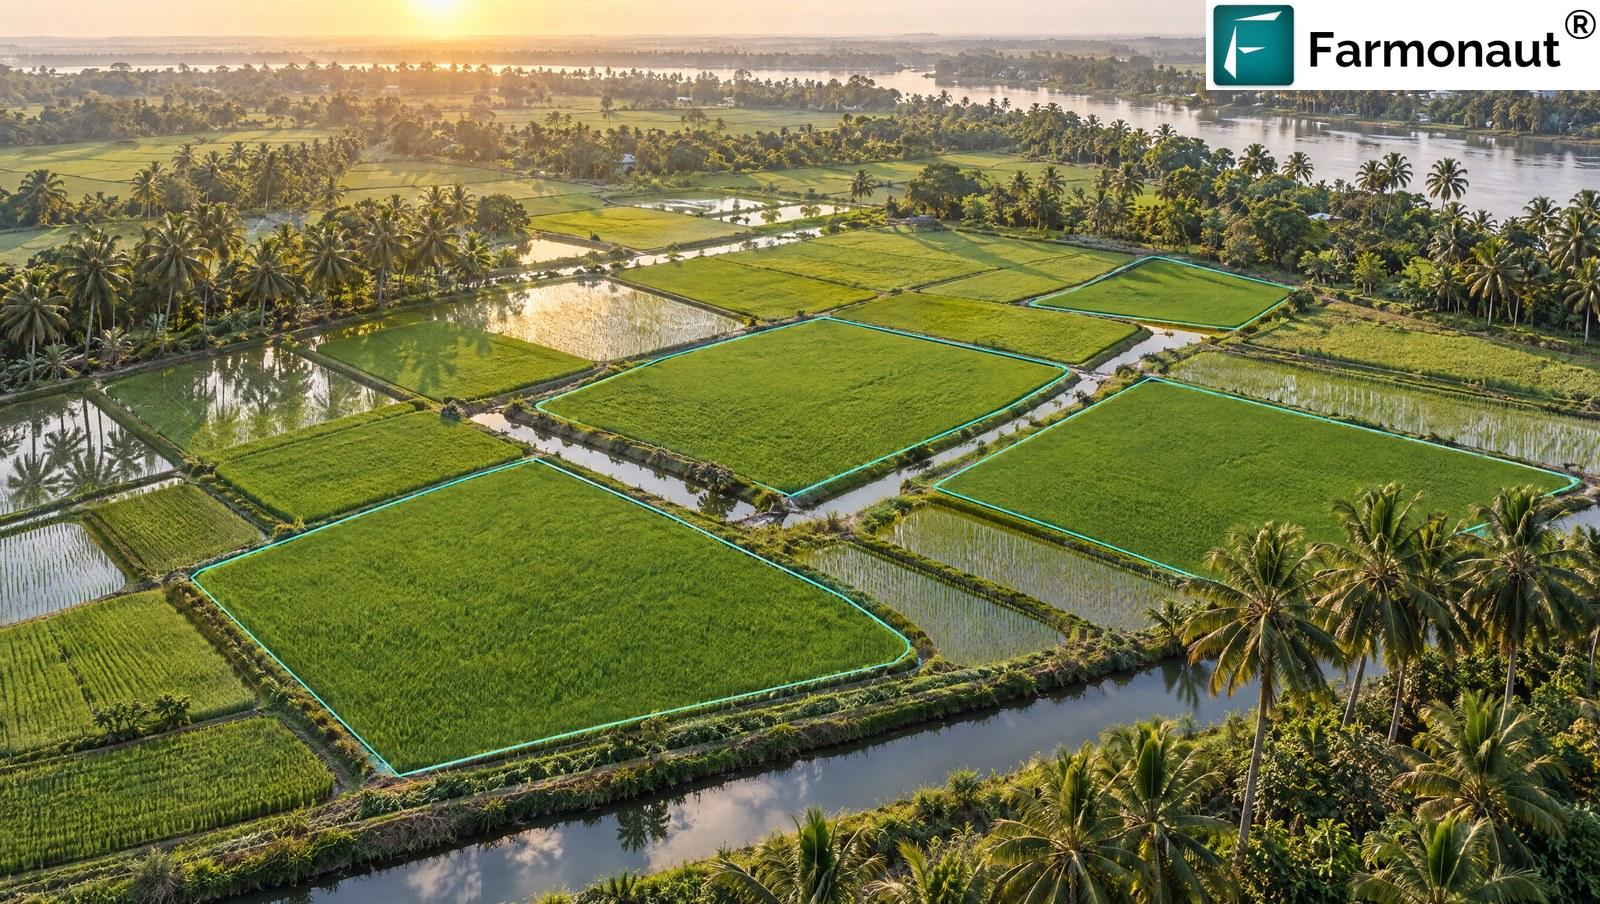
The Cauvery delta in Tamil Nadu is one of India’s great rice regions. A farmer here put four paddy plots on the map in February 2026, totalling 3.4 hectares: 1.34, 0.88, 0.30 and 0.90 hectares. Satellite coverage ran from late February to late May, with 15 optical looks on three plots and 31 on the fourth, which had been on the system since late November 2025.
Paddy is a crop that rewards close water management. The moisture and water indices show standing water, saturation and drying across the plots, which matters when each plot is flooded and drained on its own schedule. The farmer came through the affiliate code that also brought the Illinois corn grower and the Telangana farm in this story, a reminder that one partner’s reach can span continents.
Farm 5: mango, soybean and cotton in Telangana
In Sangareddy district of Telangana, a farmer drew four plots on the map on 14 July 2026: a 1.07-hectare mango orchard, a 0.56-hectare soybean plot, a 0.37-hectare cotton plot and a larger 2.51-hectare mango block. Together they cover 4.5 hectares and three very different crops.
The first optical looks arrived within days, and the record ran through the start of the monsoon crop season to the second week of August. Mixed holdings like this are common across India: a few trees, a food crop and a cash crop on the same farm. One login holds all four plots, each with its own crop, boundary and record.
Satellite monitoring is one layer of precision agriculture, and it works alongside farm management software. For a comparison from Africa, see how smart farming technology boosts Kenyan smallholder agriculture.
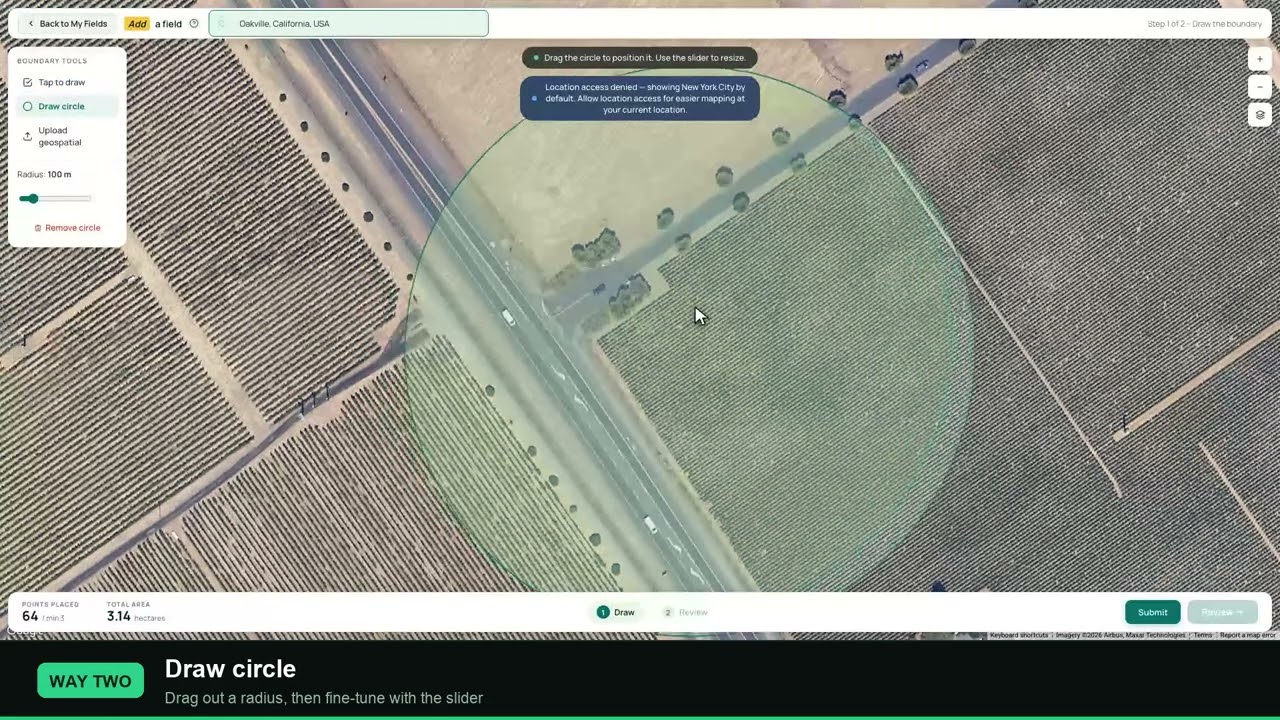
Why small scale farming is where satellites help most
Smallholder farming defines India: the average farm holding is only about one hectare, according to the country’s Agriculture Census. Most farmers have no large machinery, no agronomist on staff and no spare hours to walk every corner. They do have a phone, and for them a satellite map is a remarkably level playing field.
A small plot is easy to see in full, but hard to read. Is the crop stressed, or just a different colour in the afternoon light? Is the water reaching the far end? A satellite gives an objective answer, the same way for a 0.12-hectare banana plot as for a 50-hectare estate. It does not need to be bigger to be useful.
- ✔ An objective second opinion. The map shows what the crop is doing, not what it looks like in the light.
- 📊 Dated records. Every look is stored, so the farmer can compare this month with last month and this year with last.
- ✔ No equipment. No sensors to buy or maintain; just a phone and a boundary.
- 📊 Radar through the monsoon. The record keeps going through cloud, which is exactly when Indian farms need it most.
On a small plot, name each plot after the way you talk about it, such as the field by the well or the corner near the road. The map then matches the way you think about your land.
A year of small scale farming: what a record gives you
On a small farm, memory is the main record, and memory is unreliable. Which plot greened first last year? How long did the dry spell last? When did the second flush come? A satellite record answers these questions with dates and maps, not guesses.
Take the banana plot. Fifty optical looks between July 2025 and March 2026 give the farmer a near-weekly view of how the crop grew, from establishment through to shooting. If next year’s planting is a month later, or the water is applied differently, the two records can be laid side by side. Differences become visible, and so do their effects. That is how a small farm starts to learn from its own history.
What a record is worth over time
The first season of data is a baseline. The second makes comparison possible. By the third, a farmer has a genuine picture of how each plot behaves in a good year, a dry year and a wet one. For perennial crops like lemon and mango, that history stretches over many years and becomes part of the value of the orchard itself.
None of this needs the farmer to do anything extra. The system looks, stores and compares by itself. The farmer opens the map when it is useful, and the history is already there.
“A small farm does not need a big sensor budget. It needs a record.”
What the satellite reads in small scale farming
For every look, the system turns reflected light into 15 indices. For smallholders, these are the ones that matter most.
| Index | The question it answers | Why a smallholder cares |
|---|---|---|
| NDVI | How vigorous is the crop? | Shows uneven growth and weak corners |
| NDRE | Is the crop short of nitrogen? | Guides when to top-dress, saving fertiliser |
| NDMI | Is the crop holding enough water? | Flags dry stress early, helps time irrigation |
| NDWI | Where is there standing water? | Useful for paddy and for wet low corners |
| EVI & SAVI | How healthy is the crop with soil removed? | Cleaner readings on young or thin crops |
| Soil organic carbon | How rich is the ground? | Helps explain why one plot out-performs another |
None of this requires the farmer to understand remote sensing. The platform presents the results as maps and simple readings. What it asks is that the farmer looks at the map, asks “where is the weakest part?” and walks there first.
The monsoon test
Indian farms live by the monsoon, and so does optical satellite imaging: the heavier the cloud, the fewer clear views. This is the situation where radar matters most. The banana plot’s record shows it clearly, with 37 radar passes alongside 50 optical looks over eight months. The farmer is never left without a current reading, whatever the sky is doing.
For a smallholder, this reliability is what turns monitoring from a curiosity into a habit. A tool that works only on clear days works only some of the time. A tool that works through the monsoon works when the farm needs it most, because cloud, rain and humidity are exactly the conditions in which crops get stressed and diseases take hold.
Crop by crop: what each farm gets from the map
The five farms grow seven crops, and each crop uses the satellite record differently. Here is how the same set of indices serves each one.
| Crop | What matters most | What the map helps with |
|---|---|---|
| Banana | Steady water and nutrition through fast growth | Spotting uneven growth and dry rows early |
| Cotton | Moisture through boll development | Timing irrigation and watching vigour |
| Black gram | A short season with little room for error | Catching stress during the few weeks that decide the crop |
| Lemon and sweet lemon | Consistent orchard-wide vigour over years | Comparing trees and building a long record |
| Paddy | Water depth and drainage by plot | Seeing standing water and drying across plots |
| Mango | Flowering and fruit set | Reading moisture and vigour across blocks |
| Soybean | Early establishment and pod fill | Checking even emergence and later stress |
The pattern is the same everywhere. The satellite does not replace the farmer’s knowledge of the crop. It adds a second pair of eyes that sees the whole plot at once, in every kind of weather, and remembers everything it saw.
Small farms that use water and fertiliser more precisely also protect their own soil and the water around them. Less runoff, less waste and healthier ground are benefits that outlast any single season.
What Indian Farmonaut growers report
These five farmers’ numbers belong to them. But other Indian growers using the same system have told us what it did on their farms. In our published case studies they reported, in their own estimates on the in-app feedback form, the following improvements in irrigation and fertiliser decisions.
The pattern is steady: 30 to 50 percent better irrigation decisions on cotton, banana, onion and potato, and fertiliser savings of up to 20 percent. On a farm that spends a large share of its budget on water, power and fertiliser, those are serious numbers.
How much could better water and fertiliser decisions save on your farm?
Enter your own acres and yearly spend. The default is a small two-and-a-half-acre farm.
- Total spend on water and fertiliser: ₹37,500
- Saving at 10%: ₹3,750
- Saving at 20%: ₹7,500
- Saving at 30%: ₹11,250
Illustrative arithmetic, not a forecast or a result for any farmer. The spend figure is an editable placeholder, not a quote; replace it with your own costs. The improvement lines mirror the ranges Indian growers have reported as their own estimates.
How affiliate partners reach smallholders
Every farm in this story arrived through a person, not an advert. An agri-business that sells inputs to local growers. An adviser who visits farms. A fellow farmer who tried the system and told a neighbour. That is how technology spreads among smallholders: through people they already trust.
The Farmonaut affiliate programme is built around that fact. A partner receives a personal promo code. Any farmer who subscribes with it is linked to the partner. The partner does not need to handle money, install anything or provide support. They only need to introduce the tool and let the farmer see it work.
- ✔ Input dealers and agri-businesses already know which farmers want better information.
- 📊 Advisers and consultants can add a satellite record to every farm they visit.
- ✔ Farmer groups and co-operatives can introduce members one by one, plot by plot.
- 📊 Any size, any crop. From a 0.12-hectare banana plot to a 4.5-hectare mixed farm, the same code works.
For a partner, the programme turns an existing network into a service. Every farmer who subscribes gets a record that lasts for years, and the partner is linked to each one. The more seasons a farmer stays, the stronger the relationship becomes.
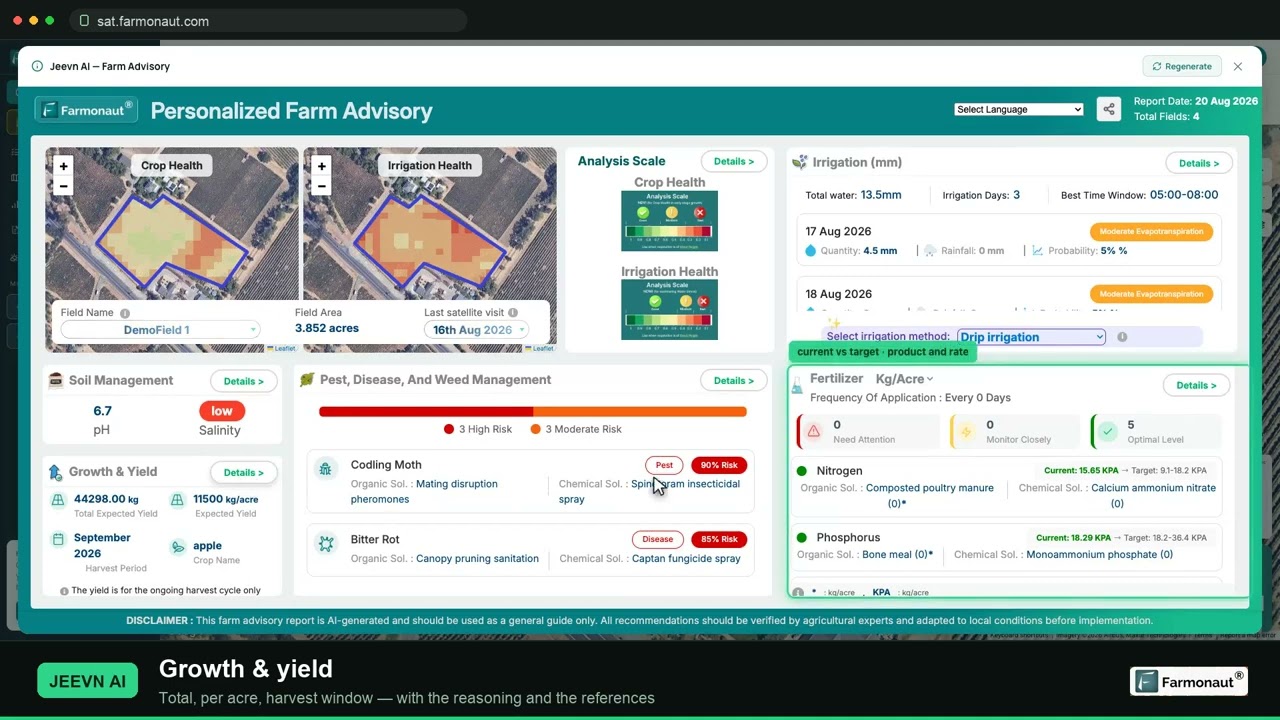
Every farm in this story was introduced by a person. Trust travels through people, and a promo code is simply a way of making a personal recommendation easy to follow through.
One partner, three countries
The affiliate code behind the Tamil Nadu and Telangana farms also introduced a corn grower in Illinois, as told in our Illinois story. One partner’s code has now reached farms in two countries and three very different crops. That is the kind of reach a single personal introduction can have when the tool does its own work.
What a partner should know before introducing the tool
A good introduction is honest and simple. Show the farmer their own plot on the map. Point out the weakest corner and ask whether they already knew about it. That moment, when the map confirms what the farmer suspected or reveals what they had missed, is what makes the tool real.
- Start with one plot. Draw it on the map in front of the farmer.
- Show the vegetation map. Let the farmer find the weak corner.
- Show the history. Explain that every look is stored and compared.
- Leave the code. The farmer subscribes when ready, and the account is linked.
Partners who work this way build lasting relationships. The farmer sees value on their own land, in their own words, and keeps the subscription because it keeps being useful.
Bring satellite monitoring to your small scale farming
Map each plot, set the crop and get vegetation, moisture and soil readings from your own ground, every few days, in every kind of weather.
More affiliate success stories
- ✔ Corn yield calculator and satellite monitoring: an Illinois case study
- ✔ Blueberry farming with satellite monitoring in Romania
- ✔ Mango farming with satellite monitoring in East Java
Frequently asked questions
Can satellite monitoring work for small scale farming?
Yes. These five farms range from 0.12 to 4.5 hectares, and the smallest plot was looked at 50 times between July 2025 and March 2026. Modern satellites resolve fields of a fraction of a hectare.
Does it work during the monsoon?
Yes. Optical satellites are limited by cloud, but radar passes work through cloud, rain and darkness, so the record keeps going through the monsoon.
What crops can I monitor?
The farms in this story grow banana, cotton, black gram, lemon, paddy, mango and soybean. The platform supports many more, each with its own growth stages.
What improvements do Indian growers report?
In our published case studies, Indian growers report improving irrigation decisions by 30 to 50 percent and fertiliser savings of up to 20 percent. These are the growers’ own estimates from the in-app feedback form, not metered volumes.
Does small scale farming need any equipment for satellite monitoring?
No. You need a phone, tablet or computer and a boundary drawn on the map. There are no sensors to buy or install.
How does the affiliate programme work?
A partner receives a personal promo code. Farmers who subscribe using that code are linked to the partner. To join, contact our team through the link on this page.
Is Farmonaut Satellite + AI free?
No. The Farmonaut Satellite + AI Farm Monitoring System is a paid subscription. Plan details are on the platform.
Glossary
- NDVI
- Normalised Difference Vegetation Index, a satellite measure of how green and vigorous the crop is.
- NDWI
- Normalised Difference Water Index, a measure that highlights standing water.
- SAR (radar)
- Synthetic aperture radar, a satellite signal that works through cloud and in darkness.
- Smallholding
- A small farm, often under two hectares, typically worked largely by the farm family.
- Affiliate partner
- A person or business that shares a personal promo code and is linked to farmers who subscribe with it.
Case-study basis: the Farmonaut platform records for five accounts, covering July 2025 to August 2026, including field boundaries, crop settings, satellite and radar acquisition dates, weather records and subscription activity. Crops, regions, plot sizes and monitoring dates are reported from the accounts’ own records. The farmers and partners are not named and precise locations are withheld. The percentages shown for other growers are those growers’ own estimates from the in-app feedback form, as published in the corresponding Farmonaut customer case studies, and are not metered or independently audited. The savings calculator is illustrative arithmetic with editable placeholders, not a forecast. The average holding size refers to India’s Agriculture Census. Individual results vary with crop, weather, soil and management. Satellite indices describe crop condition and do not on their own diagnose a cause. Photographs and scene images in this article are AI-generated illustrations, labelled as such in their captions; they do not depict the farmers or their plots. The Farmonaut Satellite + AI Farm Monitoring System is a paid product.
Discussion
Questions, corrections or field experience? Share them below. First-time comments are reviewed before they appear, and your email is never published.
No comments yet. Be the first to add a question or your experience.

 Drift-Sense
 NWNS
NWNS Hydenmet
 Dirks Bros Farms
 Red August Group
 Farm Inc
 WeMe Global
 Agrotoken
 Blue BearX
 Insignito
 Croptimum
 DnCubed
 Field Capacity
 Indosistim Teknologi
 Liquify Digital
 CU Foods
 BeyondTech Global
 Rouge VC
