

Original research · Canadian exploration
Mineral Exploration Spending in Canada, by the Numbers
Mineral exploration spending Canada-wide reached C$4.40 billion in 2025 on preliminary NRCan figures, roughly double 2017’s C$2.19 billion, and companies plan C$5.34 billion for 2026, with juniors spending slightly more than seniors and gold taking about half of the total.
Key takeaways
- Canada-wide exploration and deposit appraisal spending went from C$2.19 billion in 2017 to C$4.40 billion in 2025 (preliminary); 2026 intentions are C$5.34 billion.
- Juniors spent C$2.27 billion in 2025 and plan C$2.91 billion in 2026; their year-to-year swings were almost twice as wide as seniors’ from 2017 to 2025.
- Ontario, Quebec and Saskatchewan took 62.5% of 2025 spending; juniors dominate in Yukon, the Northwest Territories and Saskatchewan, seniors in Ontario and Nunavut.
- Precious metals took 49.5% of 2025 spending and uranium 10.4%; about 3 dollars in 4 in Ontario and Nunavut went to precious metals.
- Drilling was 40.8% of 2024 spending, and the average cost per metre of diamond drilling rose from C$173 in 2017 to C$284 in 2024.
In this article
- Mineral exploration spending Canada-wide over a decade
- Junior vs senior companies: who carries Canadian exploration
- Mineral exploration spending Canada: province by province
- What commodities mineral exploration spending Canada-wide is chasing
- Where each dollar of mineral exploration spending Canada-wide goes
- Exploration vs deposit appraisal, on-mine vs off-mine
- What mineral exploration spending Canada data mean for a junior's budget
- Questions about mineral exploration spending Canada-wide
Every year Natural Resources Canada and the provinces survey every company exploring in the country and publish what they spent. The headline is easy to find. What is harder to find is the shape underneath it: which provinces depend on juniors, how much of each dollar goes into the ground as drill core, and how fast the cost of a metre has climbed. We downloaded NRCan’s open tables on mineral exploration spending Canada-wide, from 2017 to the 2026 intentions, and worked through them for this page. Every chart below plots official numbers or our arithmetic on them, and the script is saved so anyone can repeat it.
One note on method before the numbers. All the figures come from the NRCan mineral exploration statistics tables, which are built from the federal-provincial-territorial Survey of Mineral Exploration, Deposit Appraisal and Mine Complex Development Expenditures. Quebec’s data are compiled by the Institut de la statistique du Québec. The 2025 numbers are preliminary and 2026 numbers are spending intentions, collected between late 2025 and early 2026. Neither is final, and we flag them every time. The tables report aggregates only, and so do we. No company is named, ranked or singled out on this page.
If you are new to the stages these dollars pay for, our guide to the NRCan exploration bulletin is the official summary, and our own overview of mineral exploration stages, methods and costs sets out what happens in each phase.
Canada remains one of the world’s leading destinations for mineral exploration investment.” Natural Resources Canada, Canadian Mineral Exploration Information Bulletin, April 2026
Mineral exploration spending Canada-wide over a decade
Start with the long view. In 2017 companies spent C$2.19 billion on exploration and deposit appraisal across Canada. Spending held between C$2.19 billion and C$2.49 billion until 2020, then jumped 73% to C$3.78 billion in 2021, a rise NRCan’s April 2026 bulletin links to the rebound after pandemic disruptions. It peaked at C$4.43 billion in 2022, eased to C$4.21 billion in 2023 and held at C$4.23 billion in 2024.
The preliminary figure for 2025 is C$4.40 billion, up 4%. For 2026, companies told the survey they plan to spend C$5.34 billion, a 21% rise that would be a new record if it happens. Intentions are a forecast from the people holding the budgets. In some years they have come in close to the final number, and in others they have not, so we treat the 2026 figure as a signal of mood rather than a result.
Chart
Canadian exploration and deposit appraisal spending
All companies, all provinces and territories, C$ million, 2017 to 2026 (p = preliminary, i = intentions)
Two cautions apply to that doubling. First, these are current dollars. NRCan notes that the consumer price index rose 6.8% in 2022 and 3.9% in 2023, and that spending in constant 2006 dollars is still below its 2011 peak. Second, part of the rise is price, not activity. We return to that in the drilling section, where the cost of a metre tells the story more plainly than the total does.
The mineral exploration spending Canada reports also includes deposit appraisal, the costly later-stage work that turns a known deposit into a feasibility study. That matters when you compare Canada with surveys that count only early exploration. The infographic below shows where each phase begins and ends in NRCan’s definitions.
Infographic
Where exploration and deposit appraisal sit in a project’s life
- 1Grassroots explorationSearch for, discover and first delineate a deposit.
- 2Exit from explorationIndicated resources plus a positive PEA.
- 3Deposit appraisalDetailed work for pre-feasibility and feasibility.
- 4Production decisionFeasibility supports the investment call.
- 5Mine complex developmentConstruction, counted separately by NRCan.

▶ Documentary (10 min 44 s): how modern gold exploration, from satellites to drilling, is changing the hunt for new deposits, the trend behind half of Canada's exploration dollars. · 10:44
Junior vs senior companies: who carries Canadian exploration
NRCan splits the spending between junior and senior companies. In its words, juniors usually have no operating revenue and rely on equity financing, while seniors, the producers, are more likely to bring a mine into production. The split has been close to even for a decade. Juniors spent 49.2% of the total in 2017, fell to 41.9% in 2019, then rose to 55.8% in 2021 as equity money poured in.
In 2024 juniors spent C$2.11 billion and seniors C$2.12 billion, a 49.9% junior share. Preliminary 2025 numbers put juniors at C$2.27 billion (51.5%), and 2026 intentions at C$2.91 billion (54.5%), which would be the highest junior figure in the series. Seniors plan C$2.43 billion for 2026.
Mineral exploration spending Canada’s juniors report swings twice as hard
We measured how much each group’s spending moves from one year to the next. Between 2017 and 2025 the standard deviation of juniors’ annual percentage change was 33.3 points. For seniors it was 18.5 points. The single biggest move was juniors’ 97% jump in 2021. Juniors also fell 14.7% in 2019 and 14.2% in 2023, years when seniors moved far less (down 2.5% and up 6.7%).
For a junior’s board, this is the practical point. Junior spending tracks the financing window, not the geology. A program planned when money is easy may have to be cut in half the next year. Seniors pay from operating cash flow and move more slowly in both directions.
Where juniors lead mineral exploration spending Canada-wide, and where seniors do
The national split hides very different provinces. In 2024 juniors spent 80.5% of the money in Yukon and 81.7% in the Northwest Territories. In Saskatchewan the junior share was 70.6%, largely uranium explorers in the Athabasca region. British Columbia was 62.6% junior and Quebec 56.2%.
At the other end, seniors carried Ontario (65.2% senior, 34.8% junior), Manitoba (78.9% senior) and Nunavut (80.1% senior). Ontario’s own exploration statistics page shows the same pattern for 2025: C$328 million junior and C$752 million senior, out of C$1,080 million. In those provinces, much of the work happens around operating mines and large advanced projects.
Chart
Junior companies’ share of spending, by province
Juniors’ share of exploration and deposit appraisal spending (%), 2024 actual vs 2026 intentions
The 2026 intentions shift the picture. Ontario’s junior share rises to 42.3% because seniors there plan to spend less (C$576 million against C$752 million in 2025). Saskatchewan’s junior share rises to 80.1%. British Columbia moves the other way, to 52.9% junior, because seniors plan to almost double their spending there, from C$251.9 million to C$486.5 million.

▶ Video (3 min 11 s): satellite, soil and geochemical data combined to look for copper and gold in British Columbia, a province where juniors spent most of the 2024 budget. · 3:11
Mineral exploration spending Canada: province by province
Three provinces took 62.5% of the 2025 preliminary total: Ontario (C$1,080.3 million, 24.6%), Quebec (C$955.4 million, 21.7%) and Saskatchewan (C$710.9 million, 16.2%). British Columbia followed with C$662.1 million. In 2026 intentions the order changes. Quebec leads at C$1,161.8 million, British Columbia is second at C$1,032.7 million, Ontario third at C$998.9 million and Saskatchewan fourth at C$822.5 million.
| Province or territory | 2017 (C$M) | 2024 (C$M) | 2025p (C$M) | 2026i (C$M) | Share 2025p |
|---|---|---|---|---|---|
| Newfoundland and Labrador | 41.5 | 226.1 | 248.8 | 283.3 | 5.7% |
| Nova Scotia | 18.2 | 21.1 | 31.6 | 68.6 | 0.7% |
| New Brunswick | 15.8 | 16.0 | 25.0 | 32.4 | 0.6% |
| Quebec | 573.9 | 890.4 | 955.4 | 1,161.8 | 21.7% |
| Ontario | 539.7 | 1,085.5 | 1,080.3 | 998.9 | 24.6% |
| Manitoba | 41.1 | 149.2 | 110.7 | 157.9 | 2.5% |
| Saskatchewan | 191.2 | 548.4 | 710.9 | 822.5 | 16.2% |
| Alberta | 24.6 | 57.2 | 44.2 | 108.7 | 1.0% |
| British Columbia | 302.6 | 746.9 | 662.1 | 1,032.7 | 15.0% |
| Yukon | 168.7 | 162.9 | 241.7 | 322.9 | 5.5% |
| Northwest Territories | 91.2 | 92.3 | 79.8 | 85.6 | 1.8% |
| Nunavut | 177.0 | 232.8 | 210.1 | 267.7 | 4.8% |
Table: mineral exploration spending Canada-wide by province and territory, including deposit appraisal. p = preliminary, i = intentions. Source: Farmonaut analysis of NRCan table b (percentage of total spending); Prince Edward Island has no reported activity.
Growth since 2017 has been uneven. Saskatchewan’s spending rose 272% from C$191.2 million to C$710.9 million, Newfoundland and Labrador’s rose about 500% from a small base, and British Columbia’s rose 119%. Ontario doubled. Yukon rose 43% and Nunavut 19%. The Northwest Territories fell 13%, the only jurisdiction lower in 2025 than in 2017.
Two surveys, two numbers for British Columbia
Readers in British Columbia will notice a gap. The BC Geological Survey’s Mining and Exploration in British Columbia, 2025 puts the province’s exploration spending at C$750.9 million, a record. NRCan’s preliminary figure for British Columbia is C$662.1 million. The BC figure comes from a separate survey run with the Association for Mineral Exploration and EY, and the two use different methods and timing. Neither is wrong. Quote one, name it, and do not mix them in one chart.
▶ Video (2 min 53 s): Ontario's place in Canadian gold, the province that led spending in 2024 and 2025. · 2:53
What commodities mineral exploration spending Canada-wide is chasing
Precious metals, mostly gold, took C$2,179.2 million in 2025, or 49.5% of mineral exploration spending Canada-wide. That is up from 46.1% in 2024. NRCan ties the rise to record gold prices. Base metals were second at C$1,174.4 million (26.7%), uranium third at C$458.3 million (10.4%) and other metals, including lithium, cobalt and rare earths, fourth at C$388.6 million (8.8%).
Each commodity has its own cycle. Uranium spending rose every year from C$66.8 million in 2020 to C$458.3 million in 2025, and companies plan C$737.0 million for 2026. Other metals surged to C$616.3 million in 2023 with the lithium boom, then dropped to C$388.6 million in 2025 as lithium prices fell. Diamond exploration shrank from C$127.0 million in 2019 to C$6.8 million in 2025.
Gold’s share of mineral exploration spending Canada-wide varies by province
We divided each province’s precious-metals spending by its total for 2025. Nunavut was the most gold-focused at 79.8%, then Ontario at 75.5% and Nova Scotia at 73.1%. British Columbia (55.8%), Yukon (53.9%) and Quebec (50.4%) sat close to the national average. Saskatchewan was the outlier at 3.7%, because 58.6% of its spending went to uranium.
Chart
How much of each province’s spending targets precious metals
Precious metals (mainly gold) as a share of 2025 preliminary spending (%)
For a land manager this is a quick read on competition. In a gold-led jurisdiction your copper or nickel project may be competing for drill rigs and crews with gold programs, but less so for claims in the same ground. Ontario’s own figures agree: the province reports C$807 million of gold exploration spending in 2025, 75% of its total.

▶ Video (2 min 25 s): how satellite screening and new field methods are being applied to Canadian critical-mineral exploration. · 2:25
Where each dollar of mineral exploration spending Canada-wide goes
NRCan’s expenditure-category table breaks 2024 spending into ten lines. Drilling took 40.8% (C$1,723.7 million, almost all diamond drilling). Engineering, economic and feasibility studies took 13.5%, geochemistry and geology 10.9%, other field costs 10.2%, mineral leases, claims, line cutting and head office 7.6%, rock work 7.0%, environment 5.4%, geophysics 3.4% and land access 1.1%.
Read that list as a national average. It includes deposit appraisal on advanced projects, where feasibility studies and environment work weigh heavily. A grassroots program on fresh claims looks very different, with more geology, geochemistry and geophysics and little or no engineering. Still, it is the best open benchmark for how mineral exploration spending Canada-wide is split across tasks.
Calculator
How would the national spending mix split your season budget?
Enter a budget and a drilling share. Amounts in Canadian dollars (C$).
- Geology, geochemistry, geophysics (C$): $358,105
- Engineering and feasibility studies (C$): $338,071
- Other field costs and rock work (C$): $430,728
- Claims, leases, line cutting, head office (C$): $190,321
- Environment and land access (C$): $162,775
Shares are Canada-wide 2024 actuals from NRCan’s expenditure-category table: drilling 40.8%, geochemistry and geology 10.9%, geophysics 3.4%, engineering and feasibility studies 13.5%, other field costs 10.2%, rock work 7.0%, mineral leases, claims, line cutting and head office 7.6%, environment 5.4%, land access 1.1%. If you change the drilling share, the other categories are scaled so the total still adds up. A grassroots program will spend far less on feasibility studies than this national average, which includes deposit appraisal. All amounts in Canadian dollars (C$).
Drilling’s share of mineral exploration spending Canada-wide: the cost of a metre
The same table reports metres drilled alongside cost. Dividing one by the other gives an average all-in cost per metre of diamond drilling. In 2017 it was C$173. It reached C$258 in 2022, peaked at C$288 in 2023 and was C$284 in 2024, a 64% rise over seven years.
Chart
Average cost per metre of diamond drilling in Canada
C$ per metre, surface and underground, 2017 to 2024 (actuals)
That rise explains part of the spending boom. Companies drilled 7.65 million metres in 2021 and 5.96 million in 2024, a 22% drop in metres, yet drilling spending rose from C$1,654.8 million to C$1,690.5 million. More dollars bought fewer metres.
Provinces differ widely. In 2024 the average was about C$208 per metre in Ontario, C$295 in Quebec, C$364 in British Columbia, C$383 in Saskatchewan and C$537 in Yukon. Remote ground, helicopter support, short seasons and deeper holes all push the number up. Our drilling guide covers diamond drilling costs per metre in more detail.
Calculator
How many metres of drilling does your budget buy?
Enter a budget, a cost per metre and a hole length. Amounts in Canadian dollars (C$).
- Holes at that length: 14
- Metres at the 2017 average of C$173/m: 5,780
The default rate is our division of NRCan’s 2024 diamond-drilling cost (C$1,690.5 million) by metres drilled (5.959 million m), surface and underground, all provinces; the 2017 figure, C$173 per metre, is the same calculation (C$896.0 million over 5.171 million m). Provincial 2024 averages run from about C$208/m (Ontario) to C$537/m (Yukon). These are averages of what companies reported, not contractor quotes. All amounts in Canadian dollars (C$). Use your own quote when you have one.
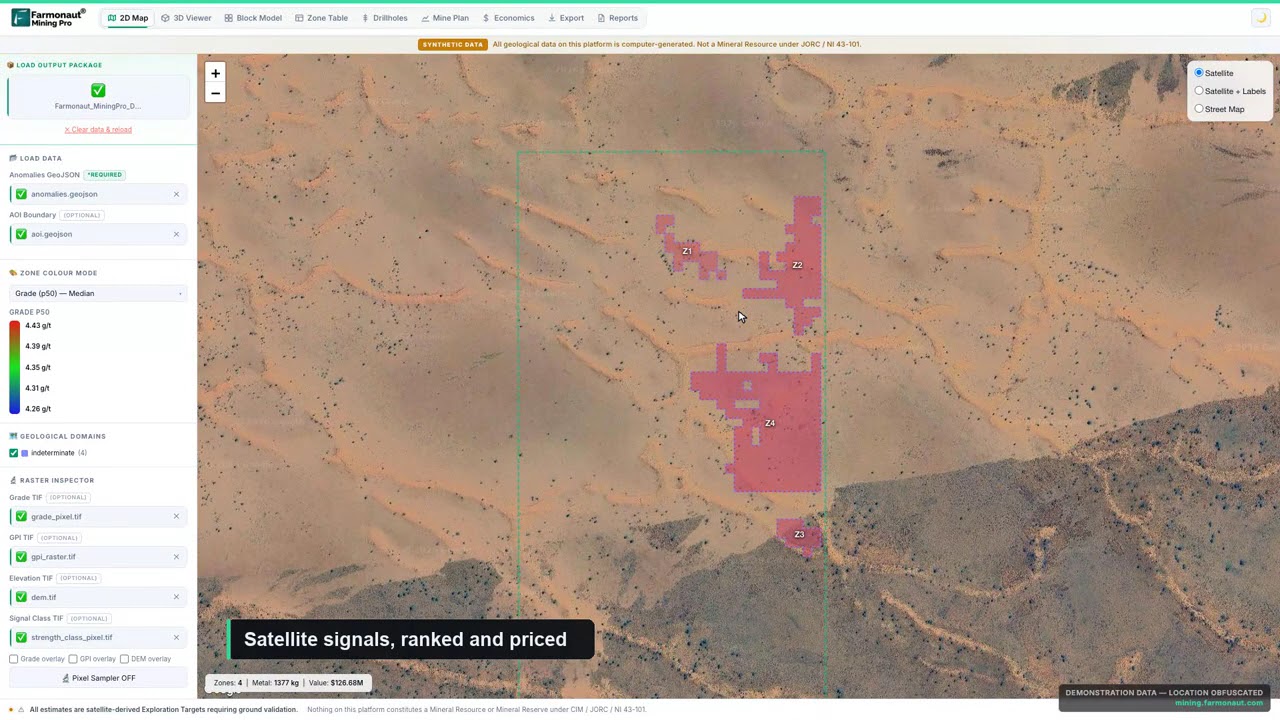
▶ Video (4 min 26 s): what satellite exploration software does before the first drill rig is booked, and who uses it. · 4:26
Exploration vs deposit appraisal, on-mine vs off-mine
Deposit appraisal is a bigger share of spending than it used to be. It was 29.6% of the total in 2017 and 37.2% in 2025, when it reached C$1,635.2 million. NRCan reports that deposit appraisal rose C$215 million in 2025, led by Saskatchewan and Newfoundland and Labrador, while grassroots and early exploration slipped. The 2026 intentions put appraisal back at 34.5% as exploration budgets rise faster.
Work at operating mines has grown too. On-mine-site exploration and appraisal was C$150.2 million in 2017, 6.9% of the total. By 2025 it was C$677.2 million, 15.4%. Producers are spending more to extend the life of mines they already run, which shows up in Ontario and British Columbia in NRCan’s commentary.
For a junior, these two trends mean the same thing. A larger part of the mineral exploration spending Canada records each year is being spent on known deposits and existing mines. The share left for new discoveries on fresh ground is smaller than the headline suggests: off-mine exploration was C$2.24 billion in 2025, down C$119 million on 2024, according to NRCan.
What mineral exploration spending Canada data mean for a junior’s budget
Put the tables together and four practical points come out. First, money is plentiful in 2026 plans, especially for gold and uranium, but junior budgets swing hard with financing. Plan a program that still makes sense at half the size. Second, drilling costs per metre are about 64% higher than in 2017, so the same raise buys fewer metres. Third, competition for crews and rigs is highest in gold-led provinces. Fourth, appraisal and mine-site work are taking a growing share of the national total.
All four points argue for spending the first dollars well. Desk work is cheap compared with drilling. NRCan’s table shows geophysics, geology and geochemistry together at 14.3% of 2024 spending, against 40.8% for drilling. Anything that narrows where the holes go, before the rig arrives, saves money at the most expensive stage.
That is where we fit. Farmonaut’s satellite-based mineral detection reads multispectral and hyperspectral data to flag alteration zones, structures and target areas, and delivers a report with georeferenced GIS files in 5 to 20 business days. Our clients send an area as coordinates, KML/KMZ or a polygon. We have scanned more than 100,000 hectares for over 20 mineral types in more than 25 countries, and we describe early-exploration cost savings of up to 80 to 85% compared with ground-first programs. Results are exploration targets ahead of any resource estimate, and they guide fieldwork rather than replace it.
To try it on your own ground, Map Your Mining Site at mining.farmonaut.com, or get a quote for a full report. The Premium+ report adds TargetMax drilling intelligence, with suggested drilling angles and 3D subsurface models, for teams that are close to booking a rig.

▶ Video (2 min 47 s): how geophysics, hyperspectral imagery and lidar are combined to rank zones on a British Columbia gold property before drilling. · 2:47
Gold remains the leading exploration target in Canada.” Natural Resources Canada, April 2026 bulletin
How we analysed mineral exploration spending Canada data
We downloaded NRCan’s eight exploration tables as CSV files on 15 October 2026, from the company-type table to the expenditure-category table, along with the bulletin and the survey definitions page. A Python script reads them and writes the result tables. Shares, growth rates, standard deviations and cost per metre are our arithmetic. Where a cell is suppressed for confidentiality (shown as “…” in NRCan’s tables), we left it blank and did not compute a share. Numbers may not add to totals because of rounding in the source. The files and scripts are kept with this study.
Limits are worth stating plainly. The survey counts what companies report, and some small explorers may be missed. The junior and senior labels come from NRCan’s classification, not ours. Cost per metre mixes surface and underground holes and whatever costs each company booked to drilling. And 2025 and 2026 figures will be revised.
Questions about mineral exploration spending Canada-wide
How much is spent on mineral exploration in Canada?
Natural Resources Canada puts mineral exploration spending Canada-wide, including deposit appraisal, at C$4.40 billion in 2025 (preliminary) and C$4.23 billion in 2024. Companies plan C$5.34 billion for 2026. These figures include deposit appraisal, not just early exploration.
Which province spends the most on mineral exploration?
Ontario led mineral exploration spending Canada-wide in 2024 (C$1,085.5 million) and in 2025 preliminary data (C$1,080.3 million). For 2026, Quebec has the largest planned spending at C$1,161.8 million, followed by British Columbia and Ontario.
How much do junior mining companies spend on exploration in Canada?
Juniors spent C$2.11 billion in 2024 and C$2.27 billion in 2025 on preliminary figures, about half of mineral exploration spending Canada-wide. Their 2026 intentions are C$2.91 billion, which would be the highest in NRCan’s series.
What is the difference between exploration and deposit appraisal?
In NRCan’s survey, exploration covers the search for a deposit up to the point where it has enough indicated resources and a positive preliminary economic assessment. Deposit appraisal is the detailed work after that, leading to pre-feasibility and feasibility studies.
What mineral gets the most exploration spending in Canada?
Gold. Precious metals took 49.5% of 2025 preliminary spending (C$2,179.2 million). Base metals were 26.7% and uranium 10.4%.
How much does exploration drilling cost per metre in Canada?
Dividing NRCan’s 2024 diamond-drilling cost by metres drilled gives an average of about C$284 per metre across Canada, up from C$173 in 2017. Provincial averages ranged from about C$208 in Ontario to C$537 in Yukon. These are averages, not quotes.
Is mineral exploration spending Canada-wide going up?
Yes, on current plans. Spending rose 4% in 2025 on preliminary data, and 2026 intentions point to a 21% rise. In constant dollars, NRCan says spending is still below its 2011 peak.
Where does NRCan get its exploration spending data?
From the federal-provincial-territorial Survey of Mineral Exploration, Deposit Appraisal and Mine Complex Development Expenditures. Quebec’s data are compiled by the Institut de la statistique du Québec. The tables are published on NRCan’s mineral exploration statistics site.
Why are British Columbia’s exploration figures different in different reports?
The BC Geological Survey publishes its own estimate (C$750.9 million for 2025) from a survey run with AME and EY, while NRCan’s preliminary figure is C$662.1 million. They use different methods and timing, so quote one source at a time.
What share of Canadian exploration budgets goes to drilling?
About 40.8% of mineral exploration spending Canada-wide in 2024, the largest single category. Engineering and feasibility studies took 13.5%, geochemistry and geology 10.9%, and geophysics 3.4%.
General information, not investment, tax or legal advice. Figures for 2025 are preliminary and 2026 figures are spending intentions; check NRCan for revised numbers. Farmonaut results are exploration targets, not resources or reserves.
Farmonaut mineral detection
Map your mining site from space
Send your claim or licence boundary as KML, KMZ or a polygon. Farmonaut returns ranked satellite exploration targets for it, usually in 5 to 20 business days.

Keep reading
Sources
- Natural Resources Canada, Canadian Mineral Exploration Information Bulletin (April 2026): natural-resources.canada.ca
- Natural Resources Canada, Mineral exploration statistics, data tables (2026): mmsd.nrcan-rncan.gc.ca
- NRCan, Exploration and deposit appraisal, Canadian totals by commodity (CSV, 2026): mmsd.nrcan-rncan.gc.ca
- NRCan, Exploration and deposit appraisal by province, percentage of total (CSV, 2026): mmsd.nrcan-rncan.gc.ca
- NRCan, Exploration and deposit appraisal by company type (CSV, 2026): mmsd.nrcan-rncan.gc.ca
- NRCan, Exploration and deposit appraisal by work phase (CSV, 2026): mmsd.nrcan-rncan.gc.ca
- NRCan, Exploration and deposit appraisal by commodity and province (CSV, 2026): mmsd.nrcan-rncan.gc.ca
- NRCan, Exploration and deposit appraisal by expenditure category (CSV, 2015-2024): mmsd.nrcan-rncan.gc.ca
- NRCan, Total mineral resource development by expenditure category (CSV, 2026): mmsd.nrcan-rncan.gc.ca
- NRCan, Mineral exploration survey definitions and methodology: mmsd.nrcan-rncan.gc.ca
- Government of Ontario, Mineral exploration and production values and commodities (2026): ontario.ca
- British Columbia Geological Survey, Paper 2026-02, Mining and Exploration in British Columbia, 2025: cmscontent.nrs.gov.bc.ca
- Justice Laws Website, Income Tax Act, section 66.1: laws-lois.justice.gc.ca
- Institut de la statistique du Québec: statistique.quebec.ca
Discussion
Questions, corrections or field experience? Share them below. First-time comments are reviewed before they appear, and your email is never published.
No comments yet. Be the first to add a question or your experience.

 Geotech Mining Solutions plc
 Vulcan International Limited
 Kidepo Associates
 GKY Mining
 Alkimy SARL
 Double A Trading
 GemSprout Metals Limited
 Qader Group
 Ileys General Trading
 SG Gold Mining LLC
 VRV Global Pte Ltd
 Omsri International FZE
 G.I.T.T.
 Jaunita Erss Ltd
 Almosi SARL
 SRK Consulting
 Berks Gold Limited
 Mwerezi Minerals Company Limited
 Mining SARL
 SenGold Invest SAS
