

Customer case study · Planted pine
Pine Plantation Monitoring: A North Carolina Case Study
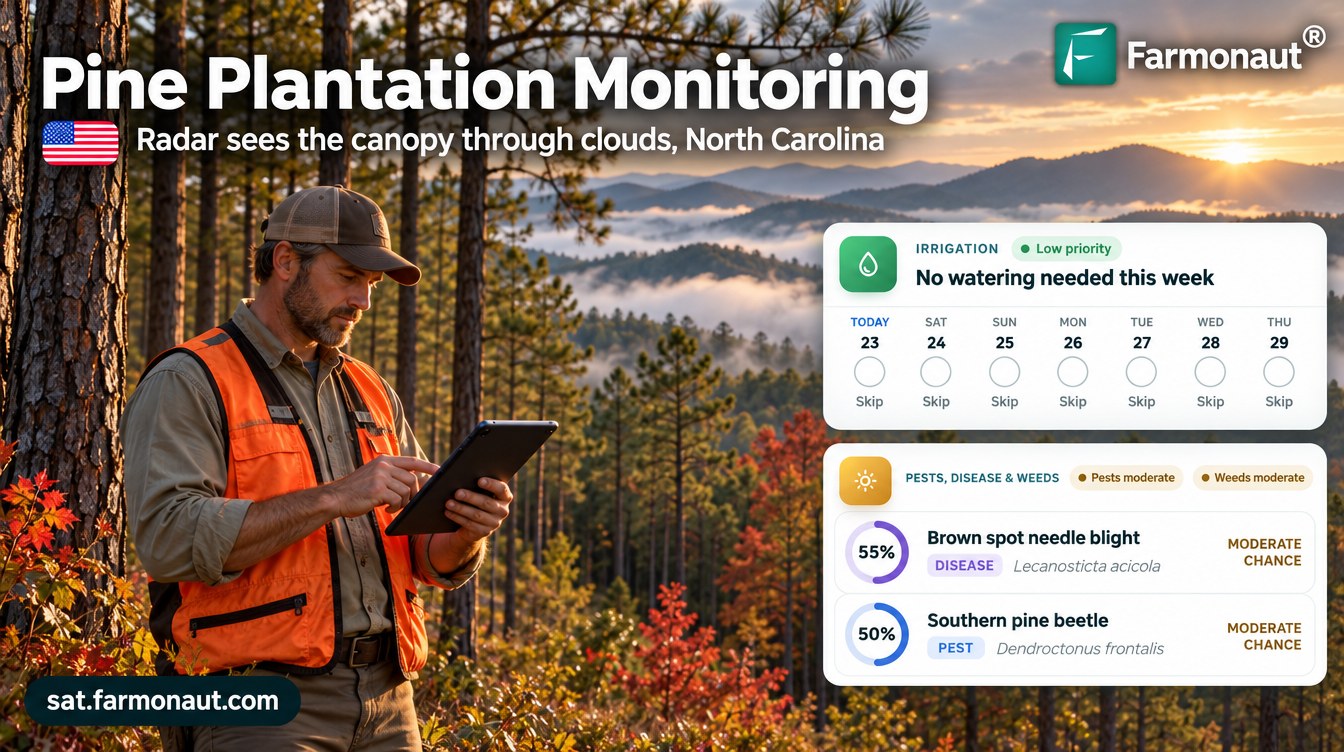
Pine plantation monitoring in North Carolina’s Blue Ridge: when cloud pulled a stand’s NDVI from 0.81 to 0.40, radar showed the canopy was still intact. The advisories scored southern pine beetle at 45% to 90% and pointed the owner to needle disease and root rot on the next walk.
Key takeaways
- A landowner in western North Carolina received 33 satellite advisories for three pine stands (13.6 acres) from late July to late October 2026.
- When the largest stand’s NDVI fell from 0.81 to 0.40 in October, its radar index stayed flat at 0.77 to 0.78, and NDVI was back at 0.57 by 22 October.
- Six advisories came from radar alone on cloudy dates.
- Southern pine beetle scores ranged from 45% to 90%; bark beetle risk peaked in August and needle diseases rose again in October.
- Water plans were rain-fed on 65% of stand-days and on 31 of 32 days for the mature stand.
In this article
- The stands and the brief
- Why pine health matters in North Carolina
- How pine plantation monitoring works through cloud
- What radar showed when the optical picture dipped
- A season of advisories, stand by stand
- Pest and disease risk by stage
- Water: mostly rain-fed
- Nutrition and soil
- What forest owners can take from pine plantation monitoring
- FAQ
Pine plantation monitoring by satellite gave a landowner in North Carolina’s Blue Ridge Mountains a fresh read on three pine stands every few days, even when cloud hid them from the camera. In early October the optical greenness index (NDVI) on the largest stand fell from 0.81 to 0.40, but the radar index stayed flat at 0.77 to 0.78, so the canopy was still standing. NDVI was back at 0.57 by 22 October. Across the season the advisories scored southern pine beetle risk between 45% and 90% and flagged needle diseases and root rot as the main things to scout for.
This case study walks through 33 advisories sent for three pine stands, 13.6 acres (5.5 ha) in total, from late July to late October 2026. It shows what the satellites saw, how radar settled a cloudy reading, and what each advisory asked the owner to check. All figures come from the advisory records. Risk scores are modelled probabilities, not confirmed outbreaks, and water figures are planned amounts, not metered use.
The stands and the brief
The landowner has three planted pine stands on mountain land in western North Carolina. The largest stand is a 2009 plantation of about 11.7 acres (4.7 ha). The other two are small: a stand planted in 2012 of about 0.9 acres (0.36 ha) and a young stand planted in 2022 of about 1 acre (0.4 ha). The two small stands were drawn in the Farmonaut app in late July 2026 and the large one in late September.
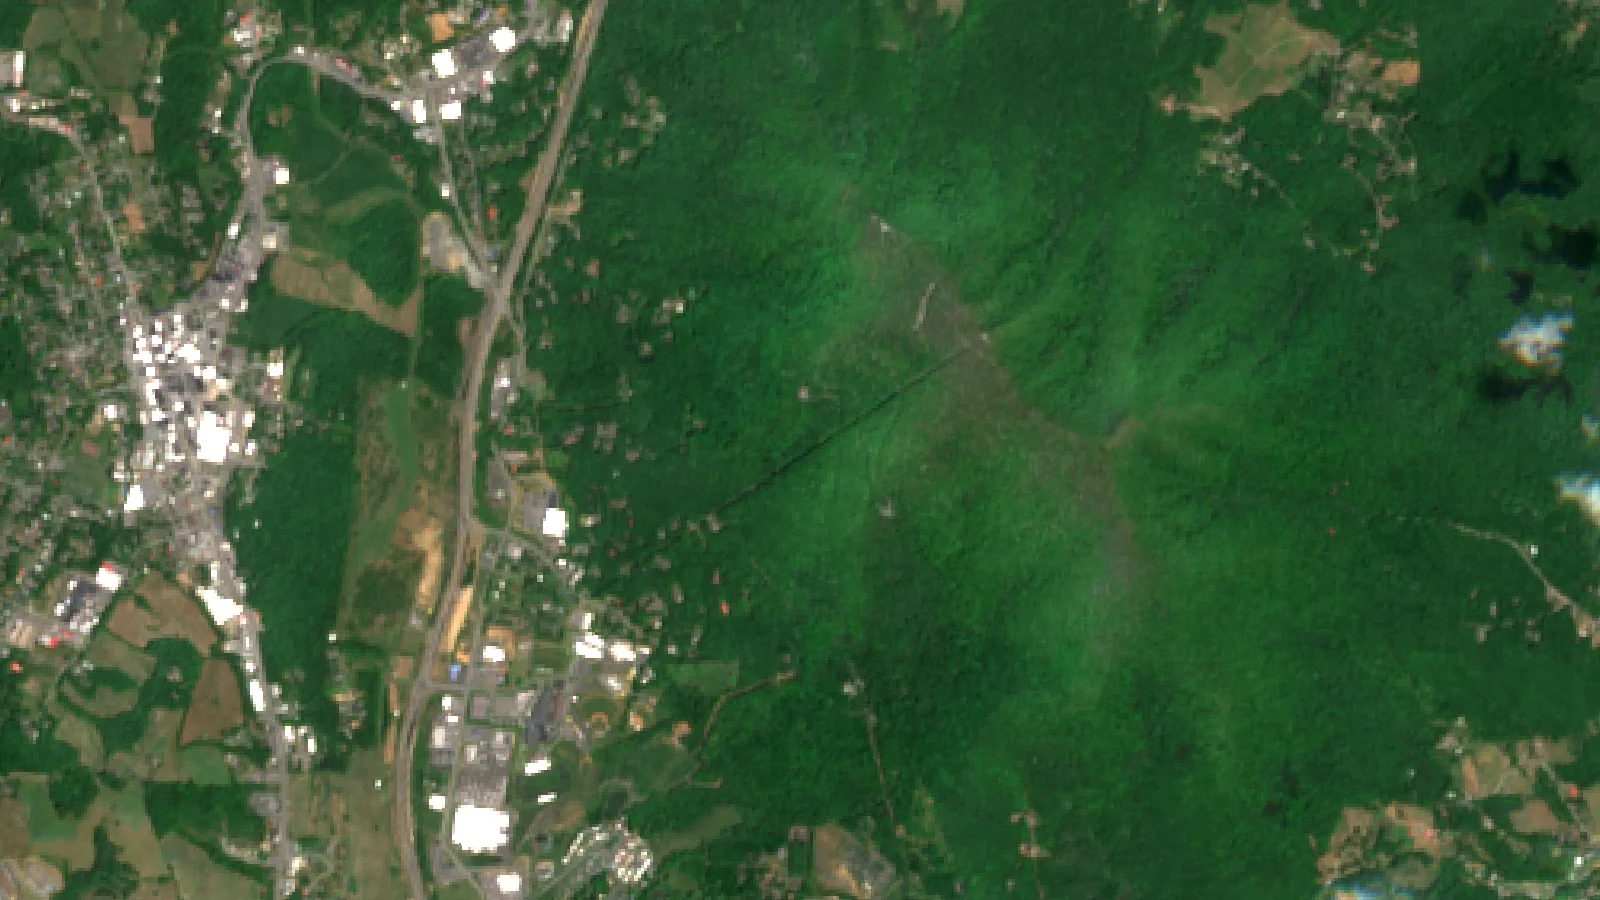
Where the pine stands are
North Carolina shaded; marker shows the approximate area only
A timber stand does not need a daily plan the way a vegetable crop does. What a forest owner needs is early warning: which stand looks stressed, whether a drop in greenness is real, and which pest or disease to look for on the next walk. In the mountains that job is harder because low cloud and fog often hide the canopy from optical satellites in autumn.
| Item | Detail |
|---|---|
| Region | Blue Ridge Mountains, western North Carolina, US |
| Crop | Planted pine (timber) |
| Stands | 3 stands, about 13.6 acres (5.5 ha) in total |
| Stand ages | Planted 2009, 2012 and 2022 |
| Water | Rain-fed; drip only suggested for the two small stands in summer |
| Monitoring period | 29 July to 22 October 2026 |
| Advisories | 33 in total: 27 from optical images, 6 from radar |
| Soil (modelled) | pH 5.2 to 6.0, low salinity, organic carbon rated low |
Why pine health matters in North Carolina
Pine is a large part of North Carolina’s working forest. The USDA Forest Service’s Forest Inventory and Analysis snapshot for 2023 puts the state’s timberland at 17.85 million acres. The loblolly and shortleaf pine group covers 32.8% of forest land, about 6.1 million acres, and loblolly pine alone holds 26.6% of the state’s live tree volume.
Chart
North Carolina forest land by forest-type group
Million acres, three largest groups, 2023
The same snapshot lists insects as the most common forest disturbance, at about 114,600 acres a year, just ahead of flooding and fire. For pine, the insect that matters most is the southern pine beetle. The N.C. Forest Service calls it the most destructive forest insect in North Carolina. Its 2025 forest health report says a four-year outbreak from 1999 to 2002 cost the state’s timber industry nearly $84 million, and that activity has stayed relatively low since then.
Low activity is the time to watch, not to relax. In most years the beetle is a secondary pest that attacks stressed trees, so a stand that is stressed by wet roots, needle disease or crowding is the one to check first. In western North Carolina the forest service also reports eastern white pine dieback linked to white pine bast scale and Caliciopsis canker, seen across much of the region.
How pine plantation monitoring works through cloud
Each advisory starts with fresh satellite data for the stand. The Sentinel-2 satellites carry a camera with a revisit time of five days from the two-satellite constellation and 10-metre detail in the visible and near-infrared bands. From those bands the system works out NDVI, which compares visible and near-infrared light reflected by the land surface to show how much green leaf is present.

▶ Why radar satellites can see the ground through cloud · 2:37
Infographic
How each stand advisory is built in 4 steps
- 1Satellite passSentinel-2 images each stand every few days; Sentinel-1 radar covers cloudy dates.
- 2Read the canopyNDVI shows greenness; radar RVI and soil moisture show structure and wetness.
- 3Add stage and weatherStand age, growth stage and the weather outlook set risk and water need.
- 4Stand planPest and disease scores, weed risk, water plan, nutrients with organic options.
A camera cannot see through cloud, and mountain autumns are cloudy. That is where radar comes in. Sentinel-1 carries a synthetic aperture radar that works day and night and can acquire imagery regardless of the weather. From the radar signal the system builds a radar vegetation index (RVI), which tracks the bulk and structure of the canopy, and a radar soil moisture index (RSM). For a deeper look at the physics, see our guide on how satellites see through clouds.
In this case study, 6 of the 33 advisories were built from radar alone on dates when cloud blocked the camera. On optical dates the radar indices were still used as a cross-check. Each advisory then adds the stand’s age and growth stage and the weather outlook, and returns five parts: a water plan, pest and disease risk scores, weed risk, a fertilizer plan with organic options, and soil notes.
What radar showed when the optical picture dipped
The clearest test came on the 11.7-acre stand in October. On 27 September its NDVI read 0.81, inside the healthy range the advisory set for a mature stand. Five days later it was 0.54, and on 7 October it was 0.40. A drop like that can mean needle loss, a thinning cut or a beetle spot. It can also mean cloud, haze or shadow in the image.
Chart
NDVI on the 11.7-acre stand, autumn readings
Optical NDVI; radar RVI held at 0.77 to 0.78 over the same dates
The radar answered the question. Over the same dates the stand’s RVI stayed flat at 0.77 to 0.78, and radar soil moisture held at 0.78 to 0.80. The advisories concluded that the canopy structure was intact and that the optical drop was most likely cloud, haze or seasonal change in the needles, while still asking the owner to scout for crown thinning and resin on the bark. By 22 October NDVI had recovered to 0.57, back inside the band the advisory expected for a pine stand going into winter dormancy.
The canopy water index (NDWI) told a similar story. It fell from 0.71 to 0.22 on 12 October and was back at 0.43 by 22 October. A short dip and recovery like this is a reason to look, not a reason to cut.
Radar also caught a real change. On the 2012 stand, a radar advisory on 12 September showed RVI falling from 0.82 to 0.66, below the range expected at canopy closure. The advisory pointed the owner to localized canopy gaps and scored needle cast at 70% and bark beetles at 75%, so the next walk had a clear target.
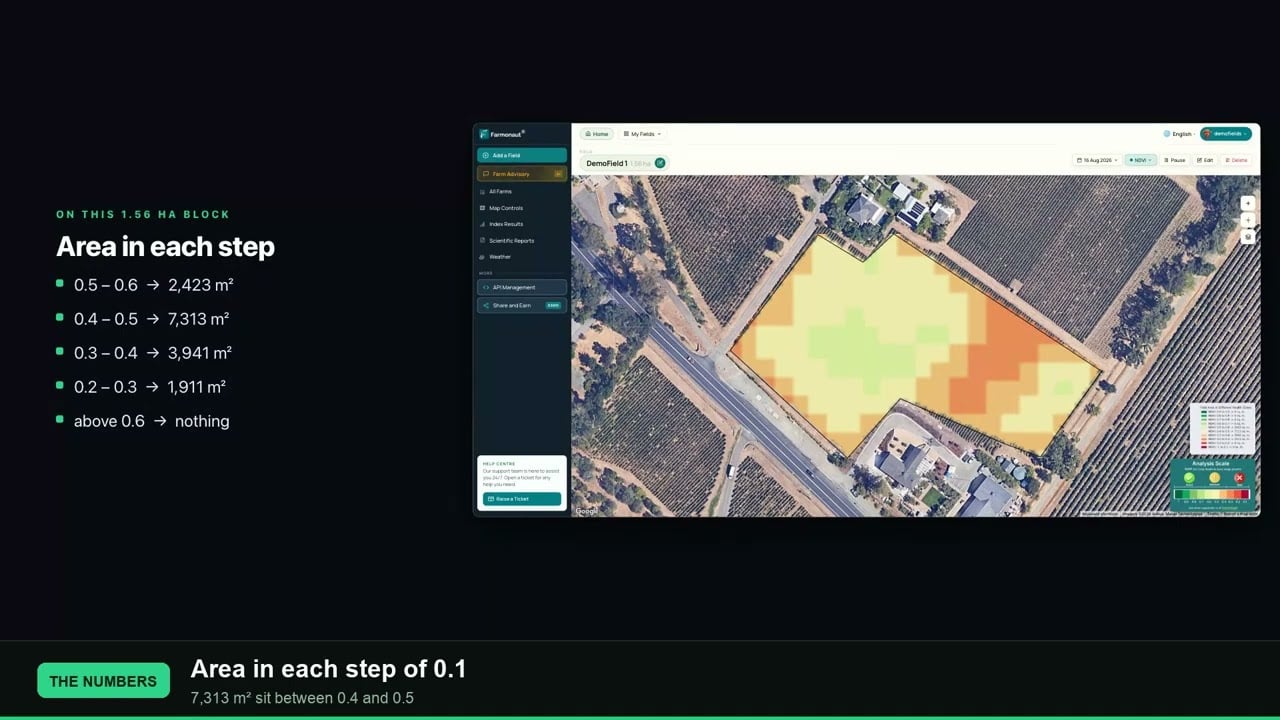
▶ What NDVI values from -1 to +1 mean on a real field · 2:33
A season of advisories, stand by stand
Each stand received its own advisory about every five days, and the growth stage in each one followed the stand’s age and the time of year. Where a single advisory gave an out-of-place stage label, we left it out of the table below.
| Period | Stand and main stage | What the advisories focused on |
|---|---|---|
| Late Jul to Aug | 2022 stand: sapling growth | White pine weevil on new leaders, wet-soil root rot |
| Aug to mid Sep | 2012 stand: canopy closure, pole stage | Bark beetles, needle cast, pine needle scale |
| Late Sep | 2009 stand: mature stand | Baseline NDVI 0.81, beetle and root rot watch |
| Early Oct | 2009 stand: needle hardening | NDVI dip checked against flat radar readings |
| Mid to late Oct | 2009 stand: bud set, dormancy | Needle blights, pales weevil, weed control in gaps |
The small stands showed the same pattern of optical dips and quick recoveries in August. The 2022 stand’s NDVI read 0.30 on 8 August and 0.75 ten days later. Because each reading came with radar and moisture data, the advisories treated single low readings with care and raised scouting priority rather than calling a loss.
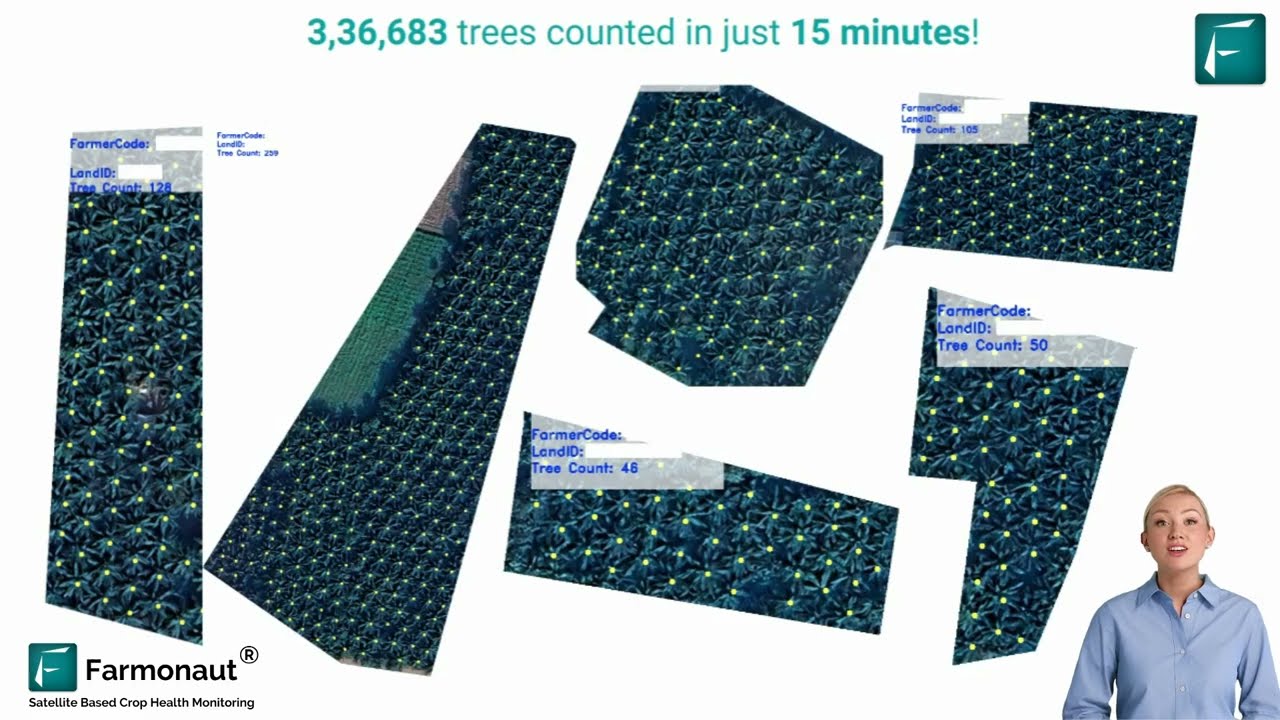
▶ Satellite and AI tree detection for counting and mapping trees · 4:05
Pest and disease risk by stage
The 33 advisories gave 132 pest and disease scores. Each score is a modelled probability built from the stand’s canopy, moisture and stage data, and it tells the owner where and when to look first. The monthly averages below group related threats.
Chart
Modelled risk by month, three pine stands
Average risk score by month, %, 2026
Bark beetle scores were highest in August, during warm weather, and eased in September. Root rot scores followed the wet soils that radar recorded through August. Needle disease scores rose again in October as autumn fog and leaf wetness set in.
Southern pine beetle and other bark beetles
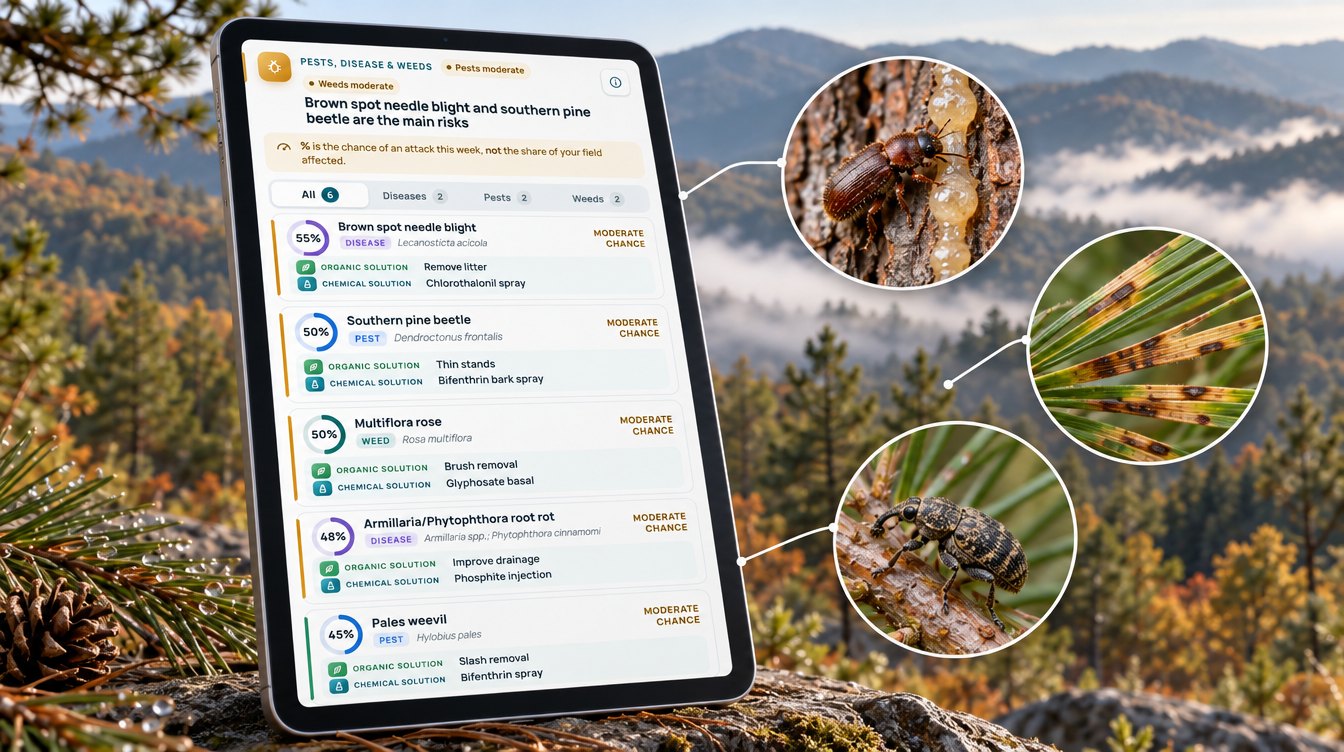
Southern pine beetle scores ranged from 45% to 90% across the season, and the wider bark beetle group, including Ips engravers, averaged 77% in August. NC State Extension notes that these beetles primarily attack pines stressed by another agent such as drought or disease, and that thinning overstocked pine stands is the best way to prevent an outbreak. The organic option in the advisories was the same: thin dense stands and remove slash. NC State also lists the signs to look for, including needles that fade from green to yellow to red and pitch tubes on the bark. If you find an active spot, the standard practice is to cut infested trees in addition to a buffer of green trees. Always follow the product label and local rules for any bark spray.
Needle cast and brown spot needle blight
Needle diseases (needle cast, needle blights and tip blight) averaged 67% in August, 48% in September and 60% in October. On the latest advisory for the large stand, brown spot needle blight was the top threat at 55%. Penn State Extension describes Lophodermium needlecast as needles on lower branches turning completely brown and falling from March through May the year after infection, and it advises spacing trees and controlling weeds for good air circulation. A score in autumn is a cue to note which parts of the stand to recheck in spring.
White pine weevil and root rots
White pine weevil scores averaged 74% in August and ran highest on the young 2022 stand, at 80% to 85%, where the advisories pointed to its new leaders. Root rot scores averaged 71% in August, when radar soil moisture often read above 0.8. The advisories paired these scores with drainage advice for wet spots and slash removal after any cut.
Water: mostly rain-fed
Most pine stands in the Blue Ridge never see an irrigation line, and the advisories agreed. At the NOAA cooperative station Boone 1 SE, the 1991–2020 normals give 59.13 inches (about 1,500 mm) of precipitation a year, with 5.56 inches in August, 5.73 inches in September and 4.69 inches in October.
Chart
Normal rainfall vs planned water per stand
Inches per month; NOAA 1991–2020 normals vs advisory plan, 2026
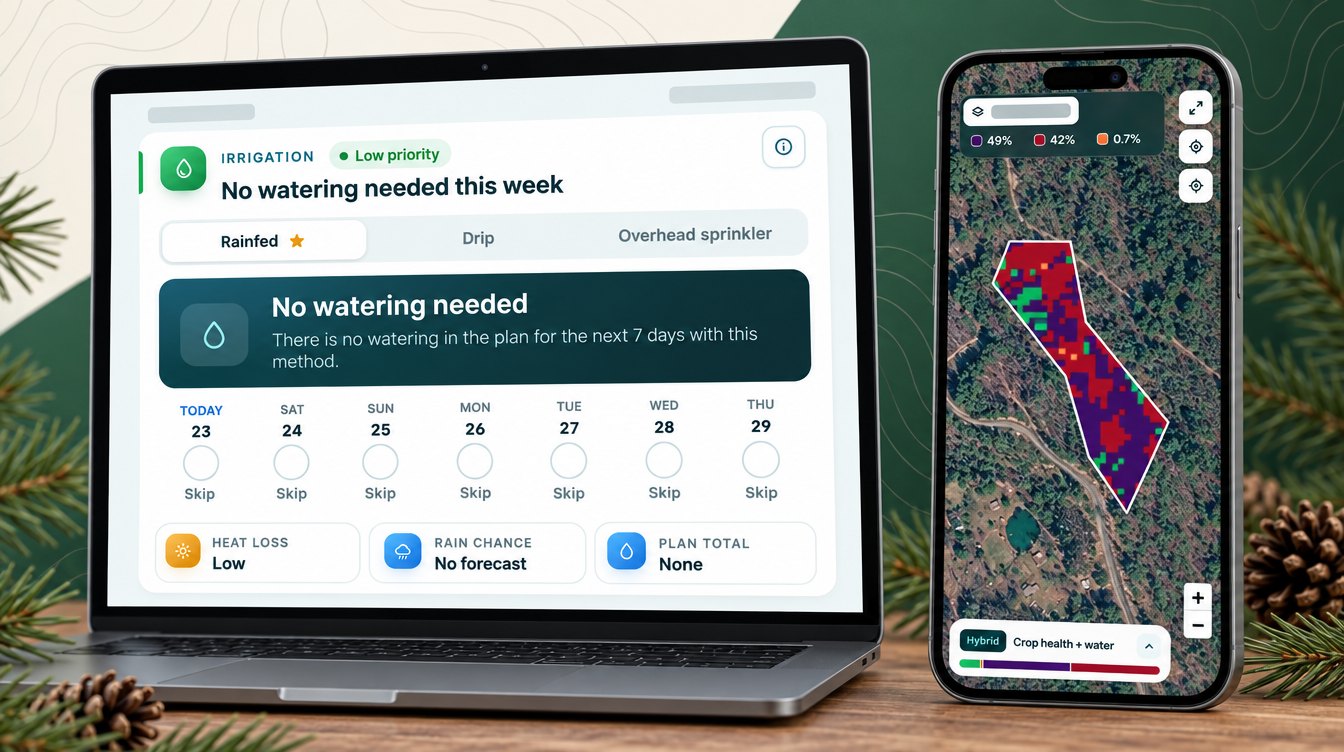
The water section of each advisory still plans each day, which makes it a quick check on stress. When advisories overlapped, we kept the newest plan for each stand and day. That left 132 stand-days. On 86 of them, or 65%, the advisory planned no water at all. On the 11.7-acre stand the plan was rain-fed on 31 of 32 days, and the advisory noted that soil moisture was adequate and rainfall of about 50 inches a year supplies the stand’s demand.
The two small stands got light drip suggestions in August and early September, during warm weeks. On the 2012 stand, 30 of 50 days were dry, and on the 2022 stand 25 of 50 were.
Planned water compared with a daily routine
To compare, we worked out what each small stand would have received if it had been given its own average watering dose every day. Against that same-dose routine, the 2012 stand’s plan was 60% lower, at about 2.4 inches (61 mm) instead of 6.0 inches (154 mm), and the 2022 stand’s plan was 50% lower, at about 3.0 inches (76 mm) instead of 6.0 inches (152 mm), over 2 August to 20 September. This is a comparison of plans, not metered use. For most owners the value is simpler: the plan confirms when rain is enough.
Chart
Planned water: plan vs daily routine
Inches per stand, 2 Aug–20 Sep 2026
Nutrition and soil
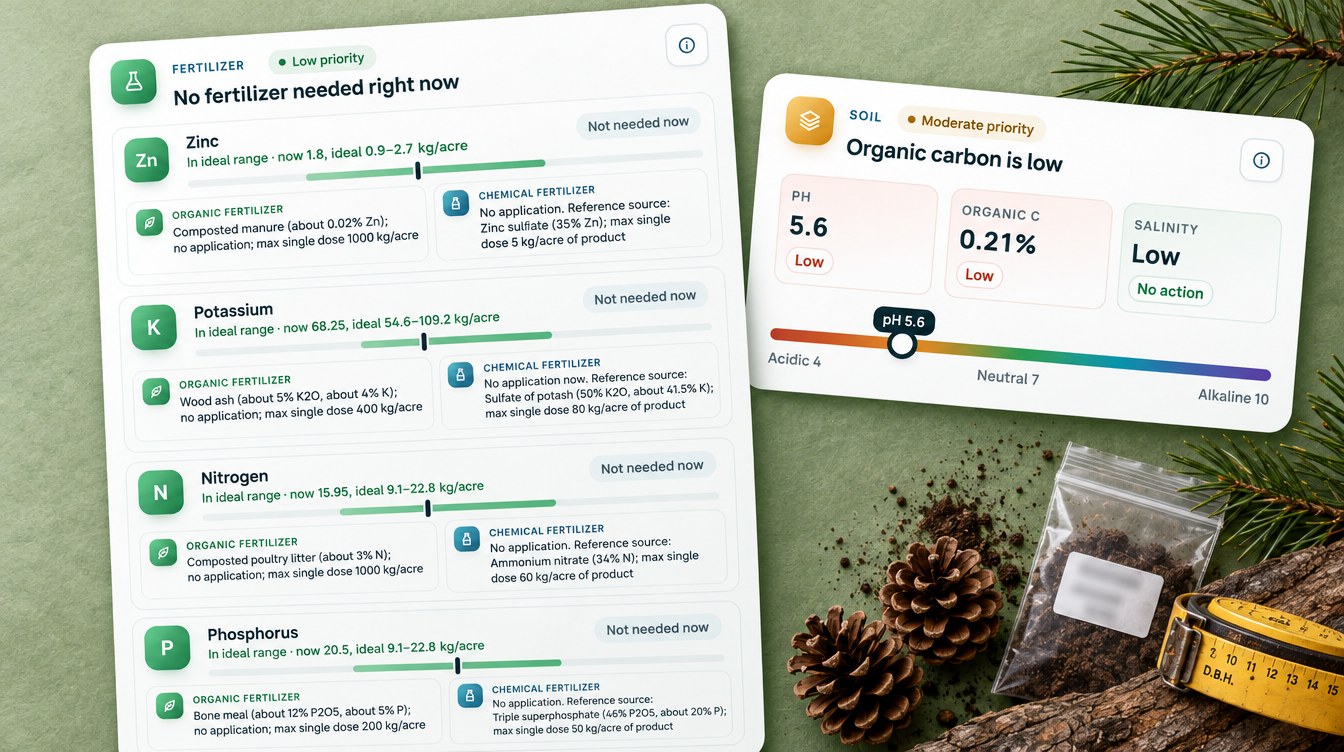
The fertilizer part of each advisory compares the stand’s modelled nutrient levels with the ideal range for its stage and suggests a rate only for nutrients that fall short. Across the 33 advisories there were 165 nutrient lines. Every one came with an organic source, such as composted poultry litter, bone meal or wood ash, next to a conventional fertilizer. Just over half (90) suggested any application at all, and all of those were for the two small stands in summer.
On the latest advisory for the 11.7-acre stand, nitrogen, phosphorus, potassium, sulfur and zinc were all inside their ideal ranges, so the advice was to apply nothing during dormancy. The soil section rated all three stands at pH 5.2 to 6.0, with low salinity and low organic carbon. The advisory’s own notes put typical pine soil pH at 4.5 to 6.0, so these readings sit in the normal band for pine. Where a nutrient does fall short, the organic sources also add organic matter to a soil rated low in carbon.
Weed scores pointed to the plants that compete in gaps and edges: broomsedge, Japanese honeysuckle and blackberry on the small stands, and kudzu and multiflora rose on the large one, where kudzu peaked at 78% in early October.
What forest owners can take from pine plantation monitoring
Three lessons stand out from this season of data.
- Check a dip with radar before you act. The large stand’s NDVI fell by half in ten days, but radar showed the canopy structure had not changed. That saved a false alarm and still gave the owner a scouting list.
- Watch risk by stand age and stage. Weevil scores were highest on the young stand, bark beetle and needle cast scores on the older ones, and needle blights rose again going into dormancy.
- Use the scores to plan the walk. A flagged part of a stand is where to look first for red-topped trees, pitch tubes or browning needles. The ground check confirms the cause.
Rules on clearing and land use are also tightening in some markets, which makes a record of canopy change useful. Our news piece on the anti-deforestation act covers one example. If you manage your own pine, the calculator below turns a flagged share of a stand into acres to scout and trees at risk, using your own numbers. You can then try the Farmonaut Satellite + AI Farm Monitoring System on your own stands.
Try the numbers for your own farm below.
Calculator
How many trees sit in the flagged part of your stand?
Enter your own stand size, tree density, the share flagged by satellite and your own value per tree.
- Trees in the flagged area: 400 trees
- Trees confirmed attacked (your estimate): 20 trees
- Value of attacked trees: $400
- Trees outside the flagged area: 3,600 trees
Example values only, not a benchmark or forecast. Use your own cruise or inventory for trees per acre; for reference, NC State Extension says precommercial thinning brings young pine stands to 300 to 450 stems per acre. The share confirmed on the ground and the value per tree are your own estimates.
FAQ
Can satellites see a pine stand through clouds?
Optical satellites such as Sentinel-2 cannot. Radar satellites such as Sentinel-1 can, because radar works day and night in any weather. In this case study 6 of 33 advisories came from radar alone on cloudy dates.
Can a satellite detect southern pine beetle?
Not the beetle itself. A satellite sees changes in canopy greenness and structure. The advisory combines those changes with the stand’s stage and moisture to score the risk, and the owner confirms an attack on the ground by looking for fading crowns and pitch tubes.
Why did NDVI drop when the radar stayed flat?
NDVI depends on a clear optical image, so cloud, haze, shadow or early-season needle color can pull it down. Radar measures canopy structure through cloud. When NDVI falls but radar stays flat, the canopy is most likely still there, and a recheck a few days later is the next step.
Does pine plantation monitoring work on small stands?
Yes. The smallest stand here is about 0.9 acres (0.36 ha), and it received its own advisories about every five days, with its own risk scores and water plan.
How often does a stand get a new advisory?
In this case study each stand got an advisory about every five days, in line with the Sentinel-2 revisit time, with radar advisories on cloudy dates.
Farmonaut forest monitoring
Watch your pine stands through every cloudy week
Draw your stands once, and Farmonaut sends satellite and radar-based pest risk, water and nutrient notes for each one every few days on web, Android or iOS.




Keep reading



Sources
- Farmonaut advisory records for three western North Carolina pine stands (2026): sat.farmonaut.com
- ESA, Sentinel-2 facts and figures: esa.int
- Copernicus SentiWiki, Sentinel-1 mission: sentiwiki.copernicus.eu
- NASA Earth Observatory, Measuring vegetation (NDVI and EVI): science.nasa.gov
- USDA Forest Service FIA, Forests of North Carolina 2023 annual snapshot (FS-589, 2025), via N.C. Forest Service: ncagr.gov
- N.C. Forest Service, Southern Pine Beetle Prevention Program: ncagr.gov
- N.C. Forest Service, Forest Health Highlights 2025: ncagr.gov
- NC State Extension, Pine bark beetles: content.ces.ncsu.edu
- Penn State Extension, Pine diseases: extension.psu.edu
- NOAA NCEI, U.S. Climate Normals 1991–2020, monthly normals for Boone 1 SE, NC (USC00310982): ncei.noaa.gov
Discussion
Questions, corrections or field experience? Share them below. First-time comments are reviewed before they appear, and your email is never published.
No comments yet. Be the first to add a question or your experience.

 BACF Africa
 Nivia
 Doodlakine
 Exurbia Geospatial
 FieldZero
 Indico Company
 Kubota
 FFBS
 Jontra
 Kalustyan
 Tucor
 Hayleys Agriculture
 Linx Agritech

 Licence holder · Niger · Gold










