

Customer case study · Blueberries
Blueberry Root Rot After Harvest: An Oregon Case Study
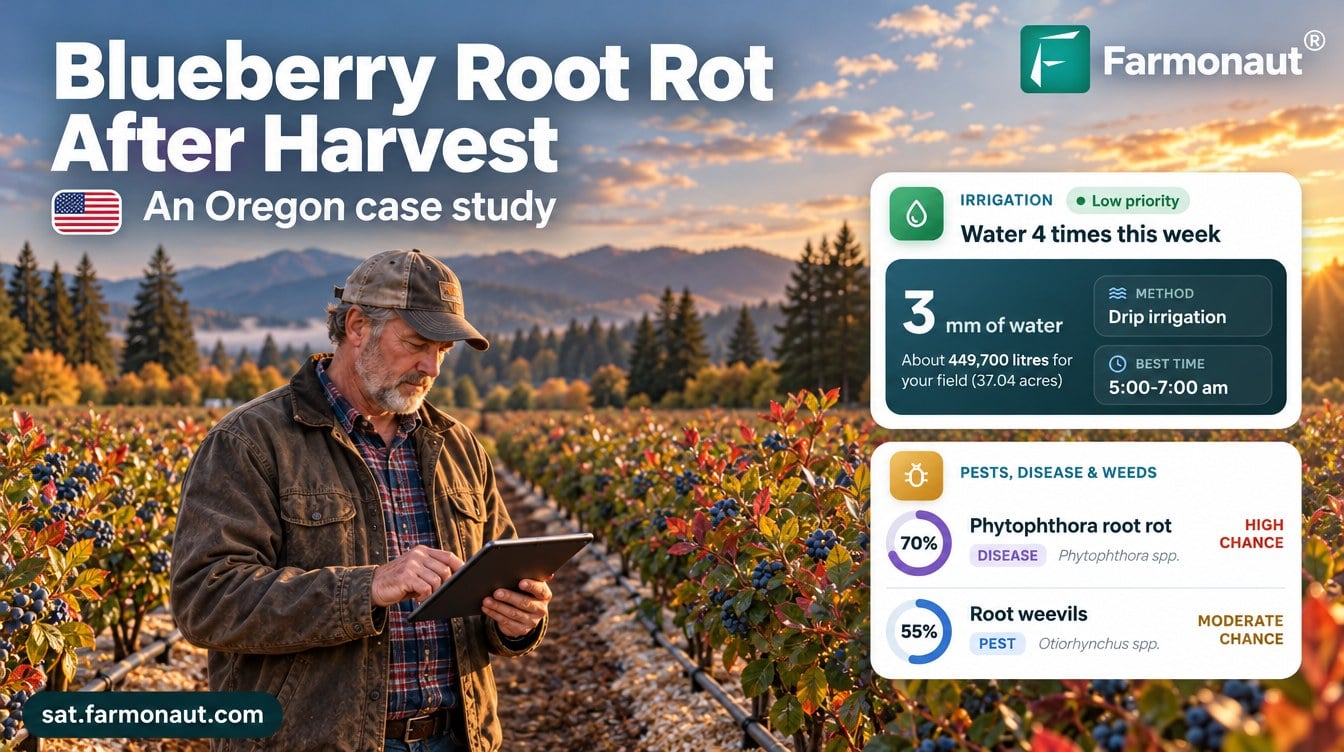
Blueberry root rot risk rose on a 37-acre Willamette Valley field as each harvest wound down: satellite advisories scored Phytophthora root rot at 66% to 82% in September and October 2026, while the canopy’s NDVI stayed below its expected range and the soil read wet.
Key takeaways
- A Willamette Valley grower received 155 satellite advisories for a 37-acre (15 ha) highbush blueberry field from June 2025 to October 2026.
- Phytophthora root rot was flagged in 39 advisories from mid-July to mid-December 2025, then returned on 1 September 2026 at 82% after no flags during peak picking.
- In mid-October 2026 the canopy read an NDVI of 0.54 to 0.59, below the 0.65 to 0.80 expected after harvest, while radar soil moisture read high.
- The advisories planned no water on 46.9% of days, 43% to 45% less than a same-dose daily routine, and cut back as Oregon’s autumn rain returned.
- Potassium and phosphorus were flagged ahead of nitrogen, and 97.5% of nutrient lines named an organic option.
In this article
- The farm and the brief
- Why Oregon blueberries are worth protecting
- How satellite monitoring works on this field
- A season of advisories, from harvest to dormancy
- Blueberry root rot risk after harvest
- Risk by stage: what the advisories flagged and when
- Water: planned dry days in a wet autumn
- Nutrition and soil
- What other blueberry growers can take from it
- FAQ
Blueberry root rot risk rose on this Oregon field as each harvest wound down. Satellite advisories for a 37-acre (15 ha) highbush blueberry field in the Willamette Valley flagged Phytophthora root rot in 39 advisories between mid-July and mid-December 2025, then again from 1 September 2026, with modelled scores of 66% to 82%. At the same time the canopy read an NDVI of 0.54 to 0.59 in mid-October, below the 0.65 to 0.80 the advisories expect after harvest.
This case study walks through 155 advisories sent to the grower from June 2025 to October 2026. It shows what the satellite saw, what each advisory recommended, and how other berry growers can use the same signals. All figures come from the grower’s advisory records. Risk scores are modelled probabilities, not confirmed infections, and water figures are planned amounts, not metered use.
The farm and the brief
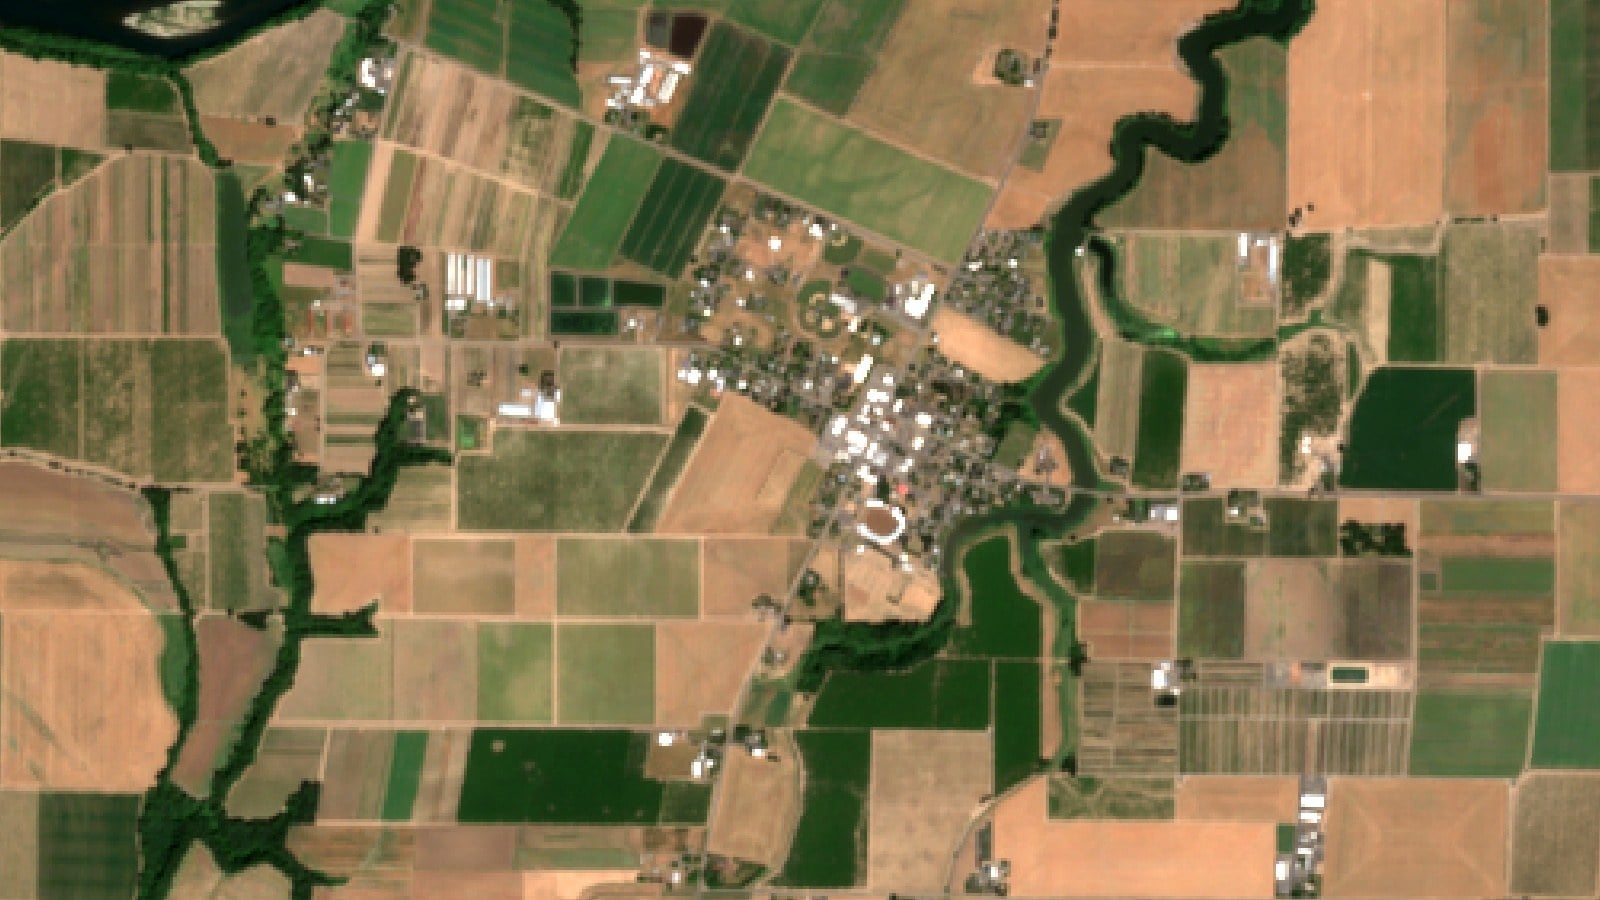
The grower farms one block of highbush blueberries in the Willamette Valley of western Oregon. The field covers about 37 acres (15 ha) and was planted in autumn 2022, so the bushes were in their third and fourth growing seasons during this record. The first advisory arrived in June 2025, and a new one has followed about every three days since then.
Where the blueberry field is
Oregon shaded; the marker shows the approximate area only
A young planting on valley soil brings a clear set of jobs. Harvest runs through the summer, then the bushes put on new roots and set next year’s flower buds while autumn rain returns. That is also when wet soil and root disease become a concern. The grower wanted to see canopy vigour, water needs and pest and disease risk for the whole field without walking every row first.
| Item | Detail |
|---|---|
| Region | Willamette Valley, Oregon, US |
| Crop | Highbush blueberry |
| Field | 1 field, about 37 acres (15 ha) |
| Planted | Autumn 2022 |
| Irrigation | Drip |
| Monitoring period | June 2025 to October 2026 |
| Advisories | 155 in total, about one every 3 days |
| Soil (modelled) | pH mostly 4.8 to 5.5, low salinity, organic carbon rated low |
Why Oregon blueberries are worth protecting
Oregon is one of the largest blueberry states in the US. The USDA’s Noncitrus Fruits and Nuts 2025 Summary puts Oregon’s cultivated blueberry crop at 174 million pounds in 2025, from 13,900 harvested acres. That is an average of 12,500 lb per acre, against 7,340 lb per acre for the US as a whole. Growers received an average of $1.17 per pound, and the crop was worth $203.3 million.
Chart
Oregon cultivated blueberry production
Million pounds, total production, 2022–2025
The same NASS series shows how much a season can swing. Oregon’s crop fell from 168 million pounds in 2022 to 129.5 million in 2023, according to the 2024 summary, before it recovered. Supply swings like these feed the wider story of blueberry shortages and prices. On a single farm, a root problem that weakens next year’s flower buds is one of the quieter ways to lose part of a crop.
How satellite monitoring works on this field
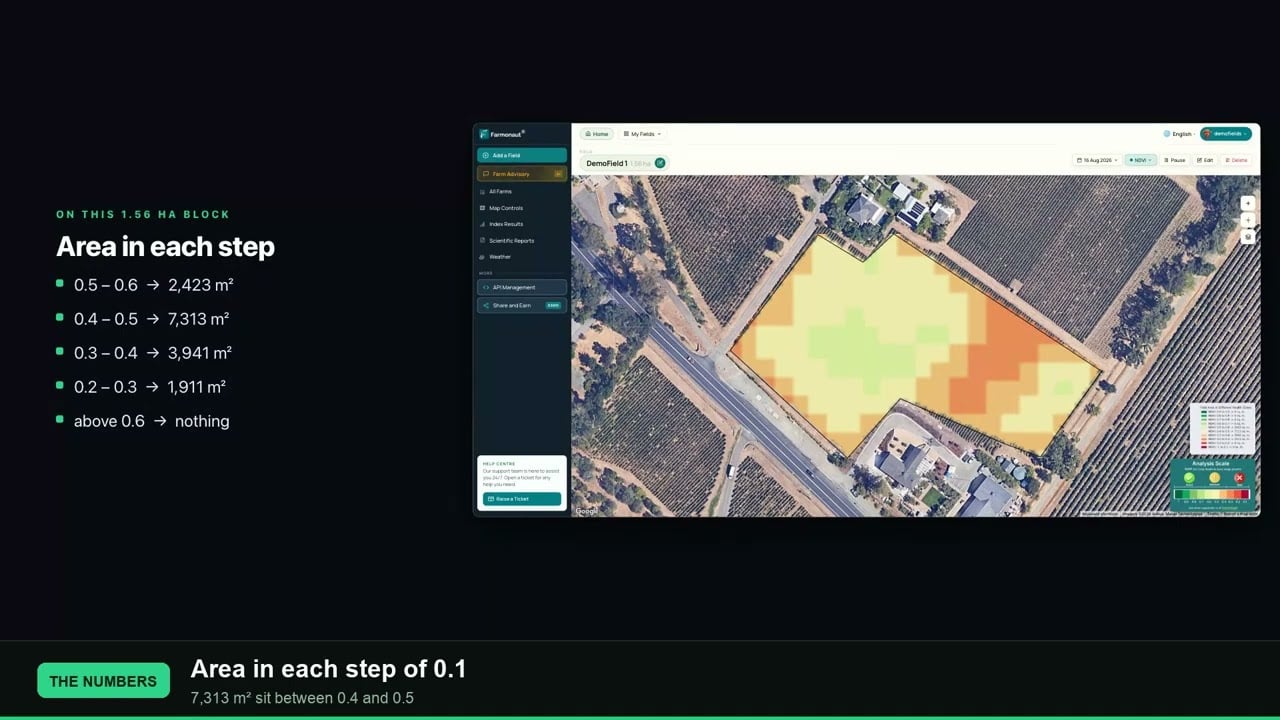
Each advisory starts with fresh satellite images of the field. The Sentinel-2 satellites have a revisit time of five days with two satellites and give 10-metre detail in the visible and near-infrared bands. From these bands the system works out vegetation indices such as NDVI, which compares red and near-infrared light to show how much green leaf is present. A healthy, full canopy reads high. A thin or stressed canopy reads lower.
Infographic
How each blueberry advisory is built in 4 steps
- 1Satellite passSentinel-2 images the field every few days; radar adds soil moisture.
- 2Read the canopyNDVI shows whether the bushes are as green as the stage expects.
- 3Add weather and stageRain outlook, growth stage and local pest lists set water need and risk.
- 4Field planDrip plan, risk scores, nutrients with organic options, soil and yield.
The images are combined with radar-based soil moisture readings, the weather outlook, the bushes’ growth stage and the crop’s known water and nutrient needs. The result is one advisory with five parts: an irrigation plan for the coming days, pest and disease risk scores, weed risk, a fertilizer plan with organic options, and a soil and yield summary.
A satellite cannot see roots or a soil fungus. What it can see is a canopy that stays thin when it should be filling out, and soil that stays wet for long spells. When those two signals line up in the weeks after harvest, the advisory raises the root rot score so the grower knows where to dig and check first.
A season of advisories, from harvest to dormancy
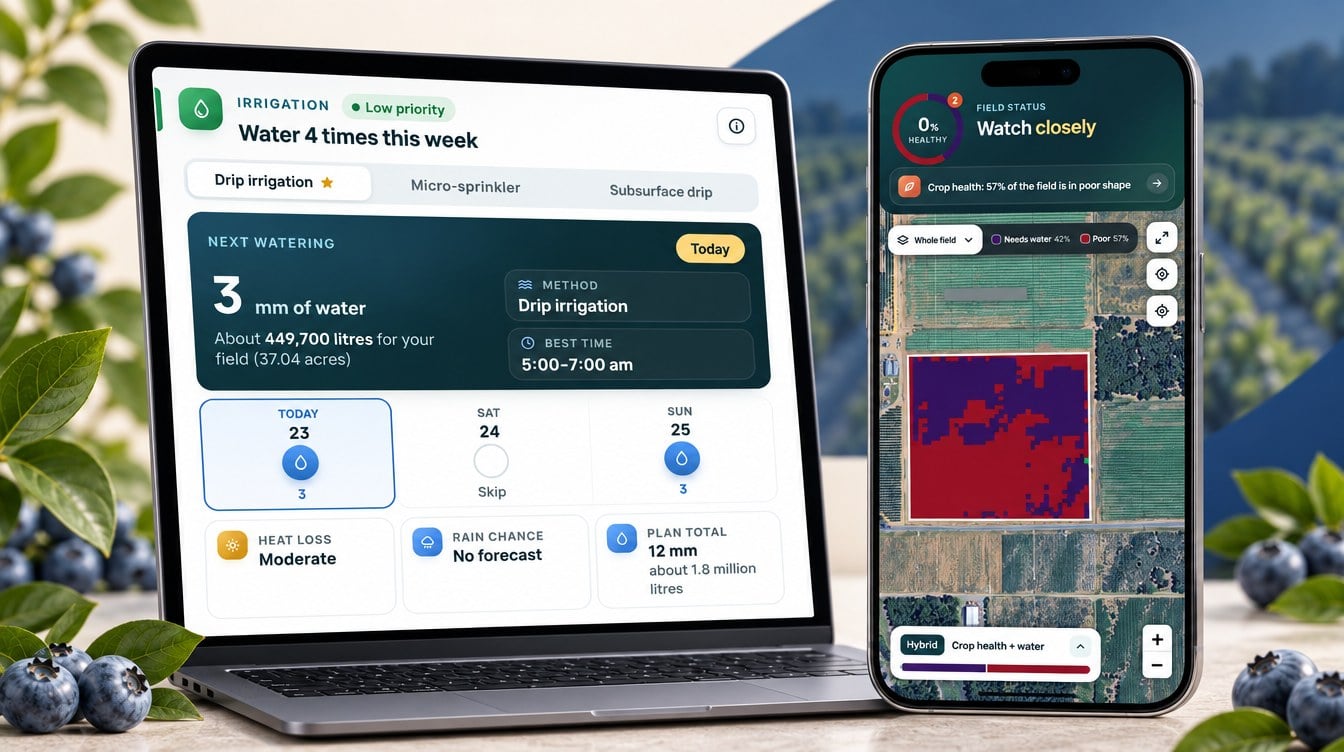
The advisories followed the bushes through two harvests and one winter. We used the advisories whose growth stage matched an Oregon season and left out a few weeks in early 2026 when the stage labels ran ahead of the calendar. That left 120 advisories.
| Months | Main stage reported | What the advisories focused on |
|---|---|---|
| Jul to Aug | Harvest | Fruit pests, fruit rots, the most water of the year |
| Sep to Oct | Post-harvest growth | Root rot and root weevil watch, canopy recovery |
| Nov to Jan | Dormancy | Root rot, mummy berry, cane disease, almost no water |
| Apr | Bud swell to fruit set | Mummy berry, gall midge, aphids |
| Jun | Ripening, early harvest | Fruit pests return, water rises again |
The canopy readings tell the same story. During the 2026 harvest the field’s NDVI mostly sat between 0.41 and 0.51 in July and August, against 0.70 to 0.85 the advisories expect at that stage. It dipped to 0.32 to 0.37 in late August as picking ended, then climbed back to 0.54 to 0.59 by mid-October. That recovery was real but stopped short of the 0.65 to 0.80 range for post-harvest growth.
▶ What NDVI values from −1 to +1 mean on a real field · 2:33
Blueberry root rot risk after harvest
Phytophthora root rot was the threat that set this field’s autumn apart. It did not appear in any advisory during the 2026 harvest. It came back on 1 September 2026 with a score of 82%, and stayed between 66% and 82% through 18 October. In 2025 it followed the same pattern: first flagged on 18 July as harvest wound down, then in 39 advisories up to mid-December, rated high in early August and late November.
Chart
Phytophthora root rot score after the 2026 harvest
Modelled risk in each advisory that flagged it, %, Sep–Oct 2026
The timing fits what plant pathologists know about the disease. The Pacific Northwest Plant Disease Management Handbook explains that blueberry plants generally have two main root growth peaks, one in spring and another in late summer after harvest. The handbook advises timing protective treatments just before these peaks. It also notes that the pathogen spreads in water and soil, and that root rot is much more severe in poorly drained, heavy soils.
Three signals drove the score on this field. The canopy stayed below its expected range for weeks. Radar soil moisture read high, between 0.71 and 0.81 on the advisory scale in October. And the bushes are young, which matters because the handbook says the disease is often a problem of young plants during establishment. Older bushes with bigger root systems cope better on a well-drained site.
What the advisory recommended
The advisory gave both an organic and a conventional option, a phosphonate drench and a mefenoxam drench, and asked the grower to rotate between product groups. It paired them with cultural steps: improve drainage, keep raised beds, avoid over-watering, and correct fertility to rebuild the canopy. Always follow the product label and local rules. The handbook also notes that the fungicides used against Phytophthora protect roots but do not kill the organism, which is why drainage and water timing carry so much weight.
Oregon State University Extension gives the drainage numbers. Its blueberry guide says the soil water table should be at least 14 inches below the soil surface, that roots suffocate in soil water-logged for more than a few days in a row, and that raised beds about 1 to 1.5 feet high help drainage.
Root weevils
Root weevils joined the list in September 2026, with scores of 52% to 68%. The Pacific Northwest Insect Management Handbook says black vine weevil is probably the most common weevil in blueberries, that larvae feeding on roots can stunt young plants, and that beneficial nematodes have shown some effect as a drench in the fall. Adults notch leaves at night, so a torch check on a calm evening confirms them. The advisory’s organic option was beneficial nematodes, which matches that timing.
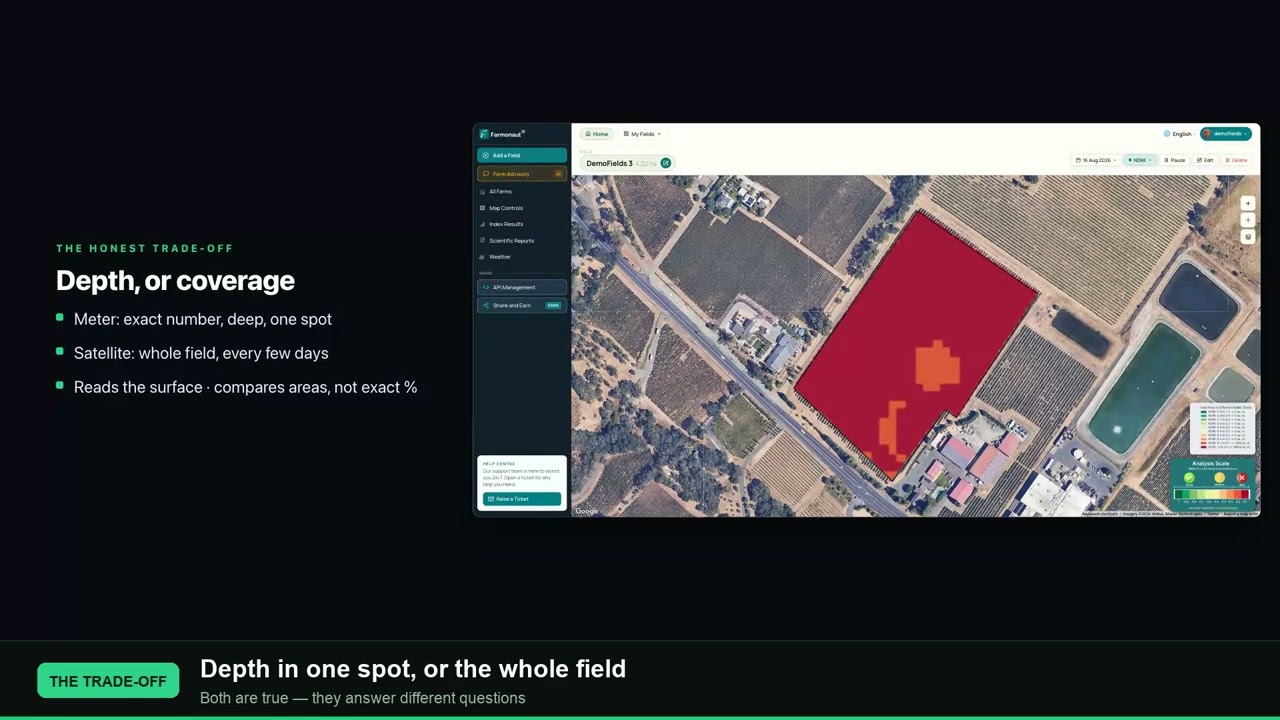
▶ How satellite soil moisture compares with a soil probe · 2:11
Risk by stage: what the advisories flagged and when
Across the 120 advisories, the threats changed with the stage. Spotted-wing drosophila and fruit rots led during harvest. Root rot and root weevils took over after harvest. Mummy berry and cane disease led over winter and into bloom.
Chart
How often each threat was flagged
Share of 120 advisories, selected threats, Jun 2025–Oct 2026
| Stage | Months | Top modelled risks (monthly average score) |
|---|---|---|
| Bud swell to fruit set | Apr 2026 | Mummy berry 93%, gall midge 90%, anthracnose 83% |
| Harvest | Jun to Aug 2026 | Spotted-wing drosophila 92% to 97%, anthracnose 89% to 92%, botrytis 78% to 87% |
| After harvest | Sep to Oct 2026 | Phytophthora root rot 72% to 76%, root weevil 54% to 65%, spotted-wing drosophila 72% to 84% |
| Dormancy | Nov 2025 to Jan 2026 | Mummy berry 80% to 96%, bacterial canker 76% to 90%, Phytophthora root rot 71% to 75% |
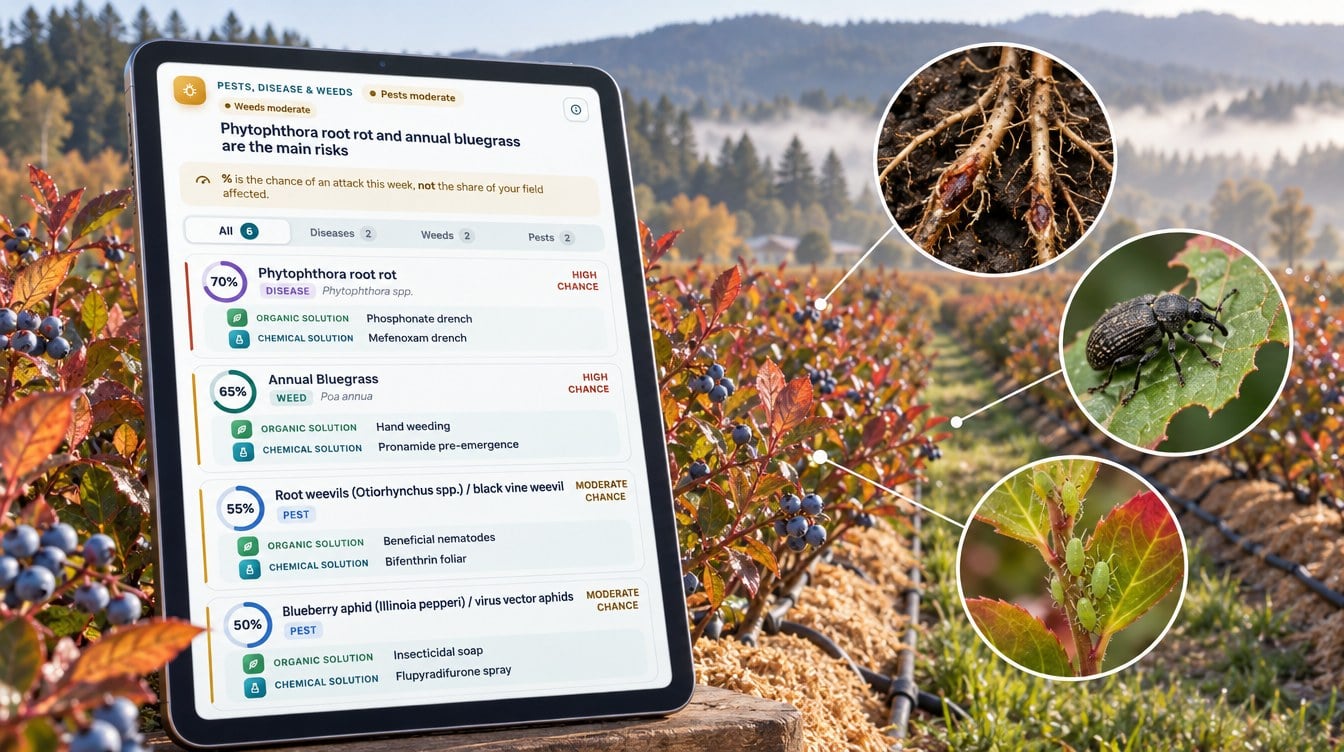
Each score is a modelled probability built from the field’s canopy, moisture and weather data. It tells the grower where and when to look first. It does not confirm that a pest or disease is present. The pest card on the app makes this point too: the percentage is the chance of an attack in the coming week, not the share of the field affected.
Water: planned dry days in a wet autumn
The irrigation part of each advisory plans a drip amount for each of the next several days. When advisories overlapped, we kept the newest plan for each day. Across the 382 planned days we kept, the advisories planned no water on 179, or 46.9%.
Chart
Rainfall vs planned drip by month
Inches per month; NOAA normal rainfall at Salem vs the advisory plan
Local weather explains the shape of the plan. At Salem’s McNary Field, the NOAA 1991–2020 climate normals give just 0.25 inches of rain in July and 0.39 inches in August, then 3.47 inches in October, 5.95 inches in November and 6.97 inches in December, out of 40.08 inches a year. The plan put the most water on the bushes in the dry summer months, about 3.8 inches (97 mm) in July, and cut back as the rain returned, to about 0.5 inches (13 mm) in December.
The plan also followed the crop’s water curve. The FAO irrigation guide gives berry bushes a crop coefficient of 0.30 at the start of the season, 1.05 in mid-season and 0.50 at the end. In this record the share of dry days rose from 29% to 35% in July to about half of all days in October, 77% in December, and every day in early January.
Planned water compared with a daily routine
To compare, we worked out what the field would have received with its own average watering dose every day. Across the June to December 2025 window the plan came to 13.5 inches (343 mm), against 23.9 inches (606 mm) with a same-dose daily routine. Across June to October 2026 it came to 10.9 inches (277 mm), against 20.0 inches (508 mm). That is 43% to 45% less water in each window. This is a comparison of plans, not a metered saving, but it shows how much of the season’s water depends on timing.
For root rot, timing matters as much as volume. The disease handbook warns against over-irrigating drip fields so that soil stays saturated for 48 hours or more, and advises deep watering with drying between irrigations. The latest October advisory did exactly that: it planned water every second day and skipped the days in between, because radar soil moisture was already high. One way to use the plan well is to check it against your own rain gauge in autumn, and skip a planned watering after a real soaking.
Chart
Planned water vs a same-dose daily routine
Inches of water per window, whole field
Nutrition and soil
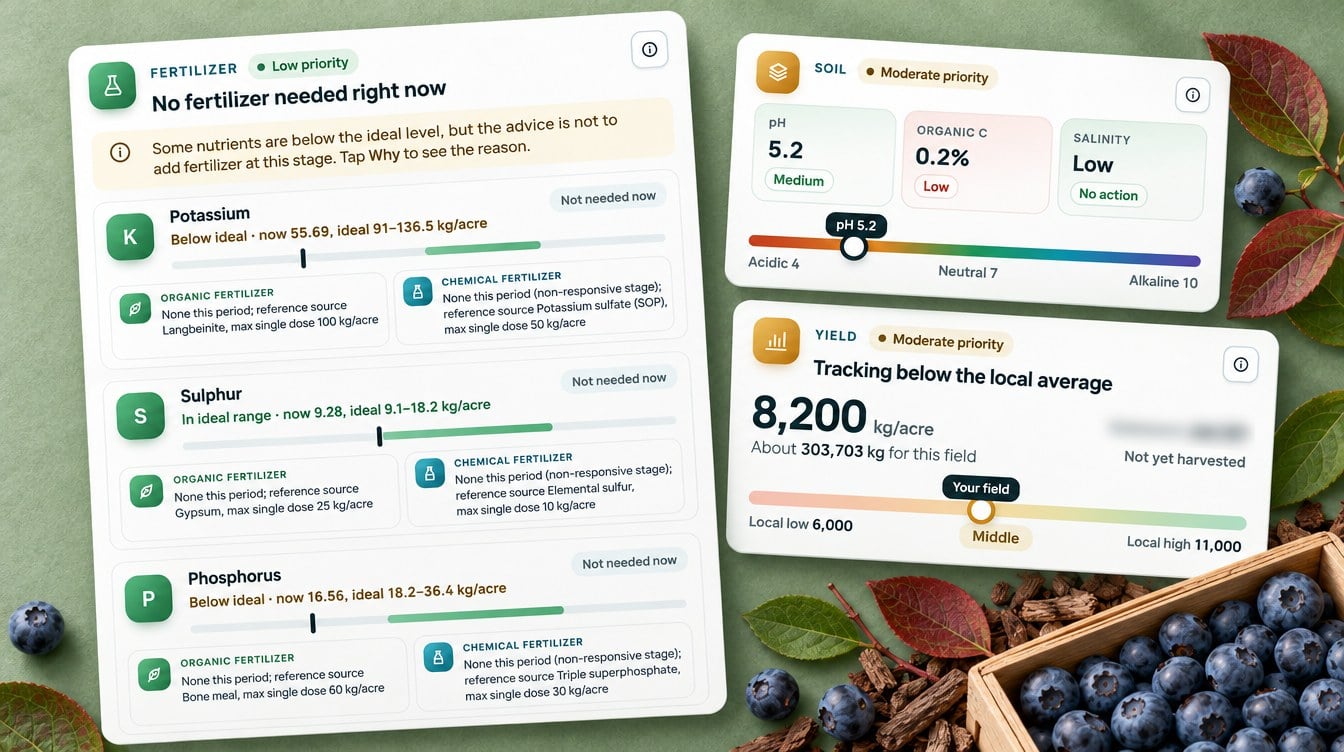
The fertilizer part of each advisory compares the field’s modelled nutrient levels with the ideal range for the current stage, then gives a rate for each nutrient that is short. Across the 120 advisories there were 600 nutrient lines, and 585 of them (97.5%) named an organic source as well as a conventional fertilizer.

▶ How a Farmonaut satellite farm advisory is read, section by section · 9:13
After the 2026 harvest the advisory held all fertilizer, because the bushes were in a stage that responds little to feeding. It still flagged potassium as the largest gap, at about 61 ppm against an ideal of 100 to 150 ppm, with phosphorus just below its range. That fits the handbook’s advice for root rot sites: do not overfeed nitrogen, and keep phosphorus and potassium up because they appear to help root growth. The advisory marked potassium and phosphorus as the priority for the next feeding window in late winter and spring.
The soil card rated the field’s pH at mostly 4.8 to 5.5, inside the 4.5 to 5.5 range that Oregon State University recommends for blueberries, with low salinity. Organic carbon was rated low. That is why the advisories leaned on acidic organic options such as pine bark or sawdust mulch, which also improve soil aeration around the roots. The yield card gave a modelled estimate for the next harvest, not a forecast.
What other blueberry growers can take from it
Four lessons on blueberry root rot, water and feeding stand out from this field’s 16 months of data.
- Watch the weeks after harvest. Root rot risk stayed silent during peak picking and rose as harvest wound down in both years, just before the late-summer root growth peak.
- Read canopy and soil moisture together. A canopy that stays below its expected NDVI while the soil reads wet is the pattern that points to roots, not to a lack of water.
- Let the rain do the work in autumn. The plan cut water as rain returned and left about half of autumn days dry, which suits a disease that thrives in saturated soil.
- Feed the roots, not the leaves. Potassium and phosphorus were flagged ahead of nitrogen, in line with regional advice for root rot sites.
If you grow blueberries, the calculator below gives a rough idea of what a patch weakened by blueberry root rot could cost at your own yield and price. For a warmer-climate comparison, see our Florida blueberry advisory case study, or try the Farmonaut Satellite + AI Farm Monitoring System on your own fields.
Try the numbers for your own farm below.
Calculator
What could a root rot patch cost on your blueberry field?
Enter your own acres, yield and price, plus the share of the field you think is weak and the loss you expect there.
- Weak area: 2.0 acres
- Fruit at risk: 7,500 lb
- Value at risk per field acre: $439
- Whole-field crop value: $292,500
Example values only, not a forecast. The default yield and price are USDA NASS averages for Oregon cultivated blueberries in 2025 (12,500 lb per acre, $1.17 per pound); the weak share and loss are round examples. Replace all five with your own numbers.
FAQ
What causes blueberry root rot?
In the Pacific Northwest it is mainly caused by Phytophthora cinnamomi, a fungus-like organism that lives in soil and spreads in water. It does most damage in wet, poorly drained, heavy soils and on young plants. Good drainage, raised beds and careful watering are the main defences.
Can a satellite see Phytophthora root rot?
Not directly. A satellite sees the canopy, not the roots. The advisory combines a canopy that stays thin with wet soil readings, the growth stage and local disease lists to score the risk. The grower then digs and checks the roots on the ground.
Why does root rot risk rise after harvest?
Blueberries put on a second flush of roots in late summer after harvest, and autumn rain returns in western Oregon. New roots in wet soil are what the pathogen needs, so regional guidance times protective steps just before that root growth peak.
How often does a blueberry field get a new advisory?
In this case study the field received an advisory about every three days, 155 in total from June 2025 to October 2026.
Should I cut irrigation if my field has root rot risk?
Not to zero, but avoid keeping the soil saturated. Regional guidance advises deep watering with drying between irrigations, and no drip schedule that leaves soil saturated for 48 hours or more. Check your own rain gauge in autumn and skip a planned watering after a heavy rain.
Farmonaut berry monitoring
Get a field-by-field plan for your blueberries
Draw your fields once, and Farmonaut sends a satellite-based irrigation, nutrient and pest and disease risk plan for each one every few days on web, Android or iOS.




Keep reading


Sources
- Farmonaut advisory records for a Willamette Valley blueberry field (2025–2026): sat.farmonaut.com
- USDA NASS, Noncitrus Fruits and Nuts 2025 Summary (May 2026): esmis.nal.usda.gov
- USDA NASS, Noncitrus Fruits and Nuts 2024 Summary (May 2025): esmis.nal.usda.gov
- Pacific Northwest Plant Disease Management Handbook, Blueberry root rot (revised March 2026): pnwhandbooks.org
- Pacific Northwest Insect Management Handbook, Blueberry root weevil: pnwhandbooks.org
- Oregon State University Extension, Growing Berries on the Oregon Coast: Blueberries, EM 9179 (2018, reviewed 2022): extension.oregonstate.edu
- NOAA NCEI, 1991–2020 monthly normals, Salem McNary Field (USW00024232): ncei.noaa.gov
- NOAA NCEI, U.S. Climate Normals: ncei.noaa.gov
- FAO, Irrigation and Drainage Paper 56, Chapter 6 crop coefficients (1998): fao.org
- ESA, Sentinel-2 facts and figures: esa.int
- NASA Earth Observatory, Measuring vegetation (NDVI and EVI): science.nasa.gov
Discussion
Questions, corrections or field experience? Share them below. First-time comments are reviewed before they appear, and your email is never published.
No comments yet. Be the first to add a question or your experience.

 Nale Network
 Exurbia Geospatial
 FieldZero
 Indico Company
 Kubota
 FFBS
 Jontra
 Kalustyan
 Tucor
 Geno
 Hayleys Agriculture
 Linx Agritech
 Adinet
 Save Your Soils

 Licence holder · Niger · Gold










