

Client case study · Gold · Southwestern United States
How Desert Gold Exploration by Satellite Narrowed 240 Acres to 8 Gossan Targets in the US Southwest
Desert gold exploration by satellite narrowed a gold property of about 240 acres in the southwestern United States to 8 gossan-style target zones covering about 14% of the ground. The analysis put the first drill holes in a clear order before any money was spent in the field, and the client reported saving 1 to 3 months and US$25,000 to US$50,000.
Key takeaways
- A gold property of about 240 acres in the southwestern United States was screened from space in one pass, and the analysis returned 8 gossan-style target zones covering about 13 ha, roughly 14% of the ground.
- Bare, arid terrain let the sensors see the rock itself, so the report rated detection confidence as high for every zone.
- Two zones, Zone 5 and Zone 8, hold about 41% of the modelled gold and lead the drill plan.
- On a P10 to P90 basis, the report’s exploration target is about 7,800 to 11,300 troy ounces at 1.56 to 2.27 g/t, with tops of the targets about 55 to 75 m below surface.
- Before any drilling, the client reported saving 1 to 3 months and US$25,000 to US$50,000. These are the client’s own estimates.
In this article
- A desert gold property and the question that came first
- Why arid, bare ground suits satellite gold exploration
- How the satellite analysis worked on this property
- What the report found: 8 gossan targets on about 14% of the ground
- Depth, shape and strip ratio: what a first programme would face
- Confidence tiers and the drill order
- What the client reported after the report
- Lessons for desert gold explorers
- Desert gold exploration: frequently asked questions
A desert gold property and the question that came first
This case study follows a small gold property of about 240 acres, or about 96 hectares, in the southwestern United States. The operator holds the ground at an early stage. There has been no drilling yet, and the first drilling is planned more than six months out. What the operator needed before then was simple to say and hard to answer: of all this ground, where should the first holes go?
That question comes up on almost every early-stage gold project. A property of a few hundred acres is small by mining standards, but it is a lot of ground to walk, map and sample with a small team and a fixed budget. Spread that budget evenly and every part of the property gets a little attention. Point it at the right places and a much smaller area gets a proper test.
The operator commissioned a Farmonaut Premium satellite report for gold over the whole property. The report screened all of the ground in one pass and returned a ranked set of target zones, each with an estimated depth, footprint, strip ratio and drill direction. This article walks through what the report found, how the analysis works in dry country, and what the client recorded about the results afterwards.
Why arid, bare ground suits satellite gold exploration
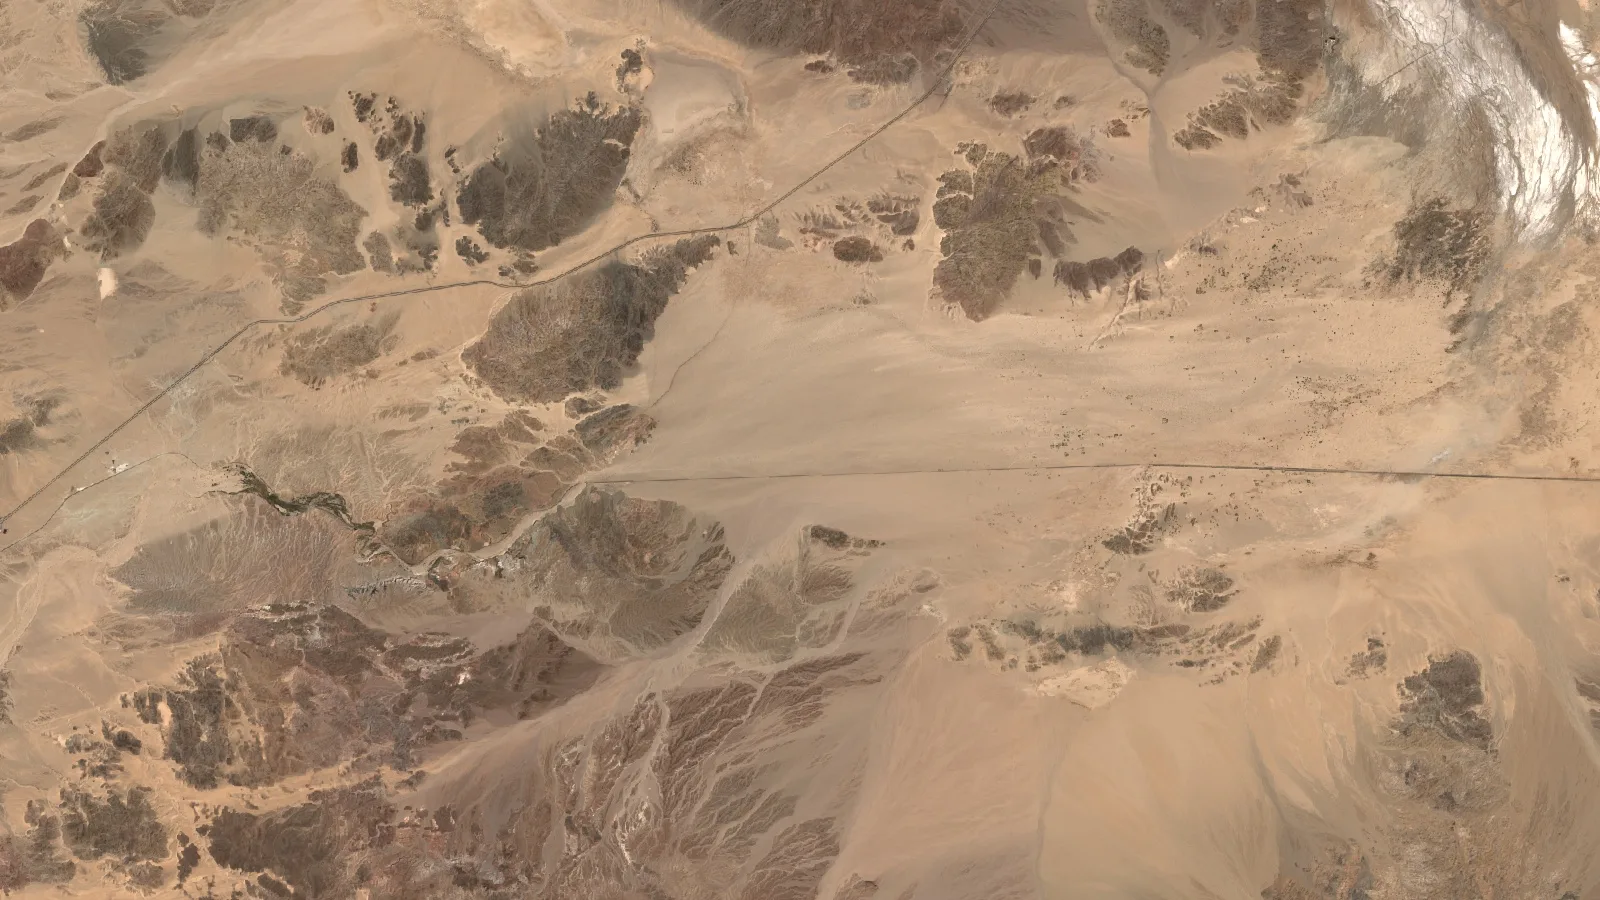
Desert country is some of the best ground there is for satellite gold exploration. The reason is plant cover, or the lack of it. In a forest or on farmland, leaves and crops hide the rock, and a satellite mostly sees vegetation. In the arid Southwest, much of the surface is bare rock, thin soil and scree, so the sensors see the ground itself.
That matters because the clues to gold are in the rock. When hot, mineral-rich fluids move through the crust, they change the rocks they pass through. They leave behind clay minerals, white mica, silica and iron oxides. Each of these reflects sunlight in its own way, especially in the shortwave-infrared part of the spectrum. Over bare ground, those reflections reach the satellite with little interference.
- Iron oxides and gossans: rust-coloured minerals such as hematite and goethite can form a gossan, a weathered oxide cap over sulphide mineralisation. Gossans are among the oldest clues prospectors use.
- Clay and mica alteration: minerals such as kaolinite and sericite show up strongly in shortwave-infrared light, which is what the ASTER instrument was designed to measure.
- Structure: faults and fractures are the paths that gold-bearing fluids follow. Radar and terrain data pick them out as lines and breaks in the landscape.
- Persistence: in a dry climate, the same rock signal shows up in image after image, year after year. That steadiness is a good sign that a signal comes from geology and not from a passing season.
On this property, the report rated detection confidence as high for every target, because all eight sit on open, bare terrain. Mean slopes of about 14 degrees also mean the ground is workable for field crews and a drill rig.
How the satellite analysis worked on this property
The client’s part was quick. The operator sent the property boundary and named gold as the target mineral. No one needed to visit the site for this stage, and no ground was disturbed.
Infographic
How the property moved from a boundary to a drill order
- 1Send the boundaryThe operator sent the outline of the property and named gold.
- 2Analyse from spaceOptical, shortwave-infrared, radar, thermal, magnetic and terrain data were combined.
- 3Map the targetsEight gossan-style zones were outlined, with depth, grade band and strip ratio.
- 4Rank by confidenceEach zone got a confidence tier, which sets the order of field work.
- 5Plan the drillingEach zone got a drill direction, angle, hole length and hole count.
The analysis then combined several independent kinds of satellite and geophysical data, so that no single sensor decided the result on its own:
- Sentinel-2 optical images: this European mission gives 10-metre images in visible, near-infrared and shortwave-infrared bands, used for iron oxides and alteration colour.
- ASTER shortwave infrared: used to separate clay, mica and carbonate minerals that mark altered rock.
- Sentinel-1 and PALSAR-2 radar: Sentinel-1 and the L-band PALSAR-2 radar pick out faults, fractures and surface roughness, and see through any cloud.
- Thermal data: day and night surface temperatures from MODIS and ASTER help flag silica-rich and oxidised ground.
- Magnetics: the EMAG2 magnetic anomaly grid adds the regional picture of buried structures and intrusions.
- Terrain: the Copernicus elevation model supplies slope, drainage and landform, which shape both the targets and the access to them.
Each layer was turned into a score, and the scores were combined into a single Gold Potential Index for every 10-metre pixel. Pixels that scored highly, and that agreed across several independent signals, were grouped into target zones. A zone only made the list if enough of its pixels carried a strong signal.
▶ How satellites look for signs of gold, explained through a real report. · 18:54
Each zone was then checked against a list of things that can cause a false signal, such as sitting close to the edge of the property or showing alteration without matching rock types. Those checks did not remove zones. They set the order in which the zones should be tested and told the field team what to look for on the ground.
▶ A short explainer on how minerals leave spectral signatures that sensors can read. · 1:49
What the report found: 8 gossan targets on about 14% of the ground
The report found 8 target zones inside the property. Together they cover about 13.2 hectares, or about 32.6 acres. That is about 14% of the ground screened. In practice, the first round of mapping, sampling and drilling can focus on about one acre in every seven.
Chart
Target zones cover about 14% of the ground
Hectares, across the property screened
The report classifies all eight zones as gossan-style targets: iron-oxide-rich ground that may cap weathered sulphide mineralisation. Its deposit-style scores lean towards vein-hosted gold, but the report leaves the final deposit type open until rocks have been mapped and sampled. That is the right call at this stage, and it gives the field geologist a clear set of things to check.
Here is how the eight zones compare. We use the zone numbers from the report so that the figures can be matched to the drill plan later in this article.
| Target zone | Footprint | Strike length | Estimated depth | Grade band (P10–P90) | Strip ratio | Share of modelled gold | Confidence |
|---|---|---|---|---|---|---|---|
| Zone 5 | 3.48 ha | 396 m | 66–101 m | 1.40–1.89 g/t | 1.89 | 23.9% | High |
| Zone 8 | 2.30 ha | 297 m | 65–100 m | 1.31–2.05 g/t | 1.86 | 16.9% | Medium |
| Zone 2 | 1.63 ha | 248 m | 57–92 m | 2.06–2.62 g/t | 1.63 | 14.2% | High |
| Zone 3 | 1.48 ha | 179 m | 75–110 m | 1.94–3.35 g/t | 2.14 | 14.1% | Medium |
| Zone 7 | 1.48 ha | 188 m | 67–102 m | 1.31–1.90 g/t | 1.91 | 10.3% | Low |
| Zone 4 | 1.33 ha | 149 m | 61–96 m | 1.54–2.06 g/t | 1.74 | 9.4% | High |
| Zone 1 | 0.96 ha | 120 m | 55–90 m | 1.95–2.85 g/t | 1.57 | 7.9% | High |
| Zone 6 | 0.52 ha | 90 m | 75–110 m | 1.20–2.13 g/t | 2.14 | 3.3% | Medium |
| All 8 zones | 13.18 ha | 55–110 m | 1.56–2.27 g/t | 1.85 weighted | 100% | 4 high, 3 medium, 1 low |
Source: Farmonaut satellite gold detection report for this property, 2026. Grade bands are the report’s P10 to P90 estimates. Strip ratio is tonnes of waste rock per tonne of target rock. Shares are of the report’s central gold estimate and are rounded.
Two zones stand out. Zone 5 is the largest target, at about 3.5 hectares and about 400 metres long, and it holds about a quarter of the gold in the report’s central estimate. Zone 8 holds about another sixth. Together, these two zones account for about 41% of the modelled gold, which is why the report puts them at the front of the drill programme.
Chart
Two zones hold about 41% of the modelled gold
Share of the report’s central gold estimate, %
Grades are given as bands, not single numbers. Across all eight zones, the report’s P10 to P90 range works out at about 1.56 to 2.27 grams of gold per tonne of rock. Grams per tonne, written g/t, tells you how much gold is estimated in each tonne. Several of the smaller zones, notably Zones 1, 2 and 3, carry higher grade bands than the two largest zones, which makes them strong follow-up targets.
On the same P10 to P90 basis, the report’s exploration target comes to about 7,800 to 11,300 troy ounces of contained gold, or about 243 to 353 kg, with a central estimate of about 10,000 ounces. Not all gold in the ground is recovered in a plant. Applying the report’s blended recovery assumption of 81% gives a band of about 6,300 to 9,200 ounces of recoverable gold.
If you want to test the same arithmetic on a target of your own, the calculator below turns tonnage and grade into contained gold and a gross value. Gross value is simply gold multiplied by price. It does not subtract mining, processing or any other cost, so it is a way to compare targets, not a forecast of profit.
Calculator
What is a gold target worth on paper?
Enter your own target. All amounts are in US dollars.
- Contained gold (kg): 10.0
- Contained gold (troy oz): 322
- Value after recovery (US$): $1,028,823
Example values only, not a benchmark, and not related to this project. 1 troy ounce is 31.1035 g. The gold price is an example, so check today’s price. Gross value is before mining and processing costs.
Depth, shape and strip ratio: what a first programme would face
A target is only useful if a project can reach it. The report answers three practical questions for each zone: how deep it starts, how deep it goes and how much waste rock sits around it.
The targets sit at a consistent depth. The report estimates that the tops of the zones lie between about 55 and 75 metres below the surface, and the bases between about 90 and 110 metres. That band is well within reach of standard diamond-core or reverse-circulation drilling, and it means every zone can be tested with holes of a similar length.
Chart
Estimated depth of the eight zones
Metres below surface, top to base of each zone
The zones are also long and fairly narrow, which fits the vein-style reading. Strike lengths run from about 90 metres for Zone 6 to about 400 metres for Zone 5, with average widths of about 75 to 210 metres. A long zone gives a drill programme room to step along its length, so one good intercept can be followed up quickly.
The strip ratio is the estimated tonnes of waste rock that would have to be moved for each tonne of target rock in a surface mine. Lower is better. Across the property, the tonnage-weighted strip ratio is about 1.85, with every zone between about 1.57 and 2.14. Surface gold operations commonly work with ratios well above that, so the depth of these targets would not by itself rule out a surface approach later on.
The report also rates access. Zone 1 has easy access, and the other seven are rated moderate. Mean slopes across the zones sit at about 9 to 19 degrees. That helps a field crew plan tracks and drill pads before the rig is booked.
Confidence tiers and the drill order
Not every target is equally certain, and the report says so plainly. It gives each zone a confidence tier, based on how strong its pixel-level signal is and how many independent checks agree with it.
- High confidence, 4 zones: Zones 1, 2, 4 and 5 hold about 55% of the modelled gold. These lead the drill programme.
- Medium confidence, 3 zones: Zones 3, 6 and 8 hold about 34%. Phase 1 field work resolves whichever signal disagrees.
- Low confidence, 1 zone: Zone 7 holds about 10%. It is a follow-up target once the first results are in.
The tiers set the order of work, not whether a zone is tested. Every zone stays in the programme, and the higher-confidence zones simply go first. That is a sensible way to spend a limited drilling budget: test the targets most likely to deliver, then let the results guide the rest.
For each zone, the report suggests a drilling direction, an angle of 70 degrees below horizontal, a hole length of about 115 to 140 metres and an estimated number of core holes. Each suggested hole points across the trend of its zone, because a hole drilled across a target tests it far better than one drilled along it.
Chart
Suggested core holes by target zone
Estimated number of holes, 28 in total across 8 zones
The report then sets out a phased plan, which is the normal way to explore a property like this:
- Phase 1, confirm the leaders: core drilling on Zone 5 and Zone 8, with a composite sample for metallurgical tests and detailed geological mapping across the zones.
- Phase 2, expand: confirmation holes on Zones 2, 3 and 7, ground magnetic and induced-polarisation surveys, and a first compliant resource estimate if the drilling supports one.
- Phase 3, define: closer-spaced infill drilling, environmental baseline studies and permitting work.
For budgeting, the report also gives a planning-grade figure for one confirmation hole in each of the eight zones: about 1,180 metres of drilling in all, or about US$176,000 to US$294,000 at an all-in rate of US$150 to US$250 per metre, and about 39 days for a single rig. A contractor’s quote replaces those figures once the plan is fixed.
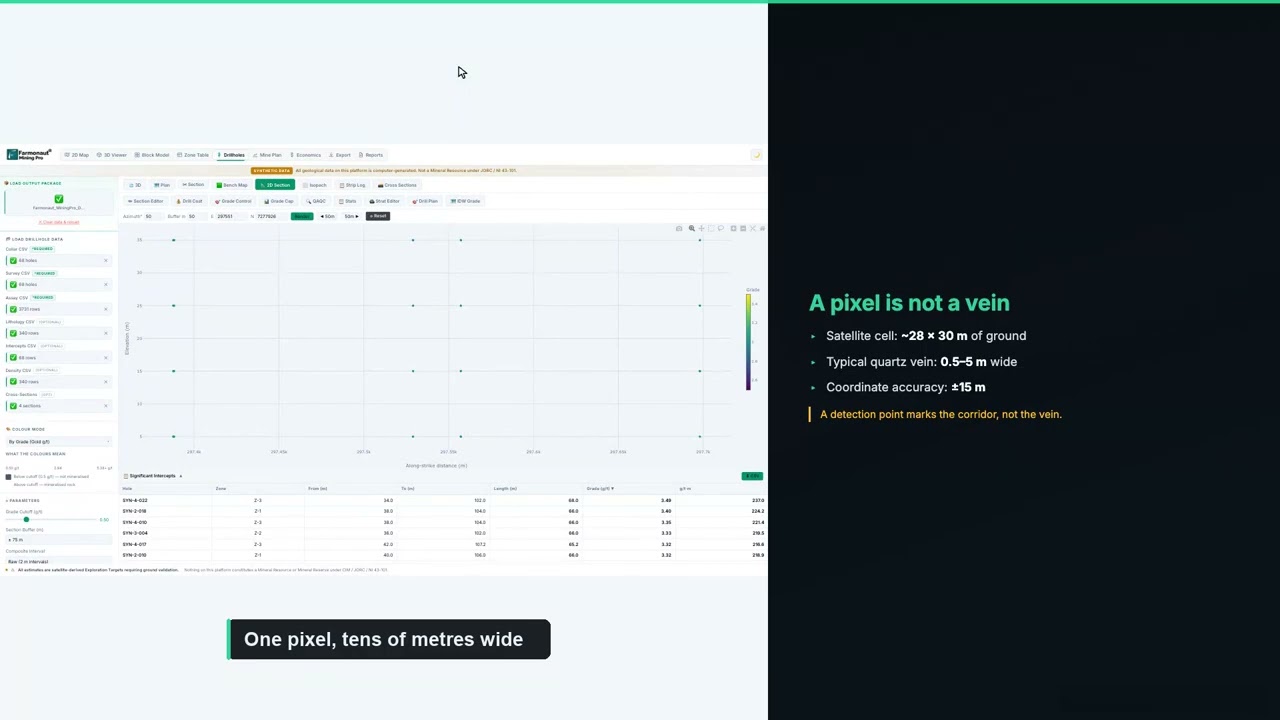
▶ How to plan a drilling programme once you have targets. · 5:49
If you are budgeting a similar programme, enter your own contractor’s rates below. The default values are round examples, not typical prices, because costs vary widely with location, rock type and rig availability.
Calculator
What would a first drill programme cost?
Enter your contractor’s quote. All amounts are in US dollars.
- Total metres: 1,176
- Cost per hole (US$): $30,650
- Single-rig days (excluding moves): 39.2
Example values only. The report’s planning band is an all-in US$150 to US$250 per metre for diamond core, including logging, assays and supervision. Costs vary with location, rock type and rig availability, so use real quotes from your contractor and laboratory.
What the client reported after the report
About six weeks after the report was delivered, the client completed our structured post-project feedback form. These are the client’s own recorded answers to fixed questions on that form. They are reproduced without alteration and are not presented as a quotation.
- Locations narrowed: yes. The analysis helped narrow down where to explore or drill.
- Exploration time saved: yes, in the band of 1 to 3 months.
- Exploration cost saved: yes, in the band of US$25,000 to US$50,000.
- Drilling so far: not yet drilled.
- Planned drilling: more than six months away.
Those answers show where the value of a satellite study lands on a pre-drill project. Nothing has been drilled, and yet the client recorded real savings in both time and money. The savings come from what no longer has to happen: weeks of walking and sampling the whole property to decide where to start, and the risk of a first drill campaign aimed at the wrong ground.
The timing also works in the operator’s favour. With drilling more than six months away, there is time to use the report well. A geologist can walk the eight zones, take rock-chip samples, check the gossans and adjust the collar positions. By the time a rig arrives, the first holes can go where the satellite data and the field evidence agree.
Lessons for desert gold explorers
Several parts of this project carry over to other gold properties in dry country, in the Southwest or anywhere with bare ground.
- Use the bare ground: arid terrain lets satellites see the rock, so a spectral study works especially well there. Make the most of it before any field spending.
- Screen the whole property at once: one pass over all of the ground ranks every zone against every other, so the order of work is clear from the start.
- Let concentration set the plan: when two zones hold about 41% of the modelled gold, those two are where the first holes should go.
- Respect the confidence tiers: drill the high-confidence zones first and let their results guide the medium and low tiers.
- Use the waiting time: if drilling is months away, field-check the targets now so the rig goes to the best collars.
- Budget from the report, then from a quote: planning figures help size the first programme, and a contractor’s quote fixes it.

▶ A documentary on the modern race to find new gold. · 10:44
Getting a similar study for your own ground follows the same steps. Send your boundary as coordinates, a KML or KMZ file, or a polygon, and name your target mineral. Delivery usually takes 5 to 20 business days, depending on the size of the area and the mineral. You can map your mining site yourself or get a quote from our team.
Want to see the same approach on other ground? Read how a gold explorer in Somalia went from satellite targets to drilling in our Somalia gold case study, or see how a pre-drill gold operator used its waiting time in our Zimbabwe drill-planning case study.
Desert gold exploration: frequently asked questions
What did desert gold exploration by satellite find on this property?
It found 8 gossan-style target zones on a property of about 240 acres in the southwestern United States. The zones cover about 13.2 hectares, or about 14% of the ground, and two of them hold about 41% of the gold in the report’s central estimate.
Why does satellite gold exploration work well in the desert?
Arid ground has little plant cover, so satellites see bare rock and soil. The altered minerals and iron oxides linked with gold reflect light in their own ways, and over bare ground those signals reach the sensor with little interference.
How much gold does the report estimate?
On a P10 to P90 basis, the report’s exploration target is about 7,800 to 11,300 troy ounces of contained gold, with a central estimate of about 10,000 ounces, at a grade band of about 1.56 to 2.27 g/t. This is an exploration target, not a resource.
How deep are the targets?
The report estimates that the tops of the zones sit about 55 to 75 metres below the surface and the bases about 90 to 110 metres down. Suggested core holes are about 115 to 140 metres long at 70 degrees.
How much time and money did the client save?
On our feedback form, the client selected the bands of 1 to 3 months of exploration time saved and US$25,000 to US$50,000 of exploration cost saved. These are the client’s own estimates for this project.
Has the property been drilled?
Not yet. Drilling is planned more than six months after the report. The report gives a phased plan, starting with core holes on Zone 5 and Zone 8.
Can a satellite detect gold directly?
No. Satellites detect signs linked with gold, such as altered rock, iron oxides and structures. The analysis combines those signs to rank where gold is more likely. Drilling and laboratory assays are what confirm gold and its grade.
What is a gossan?
A gossan is rust-coloured iron-oxide material that can cap a deposit. It forms when sulphide minerals weather near the surface, which makes it a useful clue about what may lie below.
Is this an S-K 1300, JORC or NI 43-101 resource?
No. The report gives a satellite-based exploration target, which comes before any resource estimate. A qualified person needs drilling and assay data to estimate a resource under S-K 1300, JORC or CIM definitions.
How long does a satellite gold report take?
Delivery usually takes 5 to 20 business days, depending on the size of the area and the mineral.
What do I need to send to get a report for my own ground?
Send your boundary as coordinates, a KML or KMZ file, or a polygon, along with your target mineral. Our team checks the boundary with you before the work starts.
Published in anonymised form. The client is not identified and did not provide a testimonial; no statement in this article is quoted from or attributed to them. The property boundary, coordinates, claim details and exact location are withheld. All resource figures are satellite-based exploration targets and are not Mineral Resources or Mineral Reserves under S-K 1300, JORC, NI 43-101 or similar codes. Time and cost savings are bands selected by the client on our feedback form.
Farmonaut mineral detection
Map your mining site from space
Send your claim or licence boundary as KML, KMZ or a polygon. Farmonaut returns ranked satellite exploration targets for it, usually in 5 to 20 business days.

Keep reading
Sources
- US Geological Survey, Mineral Commodity Summaries 2025: Gold: pubs.usgs.gov
- US Geological Survey, Gold statistics and information: usgs.gov
- Copernicus SentiWiki, Sentinel-2 mission: sentiwiki.copernicus.eu
- Copernicus SentiWiki, Sentinel-1 mission: sentiwiki.copernicus.eu
- NASA JPL, ASTER instrument: asterweb.jpl.nasa.gov
- JAXA EORC, ALOS-2 PALSAR-2: eorc.jaxa.jp
- NASA, MODIS: modis.gsfc.nasa.gov
- NOAA NCEI, Earth Magnetic Anomaly Grid (EMAG2): ncei.noaa.gov
- Copernicus Data Space, Copernicus DEM: dataspace.copernicus.eu
- Encyclopaedia Britannica, Gossan: britannica.com
- JORC, The JORC Code 2012 edition: jorc.org
- CIM, Definition Standards for Mineral Resources and Mineral Reserves: cim.org
- US eCFR, Regulation S-K subpart 1300 (mining property disclosure): ecfr.gov
- Bureau of Land Management, Mining claims: blm.gov
- US Mine Safety and Health Administration: msha.gov
- LBMA, Precious metal prices: lbma.org.uk
Discussion
Questions, corrections or field experience? Share them below. First-time comments are reviewed before they appear, and your email is never published.
No comments yet. Be the first to add a question or your experience.

 Double A Trading
 GemSprout Metals Limited
 Qader Group
 Ileys General Trading
 SG Gold Mining LLC
 VRV Global Pte Ltd
 Omsri International FZE
 G.I.T.T.
 Jaunita Erss Ltd
 Almosi SARL
 SRK Consulting
 Berks Gold Limited
 Mwerezi Minerals Company Limited
 Mining SARL
 SenGold Invest SAS
 Sean Mining Limited
 NTS Group (Pty) Ltd
 Mine4Africa

 Client · Oregon, USA · Gold










