

NSW geology data · Practical guide
Geological Map NSW: MinView, DIGS and Data
The geological map of NSW is in MinView, the Geological Survey of NSW web map with over 500 layers. This guide covers Seamless Geology, DIGS reports, geophysics, the main provinces and the exploration licence steps.
Key takeaways
- MinView, run by the Geological Survey of NSW, offers over 500 layers: geology, mineral occurrences, geophysics, drillholes and exploration titles (NSW Resources).
- NSW Seamless Geology has 11 lithotectonic layers; version 2.6 was released in May 2026 for ArcGIS Pro, QGIS and MapInfo (NSW Resources).
- DIGS holds over 140,000 reports and maps; company exploration reports become open file after a confidentiality period (NSW Resources).
- Explorers spent A$423.5 million in NSW in 2024-25; the Lachlan Orogen took A$147.2 million and the Murray Basin A$111.3 million (NSW Resources).
- An NSW exploration licence has an initial term of up to 6 years; the department’s timeframe is 45 days for a mineral licence (NSW Resources).
In this article
- Where to find the geological map of NSW
- MinView NSW: what is in it and how to use it
- NSW Seamless Geology: the GIS version of the geological map
- NSW geology in brief: the provinces that matter for explorers
- Geological ages behind the NSW map
- DIGS: reports, maps and past exploration results
- Geophysics, drillholes and core: the data under the map
- What explorers spend in NSW, by province and commodity
- NSW exploration licence: the process in outline
- A desk study for a NSW block in six steps
- Frequently asked questions
The geological map of NSW is published by the Geological Survey of NSW, part of NSW Resources, and you can open it online in MinView, a web map with more than 500 layers (NSW Resources, MinView). The same survey also gives you the NSW Seamless Geology data package for GIS, the DIGS report library, geophysical grids, drillhole records and the exploration title maps. This guide shows where each dataset sits, what is inside it, how to read it, and how the pieces fit with an exploration licence application.
The geology of New South Wales spans almost two billion years, from rocks about 1,700 to 1,600 million years old in the far west to young coastal sediments in the east (Geological Survey of NSW, geology overview). The Survey itself marked its 150th anniversary in 2025. If you are a licence holder, a consultant or an investor checking a project, the quickest way to understand a block of ground is to put the geology, the mineral occurrences, the geophysics and the title boundaries on one screen, and that is what the sections below show you how to do.
Where to find the geological map of NSW
There is no single file called “the NSW geological map”. There are five products, built for different jobs. Pick by what you want to do: look, analyse, print, or read the evidence behind a map.
| Product | What it is | Best for | Where |
|---|---|---|---|
| MinView | Web map with geology, mineral occurrences, titles, geophysics and drillholes | Quick look, title checks, small downloads | minview.geoscience.nsw.gov.au |
| NSW Seamless Geology | Statewide vector geology for GIS, split into time slices | Analysis in ArcGIS Pro, QGIS or MapInfo | Data.NSW listing |
| Standard geological maps | Map sheets at 1:250,000 and 1:100,000, plus some larger scales | Field work, reading the legend, printing | Maps page and DIGS |
| DIGS | Library of over 140,000 reports, maps and data files | Past exploration results and open file reports | search.geoscience.nsw.gov.au |
| Web services | WMS and WFS feeds of Seamless Geology | Loading the geology straight into your own GIS project | Links on the Data.NSW listing |
The Survey describes MinView as a web map application that lets you view, search and download a comprehensive range of geoscientific data for NSW, with supporting layers for current and historic exploration and mining titles, areas available for exploration and cadastral information (MinView). Data that the Survey makes available for download is licensed under Creative Commons Attribution 4.0 (NSW Resources), so you can reuse it in your own reports if you credit the source.
MinView NSW: what is in it and how to use it
MinView is the front door to the Survey’s data. Its layer list, as published by NSW Resources, includes the NSW Seamless Geology package, scanned and georeferenced maps (coalfields, coastal and metallogenic), geological basins and provinces, recorded mineral occurrences, statewide magnetic and gravity image merges, drillhole locations with sample information, drillcore locations at the Londonderry and Broken Hill core libraries, surface sample points with downhole geochemistry, geochronology, and the mining title layers (NSW Resources, MinView).
The tools matter as much as the layers. You can search by title, address, local government area or property. You can use extended spatial search to find data in other layers that sit inside a selected title or application. You can add your own points and polygons from KML, KMZ or CSV files, view surface and basement elevation in 3D, save sets of layers as “My views”, draw labels, print to PDF, and export to CSV. Registered users can set email alerts for exploration or mining title changes and expiry.
A simple walk-through for a first look at a block of ground
- Open MinView and search for the property, locality or title number so the map zooms to your area.
- Switch on NSW Seamless Geology. Read the legend for the rock units that cover your block, and note whether the unit is mapped at outcrop or projected under younger cover.
- Switch on mineral occurrences and click the points near your block. The records show the commodity and what the Survey has on file.
- Add the statewide magnetic image. Look for lines, breaks and rounded highs that line up with the mapped faults and intrusions.
- Turn on drillhole and surface sample layers to see where previous explorers have already looked, and which holes have downhole geochemistry.
- Add the title layers. Check whether your ground is held, under application, or listed as available for exploration.
- Save the view in My views, export what you need, and move to DIGS to read the reports behind the points.
The Survey also links a MinView user guide from the MinView page. If a layer does not appear after an update, the page suggests refreshing the browser with Ctrl and F5 (NSW Resources). Technical questions go to [email protected].
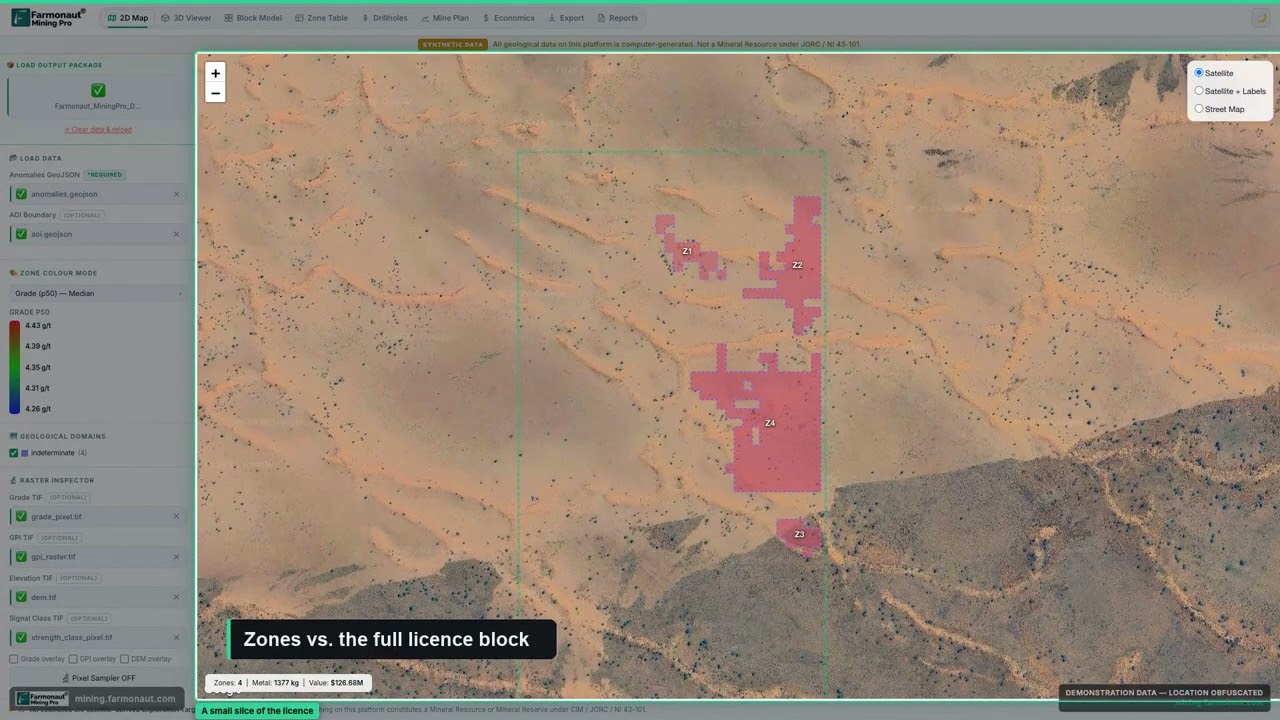
▶ Shows how to read a mining GIS map: licence boundaries, anomaly zones and live stats. · 5:38
NSW Seamless Geology: the GIS version of the geological map
NSW Seamless Geology is a GIS compilation of the best available vector geology for the state. It is organised into layers, called time slices, that each stand for a major lithotectonic unit. “Lithotectonic” means a package of rocks that formed in one tectonic setting, such as a volcanic arc or a sedimentary basin. All layers share one data structure, taken from the Survey’s Statewide Geology Geodatabase (Data.NSW, NSW Seamless Geology).
The dataset has 11 lithotectonic layers, listed from oldest to youngest: the Curnamona Province, Delamerian Orogen, Thomson Orogen, Lachlan Orogen, New England Orogen, Western Devonian Basins, Permo-Triassic Basins, Permo-Mesozoic Igneous Province, Great Australian Basin, Cenozoic Igneous Province and Cenozoic Sedimentary Province (Geological Survey of NSW). An orogen is a belt of rock that was folded, faulted and intruded during a mountain-building event. A single-layer version flattens the time slices into one surface geology map for a quick overview.
Version 2.6 was released in May 2026. It joins the best available mapping, at a variety of scales, and extends outcropping geology under younger cover. Packages are provided for ArcGIS Pro 3.5 or later (GDA94 and GDA2020), QGIS 3.34.15 or later (GDA94 and GDA2020) and MapInfo 11.5 or later (GDA94 only); ArcMap is no longer supported for this version, and versions 2.1 to 2.5 stay available as earlier editions (Seamless Geology project page). GDA94 and GDA2020 are two versions of the Australian geodetic datum; pick the one that matches the rest of your project data. Check the dataset’s last-updated date on Data.NSW before you cite a version, as the Survey updates the package as new mapping is added.
Download or stream it
You can download the package from the Survey’s search portal (product 9232 for GDA94, 9266 for GDA2020; single layer 9258 and 9267). If you prefer not to hold the files, the Data.NSW listing links WMS and WFS services. A WMS (web map service) sends a picture of the map to your GIS; a WFS (web feature service) sends the actual polygons and attributes, so you can filter and analyse them.
NSW geology in brief: the provinces that matter for explorers
Four of the 11 time slices matter most to explorers today. Their ages explain where the deposits sit, so it helps to know them before you open the map.
Curnamona Province and Broken Hill. In the far west, sediments and volcanic rocks were laid down in rift basins about 1,700 to 1,600 million years ago, then buried to 12 to 20 km and deformed. They host the Broken Hill silver-lead-zinc deposit, mined since 1883 (Geological Survey of NSW, statewide tectonics). The Survey maps the Broken Hill area at some of its largest scales, including 1:50,000 and 1:25,000 sheets (Maps page).
Lachlan Orogen. This belt takes the largest share of NSW exploration spending (see the spending section). It has Ordovician turbidites (490 to 460 million years old) and Macquarie arc volcanics (490 to 440 million years old). The Survey calls the Macquarie arc a world-class porphyry copper-gold province, with gold-copper deposits at Cadia, Northparkes, Lake Cowal and Browns Creek and major mineral accumulations at Cargo and Copper Hill; volcanic-hosted sulfide deposits at Captains Flat, Woodlawn, Currawang, Mt Bulga and Lewis Ponds; several large structurally controlled deposits in the Cobar Basin; and granite-related tin and gold (statewide tectonics). A porphyry deposit is a large, low-grade body of metal in and around an intrusion. Harmony Gold reported on 24 October 2025 that it had completed the acquisition of MAC Copper, owner of the CSA copper mine in the Cobar district, for US$1.01 billion in equity value (Harmony Gold). That tells you the Cobar Basin is still an active mining area.
New England Orogen. In the northeast, the rocks include Cambrian ophiolites, Ordovician blueschists, arc volcanics and granites, some of them antimony-bearing. The Peel Fault System carries scattered asbestos, chromite and gold, Halls Peak has felsic volcanic-hosted mineralisation, and the Late Permian to Triassic rocks host epithermal gold and base metal deposits (statewide tectonics). Epithermal deposits form from hot fluids close to the surface.
Thomson Orogen. North of the Lachlan, about 30 percent of its units lie less than 300 m below the surface, and the Survey calls it a new frontier for exploration (statewide tectonics). Cover is the main problem here, so geophysics and drillhole data carry more weight than outcrop mapping.
Across the whole state, gold, copper, zinc, silver and lead are the main metal products, and tin, tungsten, cobalt, scandium, antimony and other metals are listed as prospective (commodities page). Over 60 percent of NSW is covered by sedimentary basins, so many targets lie under younger rock (geology overview). For named gold mines and goldfields, see our guide to NSW gold mines and goldfields, and for Broken Hill output see Broken Hill mining. A state-by-state view is in the Australia mineral deposits map.
Geological ages behind the NSW map
The chart below plots the age spans the Survey gives for the main events behind the four belts above. Ages are in millions of years before present, so a larger number is older. The Curnamona rocks are more than three times older than the youngest Lachlan volcanics shown.
Chart
Age spans of the main NSW rock packages
Millions of years before present
DIGS: reports, maps and past exploration results
A map shows what the Survey knows. DIGS shows what explorers did. The Survey describes it as a publicly accessible online collection of reports, publications and data: exploration, geological, geotechnical and mining reports, maps, plans and heritage records, with over 140,000 documents (NSW Resources, DIGS). You can search by area on a map, by text, or with advanced filters, and you can save and share search lists. Existing DIGS account holders can use the same login in MinView.
Many documents are open file, which means anyone can read them. Company exploration reports for minerals, coal and petroleum stay confidential for a set period under the Mining Regulation 2016 and the Petroleum (Onshore) Act 1992. Reports are generally made open file when the title ends or the confidentiality period runs out (DIGS page). In practice, this means ground that has been dropped by a previous explorer can have a full set of open file reports once the confidentiality period has passed.
How to read the old reports
- Start with the final or relinquishment report. It sums up what the explorer did and why the ground was dropped.
- Check the assay tables and sample maps for any value that never got followed up, such as one isolated soil anomaly or a drill intercept at the edge of the grid.
- Note the line spacing and detection limits of old surveys. A survey run at a wide spacing 30 years ago can be re-flown today at a tighter spacing.
- Look at the hole depths. A programme that stopped at 60 m on ground with thick cover may not have reached fresh rock.
Search DIGS together with the mineral occurrence layer in MinView. The occurrence gives you a point and a commodity; the report gives you the evidence.

▶ Walks through the state geological map portals in Western Australia and how a Miner’s Right works there, for comparison. · 4:13
Geophysics, drillholes and core: the data under the map
Geological maps record what is visible at surface. Geophysical data fills the gaps where soil or sediment hides the rock. NSW Resources lists these statewide datasets (geophysical images and data):
| Dataset | Coverage and spacing | Formats and access |
|---|---|---|
| Magnetics | Statewide at 1,500 m line spacing, flown 1951 to 1980; about 87 percent of NSW since surveyed at 400 m or closer | 25 m cell grids (TMI, RTP, derivatives) as zip files, GeoTIFF images, MinView |
| Radiometrics (potassium, thorium, uranium) | Statewide, 25 m cell | Grids as zip files, ternary and single-element images as TIF, MinView |
| Gravity | About 71 percent of the state at 4 x 4 km or closer (ground); airborne surveys over the Sander, Xcalibur and Broken Hill regions | Bouguer and isostatic grids and images; ground and airborne data through MinView or GADDS |
| Airborne electromagnetics (AEM) | Government surveys in selected areas; measures ground conductivity to a few hundred metres | MinView, including 3D viewing of survey curtains |
| Seismic | Onshore and offshore surveys from 1950 to the present | SEG-Y files and grids through MinView; raw digital data on request |
Some terms: TMI is total magnetic intensity, the raw reading of the Earth’s magnetic field; RTP means reduced to pole, a processing step that places magnetic highs over their sources. Radiometrics measure the natural gamma rays given off by potassium, thorium and uranium in the top few tens of centimetres of ground, which helps map granites and altered rock. Gravity picks out dense or light bodies at depth. SEG-Y is the standard file format for seismic lines.
Drillhole locations, sample points and downhole geochemistry sit in MinView. Physical core is stored by the department: the Survey lists drillcore libraries at Londonderry (the WB Clarke Geoscience Centre) and Broken Hill (drillcore libraries). If a past explorer gave core to the state, you can look at the rock before you plan new drilling.
One quick sum helps with budgets. Line kilometres equal licence area divided by line spacing, so halving the spacing doubles the flying. The calculator below does this for a licence area you enter.
Calculator
How many line kilometres to survey my licence?
Enter your own licence area, line spacing and cost per line kilometre.
- Survey cost at your rate (A$): $7,500
- Line km at half the spacing: 1,500
Example values only, not a quote or a benchmark. Line kilometres equal area divided by line spacing. The cost per line kilometre (airborne magnetics) is a placeholder input, not a rate: use a current contractor quote. Money in A$.
What explorers spend in NSW, by province and commodity
The Survey’s annual exploration summary reports A$423.5 million of exploration spending in 2024-25 across minerals and coal, with A$225.9 million on mining titles, A$196.6 million on exploration titles and A$1.1 million on assessment titles. The Lachlan Orogen led with A$147.2 million, mostly for copper and gold, and the Murray Basin took A$111.3 million, nearly all for mineral sands (NSW exploration activity summary, 2024-25). Drilling totalled 926 km, 65 percent of it for minerals. The total number of titles has doubled since 2010 to over 2,200.
Chart
Share of exploration spending by commodity
Percent of total spending, estimated from a sample of reports, 2024-25; eight of the top ten commodities shown
Chart
Exploration spending by geological province
A$ million, minerals and coal, 2024-25 financial year, selected provinces
By commodity, the Survey estimates mineral sands at 25 percent of spending, coal 22 percent, gold 19 percent and copper 13 percent, with silver at 5 percent, lead and zinc 3 percent each, and cobalt, scandium and iron 2 percent each. The report notes the shares are estimates from a sample of exploration reports, and that spending on multi-commodity projects is split equally.
Read the numbers as a guide to where the data is thickest. Ground in the Lachlan Orogen and Cobar Basin sees the most spending, so the DIGS record there is likely to be deep. The Thomson Orogen, with A$2.7 million, and the Delamerian Orogen, with A$4.1 million, have far less, so a new dataset there goes further.
NSW exploration licence: the process in outline
To explore for minerals or coal in NSW you need an exploration licence or an assessment lease, both known as prospecting authorities, and the holder gets exclusive rights to explore for specific minerals in the area (NSW Resources, exploring NSW). The rules sit in the Mining Act 1992 and Mining Regulation 2016. This section is a summary; confirm the details with NSW Resources before you apply.
Infographic
Exploration licence in 5 steps
- 1Check the groundSearch MinView for existing titles and areas available for exploration.
- 2Prepare the applicationChoose graticular units, a term of up to 6 years and a work program.
- 3Lodge in TMSSubmit through the Titles Management System and pay the fee.
- 4AdvertisePublish the public notice within 45 days of lodging.
- 5AssessmentThe department checks capability, native title and compliance, then decides.
- Area. Explorers for minerals use the graticular system of blocks and units, which you can view in MinView. Coal explorers use GPS coordinates (NSW Resources, application phase).
- Term. An exploration licence has an initial term of up to 6 years. Renewals are lodged up to 3 months before expiry (exploring NSW).
- Lodging. Applications go through the Titles Management System, which tracks status, takes online payment of fees, and holds correspondence (Titles Management System).
- Public notice. The explorer advertises the proposed area within 45 days of lodging, in a newspaper widely read in NSW and a local one. Landholders do not get direct notice; applications appear in the Mining Titles Register, MinView and the NSW Government Gazette (application phase).
- Native title and land access. Applicants must show how native title obligations under the Commonwealth Native Title Act 1993 will be addressed, and a written land access arrangement with the landholder is needed before exploring.
- Fees and security. The Mining Act fee schedule lists a A$1,000 application fee for an exploration licence, with annual charges set per unit (Mining Act fees). Every holder must also lodge a security deposit to cover rehabilitation, with a minimum of A$10,000 at the application stage.
- Timing. The department’s processing timeframe is 45 days for a mineral licence and 85 days for coal, and the clock can be paused. The decision looks at the work program, technical and financial capability and compliance history.
Use MinView first to check that the area is not already held. For a plain-English summary of fossicking and small-scale licences, see our guide to the gold licence in NSW.
A desk study for a NSW block in six steps
Put the datasets together in an order that saves money. The goal is a short list of targets you can defend, based on evidence you can cite.
- Define the block in MinView and note the title status.
- Read the Seamless Geology units and the nearest 1:100,000 or 1:250,000 map sheet and its notes.
- List all mineral occurrences, drillholes and geochemistry points within and around the block.
- Pull the magnetic, radiometric and gravity grids into GIS and mark features that match the mapped geology.
- Download the DIGS reports for the area and record what was tested, to what depth and with what result.
- Rank targets by how many independent lines of evidence agree, then plan field checks and sampling.
Satellite imagery can add one more layer at step 4. It maps surface and near-surface signatures such as iron oxide, clay and silica alteration, and it works over bare ground. Sampling and drilling confirm what the satellite suggests. Farmonaut offers a satellite mineral report for a licence area, delivered in 5 to 20 business days, as an exploration target screen that comes before a resource estimate. Our guide to how satellite mineral exploration works covers the method, and the page on satellite-based mineral detection shows the service.
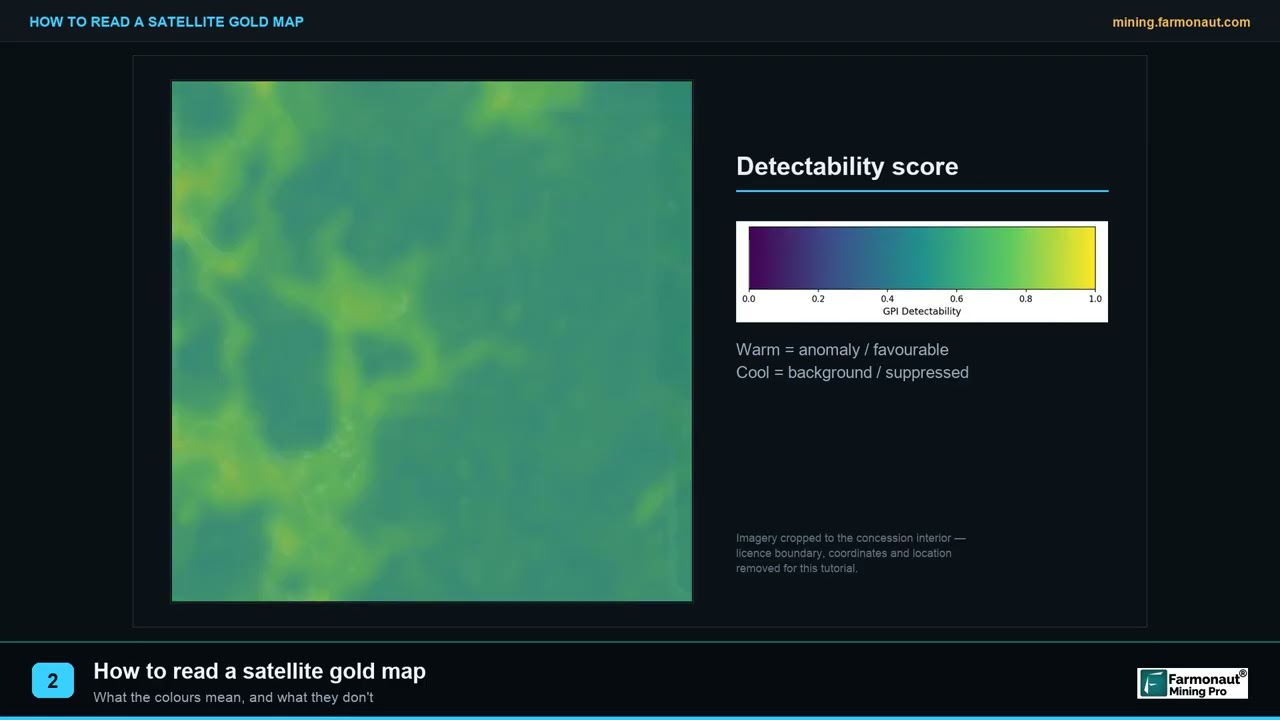
▶ Explains how to read a satellite prospectivity map panel in an exploration report. · 1:40
Frequently asked questions
Where can I see a geological map of NSW online?
Open MinView at minview.geoscience.nsw.gov.au. It shows the NSW Seamless Geology with a stratigraphic legend, plus titles, mineral occurrences and geophysics. Map sheets can also be previewed and downloaded in DIGS.
What is MinView NSW?
It is the Geological Survey of NSW’s web mapping application. It lets you view, search and download geoscience data for the state, add your own KML or CSV data, save map views and set email alerts for title changes (NSW Resources).
What is the Geological Survey of NSW?
It is the state’s geoscience agency, part of NSW Resources within the Department of Primary Industries and Regional Development. It publishes maps, reports, geophysics and drillcore libraries, and celebrated its 150th anniversary in 2025.
What is NSW Seamless Geology?
It is a statewide GIS compilation of the best available vector geology, split into 11 lithotectonic layers plus a single-layer surface version. Version 2.6 came out in May 2026 for ArcGIS Pro, QGIS and MapInfo.
What is DIGS in NSW?
DIGS is the Survey’s online library of over 140,000 reports, maps and datasets. Many are open file, and company exploration reports are released after their confidentiality period ends.
Can I download the NSW geology data for use in QGIS?
Yes. The Seamless Geology package comes in QGIS 3.34.15 or later format in GDA94 and GDA2020, or you can load the WMS or WFS feed. The data is licensed under Creative Commons Attribution 4.0, so credit the Survey when you reuse it.
What scale are the NSW geological maps?
The standard series is at 1:250,000 and 1:100,000, with the 1:100,000 scale used for current and future products. The state is almost completely mapped at 1:250,000. A few areas, mainly Broken Hill and the coalfields, have 1:50,000 and 1:25,000 maps.
How do I get an exploration licence in NSW?
Apply through the Titles Management System under the Mining Act 1992. You advertise the area, address native title and land access, pay the fee and lodge a security deposit. The initial term is up to 6 years. Confirm the current rules with NSW Resources.
How long does an NSW exploration licence take to process?
The department’s timeframe is 45 days for a mineral licence and 85 days for coal, though the clock can be paused while information is missing.
Which are the main mineral provinces of NSW?
The Lachlan Orogen (Cadia, Northparkes, Lake Cowal and the Cobar Basin), the Curnamona Province (Broken Hill), the New England Orogen, and the Thomson Orogen, which is still lightly explored.
Does the NSW geological map show where to find gold?
It shows the rocks, faults and recorded gold occurrences, which are the starting evidence. Gold from Lower Palaeozoic rocks, 470 to 400 million years old, drove the early gold rushes (Geological Survey of NSW). The map does not show unrecorded deposits, so sampling and drilling still decide.
This page is for information only. It is not legal advice or investment advice. Licence rules, fees and datasets change; confirm them with NSW Resources before you apply. Get the landholder’s permission before you enter any land.
Farmonaut mining
Screen your NSW licence from space
Request a quote for a satellite mineral report on your licence area, an exploration target screen to use before sampling and drilling.
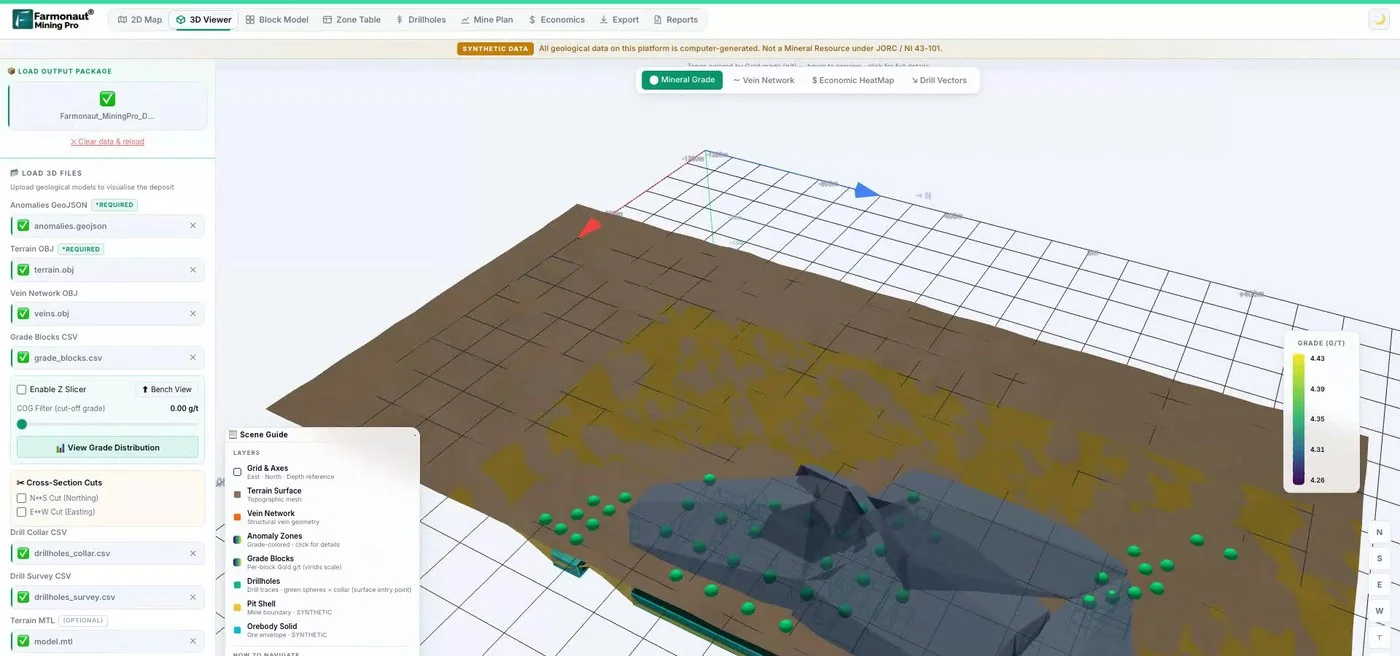
Mining Pro sample view, synthetic data
Sources
- NSW Resources, Geological Survey of NSW: resources.nsw.gov.au
- NSW Resources, MinView: resources.nsw.gov.au
- Geological Survey of NSW, MinView web map: minview.geoscience.nsw.gov.au
- NSW Resources, NSW Seamless Geology project: resources.nsw.gov.au
- Data.NSW, NSW Seamless Geology: data.nsw.gov.au
- NSW Resources, DIGS: resources.nsw.gov.au
- Geological Survey of NSW, DIGS search portal: search.geoscience.nsw.gov.au
- NSW Resources, geophysical images and data: resources.nsw.gov.au
- NSW Resources, geological maps: resources.nsw.gov.au
- NSW Resources, geology of NSW: resources.nsw.gov.au
- NSW Resources, statewide tectonics: resources.nsw.gov.au
- NSW Resources, commodities: resources.nsw.gov.au
- NSW Resources, drillcore libraries: resources.nsw.gov.au
- NSW Resources, exploring NSW: resources.nsw.gov.au
- NSW Resources, landholders guide: application phase: resources.nsw.gov.au
- NSW Resources, Mining Act fees: resources.nsw.gov.au
- NSW Resources, Titles Management System: resources.nsw.gov.au
- NSW Resources, exploration activity summary 2024-25: resources.nsw.gov.au
- Harmony Gold, completion of MAC Copper acquisition (24 October 2025): harmony.co.za
Discussion
Questions, corrections or field experience? Share them below. First-time comments are reviewed before they appear, and your email is never published.
No comments yet. Be the first to add a question or your experience.

 Alkimy SARL
 Double A Trading
 GemSprout Metals Limited
 Qader Group
 Ileys General Trading
 SG Gold Mining LLC
 VRV Global Pte Ltd
 Omsri International FZE
 G.I.T.T.
 Jaunita Erss Ltd
 Almosi SARL
 SRK Consulting
 Berks Gold Limited
 Mwerezi Minerals Company Limited
 Mining SARL
 SenGold Invest SAS
 Sean Mining Limited
 NTS Group (Pty) Ltd

 Client · Oregon, USA · Gold










