

Australia · Exploration data
Australia Copper vs Gold Exploration: Spend and Finds
Gold took 45% of Australian mineral exploration spend in the 12 months to June 2026 (A$1.93 billion) and copper 11% (A$454 million). See the ABS numbers by state, drilling metres and new resources.
Key takeaways
- Gold exploration spend was A$1,933.5 million and copper A$454.2 million in the 12 months to June 2026 (ABS, summed from quarterly data).
- Copper spend fell 18.5% in 2025 to A$469.7 million (from A$576.3 million) while gold rose 34% (ABS, summed from quarterly data; Geoscience Australia).
- Western Australia took 81% of gold exploration spend but only 5.5% of its own spend went to copper; in South Australia copper was 52%.
- Explorers drilled 10.66 million metres in 2025; the ABS does not split metres by commodity.
- Of 69 maiden Mineral Resources in 2025, gold appeared in 34 and copper in 13 (Geoscience Australia).
In this article
- How much is spent on copper and gold exploration in Australia
- Gold exploration spending in Australia: why gold leads
- Copper exploration in Australia: spend falls while demand talk rises
- Ten-year trend: copper versus gold exploration spend
- Where the money goes: spending by state
- Australian exploration drilling metres
- New deposits or existing deposits: where the drilling goes
- Copper discoveries in Australia and how discoveries are counted
- What is in the ground: Australian copper and gold resources
- Compare spend with new resources: calculator
- How to read the ABS mineral exploration data yourself
- Checking ground in Western Australia, the heart of the gold spend
- Using satellite data to screen copper and gold ground
- What the numbers mean for licence holders and investors
Australia copper versus gold exploration is not a close contest on spending. In the 12 months to June 2026, private explorers reported A$1,933.5 million spent looking for gold and A$454.2 million looking for copper, a ratio of about 4.3 to 1, according to the Australian Bureau of Statistics (ABS, June quarter 2026 release, figures summed by us from the quarterly series). Gold took 45% of all mineral exploration spend; copper took 11%. The gap has widened in the last year, because gold spending jumped while copper spending slipped.
This page sets out the numbers behind that gap: spend by commodity, the ten-year trend, the state split, metres drilled, what each commodity has actually produced in new resources, and how to pull the same data yourself. It is written for licence holders, consultants and investors who want figures they can trace to a statistics office or a geological survey. All dollar amounts are Australian dollars (A$) and are not adjusted for inflation.
How much is spent on copper and gold exploration in Australia
The ABS runs a quarterly census of private companies that explore for minerals. It counts all spending in the exploration and evaluation stages, whether the company capitalises it or not, and it covers actual and expected spend (ABS methodology notes). The release was formerly catalogued as 8412.0, which is why many people still search for “ABS mineral exploration” by that number. The June 2026 quarter was published on 31 August 2026, and the next release, for the September quarter, is due on 30 November 2026.
Chart
Exploration spend by mineral sought
A$ million, 12 months to June 2026, original series
In the June 2026 quarter, total mineral exploration spend was A$1,142.9 million on a seasonally adjusted basis, up 3.9% on the March quarter and 17.9% on a year earlier. Gold alone was A$565.6 million in the original (not seasonally adjusted) series, and copper was A$124.3 million. Original figures swing with the seasons: compare a quarter with the same quarter a year earlier, or add up four quarters as we do in the table below.
| Mineral sought | 12 months to Jun 2026 (A$m) | Share of all minerals | Change on prior 12 months |
|---|---|---|---|
| Gold | 1,933.5 | 45.3% | +47.8% |
| Iron ore | 820.1 | 19.2% | +0.7% |
| Copper | 454.2 | 10.6% | -14.8% |
| Coal | 229.2 | 5.4% | -15.2% |
| All minerals other than petroleum | 4,267.1 | 100% | +11.4% |
The table comes from the ABS time-series workbook for expenditure by mineral sought (ABS Table 5, June 2026), original series, total deposits, Australia. The shares and changes are our arithmetic on four quarters each. ABS publishes its own chart category called “selected base metals”, which is copper plus silver-lead-zinc plus nickel-cobalt (A$676.3 million over the same 12 months). That is why headline ABS commentary rarely says “copper” on its own, and why you need the Table 5 workbook to isolate it.
Copper is the third-largest single target after gold and iron ore. It outspends every other base metal by a wide margin: nickel-cobalt drew A$121.0 million and silver-lead-zinc A$101.1 million in the same period.
Gold exploration spending in Australia: why gold leads
Gold leads for three reasons. The first two come from Geoscience Australia (GA); the third is general geology.
First, price. GA’s Australian Mineral Exploration Review notes that gold hit a record of about US$4,300 an ounce (roughly A$6,000) in 2025, helped by US interest-rate cuts that sent investors toward gold as a safe asset (Geoscience Australia, AMER 2025). A higher price means more drill targets can pay, so explorers have reason to raise budgets. Gold spend rose 34% in calendar 2025 and, on the current ABS series, reached A$1,606.6 million, slightly above 2021 (A$1,598.7 million), the previous high on the same series.
Second, risk. GA says the high gold price is driving more exploration in lower-risk areas with well-understood geology and existing infrastructure. GA’s maiden-resource map shows a concentration of new resources in the Yilgarn region of Western Australia, an established gold region. Near existing infrastructure, a modest find is easier to bring to a decision than one in a remote basin.
Third, how the targets differ. Orogenic gold, the type that contributes the largest share of Australia’s gold production, forms along shear zones in old rock belts, and many such targets can be tested with relatively shallow drilling. Copper systems such as porphyries and iron-oxide copper-gold deposits are often large and can sit under cover, so a first hole is rarely enough to judge a project. That is general geology, not a figure from the ABS.
GA also notes the main gold deposit types in Australia: iron oxide copper-gold, porphyry and orogenic, with orogenic deposits contributing the largest share of production (GA, AMER 2025 drill results). For a plain-language walk through the process that follows a gold find, from drilling to refined metal, see the video below.
▶ How gold is mined and refined, from drilling the rock to the finished metal. · 5:27
Copper exploration in Australia: spend falls while demand talk rises
Copper exploration spend peaked in calendar 2023 at A$660.9 million on the current ABS series, then fell to A$576.3 million in 2024 and A$469.7 million in 2025. That is an 18.5% fall in 2025 on the current ABS series, and GA calls it a continuation of the downward trend from the year before, “notwithstanding a strong copper market in 2025” (AMER 2025). In plain terms: the story that the world needs more copper has not yet turned into more Australian copper drilling.
The June 2026 quarter shows a bounce, with A$124.3 million, up from A$96.2 million in the March quarter. That is a quarter-on-quarter move in the original series, and the June quarter a year earlier was A$122.6 million, so it is flat year on year. One quarter is not a trend. Watch the 30 November 2026 release before reading anything into it.
Why would copper lag when demand forecasts are strong? Four explanations are consistent with the sources, and we state them as explanations, not proof:
- Capital is following gold, as GA points out when it says the rise in gold spend offset falls in nickel-cobalt and copper.
- Discovery is slow and costly. MinEx Consulting reports that since 2010 the world found 207 million tonnes of copper in 54 deposits but mined 272 million tonnes (MinEx Consulting, IMARC 2025).
- Turning a find into a mine is hard. MinEx says fewer than 15% of copper deposits are developed within 20 years of discovery, because of poor project economics and environmental and social hurdles.
- Australia already has a large copper inventory (see the resources section below), which lets companies grow existing mines instead of searching new ground.
For the ASX-listed juniors that drill for both metals, see our guide to Australian mining exploration companies.
Ten-year trend: copper versus gold exploration spend
Looking across calendar years shows how different the two paths are. Gold spend climbed almost every year from 2015 to 2021, dropped from 2022 to 2024 then jumped again in 2025. Copper rose from 2016 to 2023 and has fallen two years in a row since.
Chart
Gold and copper exploration spend, calendar years
A$ million, original series
| Calendar year | Gold (A$m) | Copper (A$m) | All minerals (A$m) | Gold share | Copper share |
|---|---|---|---|---|---|
| 2015 | 475.9 | 121.0 | 1,438.6 | 33.1% | 8.4% |
| 2019 | 1,068.0 | 414.9 | 2,648.4 | 40.3% | 15.7% |
| 2021 | 1,598.7 | 550.2 | 3,596.1 | 44.5% | 15.3% |
| 2023 | 1,242.5 | 660.9 | 4,260.6 | 29.2% | 15.5% |
| 2025 | 1,606.6 | 469.7 | 3,949.7 | 40.7% | 11.9% |
Two readings stand out. Copper’s share of total spend roughly doubled from 8% in 2015 to a peak near 16% in 2019, stayed between 12% and 16% to 2024, then slipped to 12% in 2025 and 11% over the latest 12 months. Gold’s share swung more, from 29% in 2023 to 41% in 2025. So the idea that copper is quietly taking over from gold in Australian exploration is not what the statistics show for 2024 to 2026. The copper rise was real, but it ran from 2016 to 2023.
The shares are our calculation from the ABS Table 5 workbook, summing the four original-series quarters of each calendar year. Figures can be revised by the ABS in later releases, which is why the 2025 gold total here (A$1,606.6 million) is a little higher than the A$1,597.1 million shown in GA’s review, which used the December 2025 release.
Where the money goes: spending by state
Western Australia dominates both metals, but in very different proportions. Over the 12 months to June 2026, WA took 70% of all national mineral exploration spend (A$2,983.6 million of A$4,267.1 million). Of Australian gold exploration spend, WA took 81% (A$1,570.8 million of A$1,933.5 million). Copper is spread more evenly across the states.
Chart
Copper and gold as a share of each state’s exploration spend
%, 12 months to June 2026; South Australia not shown because ABS withholds its gold figure (SA copper was 52% of spend)
| State or territory | Copper (A$m) | Gold (A$m) | All minerals (A$m) |
|---|---|---|---|
| Western Australia | 162.9 | 1,570.8 | 2,983.6 |
| South Australia | 108.0 | not published | 208.6 |
| Queensland | 101.8 | 80.1 | 465.9 |
| New South Wales | 60.8 | 96.6 | 296.1 |
| Northern Territory | 14.6 | 58.2 | 127.8 |
| Victoria | not published | 93.7 | 129.2 |
“Not published” means the ABS did not publish at least one quarter of the series. The figures are sums of four original-series quarters from the state-level mineral workbook (ABS Table 5) and the state totals workbook (ABS Table 4).
The table shows a pattern that the national totals hide. In South Australia, copper was 52% of the state’s exploration spend. In Queensland it was 22%, higher than gold’s 17%. In New South Wales it was 21% against gold’s 33%. In Western Australia, copper was just 5.5% of spend and gold was 53%. Victoria is the opposite case: gold was 73% of its spend, and no separate copper figure is published.
For a licence holder, that means the “copper versus gold” question has a local answer. If your ground is in the Yilgarn, you compete with a huge gold budget for drill rigs, geologists and assay time. If it is in South Australia, Queensland or NSW, copper is a normal target and the local data sets are built around it. Our guide to the biggest mining companies in Western Australia shows who holds the ground in the state that leads both lists.
Australian exploration drilling metres
Spend is one measure; metres drilled is another. In calendar 2025 Australian explorers drilled 10,659,000 metres, up 11.4% on 2024, according to GA’s review of ABS data (AMER 2025). In the 12 months to June 2026, the quarterly ABS series sums to about 11.8 million metres, up from about 10.0 million in the year to June 2025, an increase of 18.7%. The June 2026 quarter alone was 3.46 million metres in the original series, up 29.1% on the same quarter a year earlier. The seasonally adjusted figure was 3.17 million metres.
Chart
Metres drilled in 12 months to June
Million metres, all minerals, original series
The ABS does not split metres drilled by commodity. You cannot read “metres drilled for copper” or “metres drilled for gold” from its tables. What it does split is metres at existing deposits, where explorers extend or infill a known resource, and at new deposits, where they test unknown or unclassified mineralisation. Of the 3.46 million metres in the June 2026 quarter, 2.64 million were at existing deposits and 0.82 million at new deposits.
Annual drilling in the 12 months to June 2026 is still a little below the 12 months to June 2021 (about 12.4 million metres), while spend over the same 12 months rose from A$3.16 billion (to June 2021) to A$4.27 billion (to June 2026). More dollars for fewer metres is consistent with rising drilling costs, though the ABS does not report unit costs.
New deposits or existing deposits: where the drilling goes
The ABS splits spend into “existing deposits” (formerly called brownfields) and “new deposits” (greenfields). In calendar 2025 only 25.8% of spend, about A$1.0 billion, went to new deposits, a fall of 9.6% on 2024, while A$2.9 billion went to ground around known deposits. Drilling at new deposits was 2.37 million metres, against 8.29 million at existing ones (GA, AMER 2025).
GA’s explanation is that costs are rising in areas that are not established mining regions, and investors prefer operating mines and extensions to higher-risk exploration. That matters for the copper-versus-gold comparison. The ABS does not split new-deposit spend by metal, so the effect on copper versus gold cannot be read from these figures. Greenfields drilling, where new discoveries have to start, is the type of work that has been squeezed. In the 12 months to June 2026, new-deposit spend was A$1,053.4 million, or 25% of the total, and existing-deposit spend was A$3,213.7 million.
Copper discoveries in Australia and how discoveries are counted
People searching for “copper discoveries Australia” usually want a list of recent finds. Counts differ by source, because a “discovery” can mean a new drill intercept, a first resource estimate, or a deposit large enough to matter. There are two useful public measures.
The first is the maiden Mineral Resource. A maiden resource is the first resource estimate reported under a code such as the JORC Code for a new deposit or a new commodity. GA counts them from ASX announcements. In 2025 it counted 69 maiden resources from 50 projects, up from 45 projects in 2024 but below the 77 projects of 2023. Gold appeared in 34 of the 69 and copper in 13 (GA, AMER 2025 maiden Mineral Resources). Many of those are small, and a project can list more than one commodity, so these are counts of commodities reported, not of separate copper mines. Resource estimates in this list are exploration results, not guarantees of a mine.
The second is MinEx Consulting’s worldwide discovery database, built from S&P Global data and company reports. In a 2023 conference presentation, MinEx counted 126 discoveries in Australia since 2012, with a further 27 it estimated were not yet reported, out of 737 worldwide (MinEx Consulting, IMARC 2023). Over 2012 to 2021, Australia accounted for 12% of global exploration spend but 18% of discoveries by number, and captured 22% of the value MinEx estimates exploration created. The map in that presentation labels Australian finds that include Gruyere (gold, 2013), Havieron (gold, 2018), Oak Dam (copper, 2018), Hemi (gold, 2019) and Boda (gold-copper, 2019). The label list is MinEx’s, and the slide shows examples, not a full list.
One well-known recent copper-gold find is Winu in Western Australia. Rio Tinto says it discovered mineralisation there in 2017 and describes Winu as a copper-gold deposit in the Great Sandy Desert, about 320 kilometres east of Port Hedland. It signed a definitive joint-venture agreement with Sumitomo Metal Mining in May 2025 (Rio Tinto, Winu project page). We cover the geology and the district in our post on the Winu copper discovery in the Paterson Province.
Note that many of the largest “copper” discoveries are copper-gold. That is one reason a clean copper-versus-gold split is hard: the same drilling can count toward both, and the ABS records spend under the commodity the company says it is looking for, not under every metal in the rock.
What is in the ground: Australian copper and gold resources
Spend only makes sense next to what the country already has. Geoscience Australia’s preliminary 2026 tables give figures as at 31 December 2025; Ore Reserves, Measured, Indicated and Inferred Resources and reserve life in the first rows cover operating mines only (GA, Australia’s Identified Mineral Resources 2026). The full report is due in late 2026.
| Measure (end 2025) | Copper | Gold |
|---|---|---|
| Operating mines | 29 | 179 |
| Ore Reserves (operating mines) | 18.87 Mt Cu | 3,582 t Au |
| Measured and Indicated Mineral Resources (operating mines) | 82.74 Mt Cu | 7,788 t Au |
| Inferred Mineral Resources (operating mines) | 26.10 Mt Cu | 3,306 t Au |
| Mine production in 2025 | 0.73 Mt Cu | 314 t Au |
| Reserve life, operating mines (reserves divided by production) | 26 years | 11 years |
| Economic Demonstrated Resources | 107.95 Mt Cu | 13,352 t Au |
Terms: an Ore Reserve is the part of a resource shown to be economic to mine. Measured, Indicated and Inferred are confidence levels for a Mineral Resource, from highest to lowest. Reserve life is simple division, not a forecast. Economic Demonstrated Resources is GA’s national measure of resources that are economic and well-defined.
The reserve-life row helps explain the spend gap. Australia’s national Ore Reserves cover about 15 years of gold and 34 years of copper at the 2025 production rate (4,848 t Au and 25.03 Mt Cu, GA Table 2); at operating mines alone the figures are 11 and 26 years. A producer with only 11 years of gold in reserve has a reason to keep drilling to replace what it mines. That is an interpretation, not a statement from GA, but it fits the pattern: gold producers explore to keep mines running, while copper producers can plan expansions on a longer inventory.
Compare spend with new resources: calculator
The calculator below uses 2025 figures from the ABS and GA, which you can replace with your own. It divides each commodity’s spend by the number of 2025 maiden Mineral Resources that reported it. Read the result as a rough measure of how much money sat behind each resource announcement, not as the cost of a discovery. Spend includes work at existing mines, and maiden counts include small resources and by-products.
Calculator
How much spend sat behind each maiden resource?
Defaults are 2025 figures from the ABS and Geoscience Australia; type your own.
- Copper spend per maiden copper resource (A$m): 36.1
- Gold spend as a multiple of copper spend: 3.4 x
- Copper share of gold plus copper spend (%): 22.6 %
Defaults: 2025 gold and copper spend (ABS, A$ million) and 2025 maiden Mineral Resources reporting each metal (Geoscience Australia, 34 and 13). A rough ratio, not the cost of a discovery: spend includes work at producing mines and maiden counts include small and by-product resources.
How to read the ABS mineral exploration data yourself
You can reproduce every figure on this page from public files. The steps are short.
- Open the ABS release page for Mineral and Petroleum Exploration, Australia and scroll to “Time series spreadsheets”.
- Download Table 5, expenditure by mineral sought, and Table 4, expenditure by state and territory. Both are Excel workbooks with a “Data1” sheet.
- Pick the series type. “Original” is the raw quarterly number. “Seasonally adjusted” and “trend” smooth out seasons. For totals over a year, use the original series.
- In Table 5, columns are named by state, mineral and deposit type. For national copper spend, find “Expenditure ; Australia ; Copper ; Total deposits” and read the original series.
- Add four consecutive quarters for a rolling 12-month figure, or the four quarters of a calendar year for annual totals.
- Check blanks. A blank in a state column means the ABS published no figure for that quarter, which is not the same as zero spend.
The ABS also offers a Data Explorer version of the quarterly mineral series, and GA’s review publishes its own tables and maps for download (GA news release on AMER 2025). Expenditure is nominal and covers private companies only, so government geoscience spending is not in it.
Checking ground in Western Australia, the heart of the gold spend
Western Australia has the most exploration spend and one of the best public data sets. GeoVIEW.WA, run by the state’s Department of Mines, Petroleum and Exploration, is an online map that lets you view geology, mines, mineral deposits and active leases, and print custom maps. Its search tools include WAMEX, a spatial and text search of open-file mineral exploration reports, plus a drillholes search compiled from those reports, geochemistry and historical tenement maps (Government of Western Australia, GeoVIEW.WA).
Before you apply for ground or pay for drilling, search the area in WAMEX. Past drill holes, assays and company reports show what has already been tried, which saves money on both copper and gold targets. Other states have their own portals; for New South Wales, MinView gives access to geoscientific data and exploration and mining titles (NSW Department of Primary Industries and Regional Development, MinView). Our NSW geological map guide shows how to use it.

▶ How to read GeoVIEW.WA, WAMEX, MINEDEX and Tengraph before you prospect in Western Australia. · 4:13
Using satellite data to screen copper and gold ground
Surface data is the cheapest layer to add before drilling. Satellites map surface and near-surface signatures: iron-oxide staining, clay and mica alteration, silica and structural lines. Both gold and copper systems can leave such signs, and the mix differs. Porphyry and iron-oxide copper systems often show strong clay and iron signatures over wide areas, while orogenic gold may show narrower alteration along shear zones. Sampling and drilling confirm what the imagery suggests.
A Farmonaut satellite mineral report outlines exploration targets on a licence boundary, so you can decide where to sample first. It does not give a resource estimate. To plan a first-year budget around such screening, see our guide to a first-year exploration budget for a small licence. For a comparison with another large explorer, see how Canada’s exploration spending breaks down in NRCan data.

▶ What satellites can and cannot see: rust stains, clay minerals and faults around a deposit, not the metal itself. · 4:25
What the numbers mean for licence holders and investors
Licence holders competing for rigs and staff in Western Australia face a gold-heavy market; those on copper ground in South Australia, Queensland or New South Wales face a market where copper is a leading target. Consultants can use the state split to size demand for geophysics, drilling and assays by region. Investors can use the ABS series as a check on sector sentiment: spend on gold rose 48% in a year, while copper fell about 15%. None of this predicts where the next large discovery will be. Discovery rates fell worldwide over the last decade, and MinEx puts the cost at about US$218 million per discovery worldwide (2011 to 2020 average, 2023 dollars) in its 2023 analysis.
The data have limits. ABS spend is a count of dollars, not of results. Gold spend includes work at producing mines, where much of the money is infill drilling. Copper-gold systems blur the two lines. And a statistic from the last quarter can be revised. Use the figures to frame your own research, and confirm any licence or tenure detail with the state regulator before you commit money.
Frequently asked questions
How much is spent on gold versus copper exploration in Australia?
In the 12 months to June 2026, ABS data show about A$1.93 billion on gold and A$454 million on copper, from a total of A$4.27 billion for all minerals other than petroleum. That is about 45% for gold and 11% for copper.
Which commodity does Australia explore for most?
Gold, by a wide margin. Iron ore is second at about A$820 million over the same 12 months, and copper is third. Geoscience Australia says gold was 40% of exploration spend in calendar 2025.
What is ABS mineral exploration data?
It is the Australian Bureau of Statistics quarterly survey of private exploration spending and metres drilled, formerly catalogued as 8412.0. It reports spend by mineral, state, and by existing or new deposits, in both original and seasonally adjusted series.
How many metres are drilled each year in Australian exploration?
Geoscience Australia reports 10,659,000 metres for calendar 2025. The quarterly ABS series sums to about 11.8 million metres for the 12 months to June 2026. The ABS does not split metres by commodity.
Is copper exploration spending in Australia rising?
Not on the annual numbers. Copper spend fell from A$660.9 million in 2023 to A$469.7 million in 2025, and the 12 months to June 2026 total of A$454.2 million is about 15% lower than the prior 12 months. The June 2026 quarter, at A$124.3 million, was flat on a year earlier.
Why is gold exploration so high right now?
Gold hit a record of about US$4,300 an ounce in 2025 according to Geoscience Australia, and companies have shifted money toward lower-risk gold ground with existing infrastructure. Spend rose 34% in calendar 2025.
Where in Australia is the most copper exploration done?
Western Australia led with A$162.9 million in the 12 months to June 2026, followed by South Australia (A$108.0 million), Queensland (A$101.8 million) and New South Wales (A$60.8 million).
How many new copper deposits are discovered in Australia?
No single official count exists. Geoscience Australia counted copper in 13 of the 69 maiden Mineral Resources announced in 2025, and MinEx Consulting counted 126 discoveries of all metals in Australia since 2012. The numbers are not directly comparable because they define a discovery differently.
How much copper and gold does Australia have in reserve?
At the end of 2025, Geoscience Australia lists Ore Reserves of 18.87 million tonnes of copper and 3,582 tonnes of gold at operating mines, with Economic Demonstrated Resources of 107.95 million tonnes of copper and 13,352 tonnes of gold.
Do I need a licence to explore for copper or gold in Australia?
Yes. Exploration tenure is granted by each state or territory, and the rules, fees and work commitments differ. Check with the relevant state mines department before you apply, and ask the regulator which landholder and native title steps apply to your ground.
When does the next ABS exploration release come out?
The ABS lists the September 2026 quarter release for 30 November 2026, with the December 2026 quarter to follow on 1 March 2027.
Is this investment advice?
No. This page reports published statistics. It does not recommend any company, commodity or share.
This page is for information only. It is not investment advice and does not recommend any company, commodity or share. Resource figures are exploration and reporting-code estimates, not guarantees of a mine. Exploration tenure rules differ by state; check with the relevant mines department before you apply.
Farmonaut mining
Screen your Australian licence from space
Licence holders and consultants can request a quote for a satellite mineral report that outlines exploration targets on their ground.
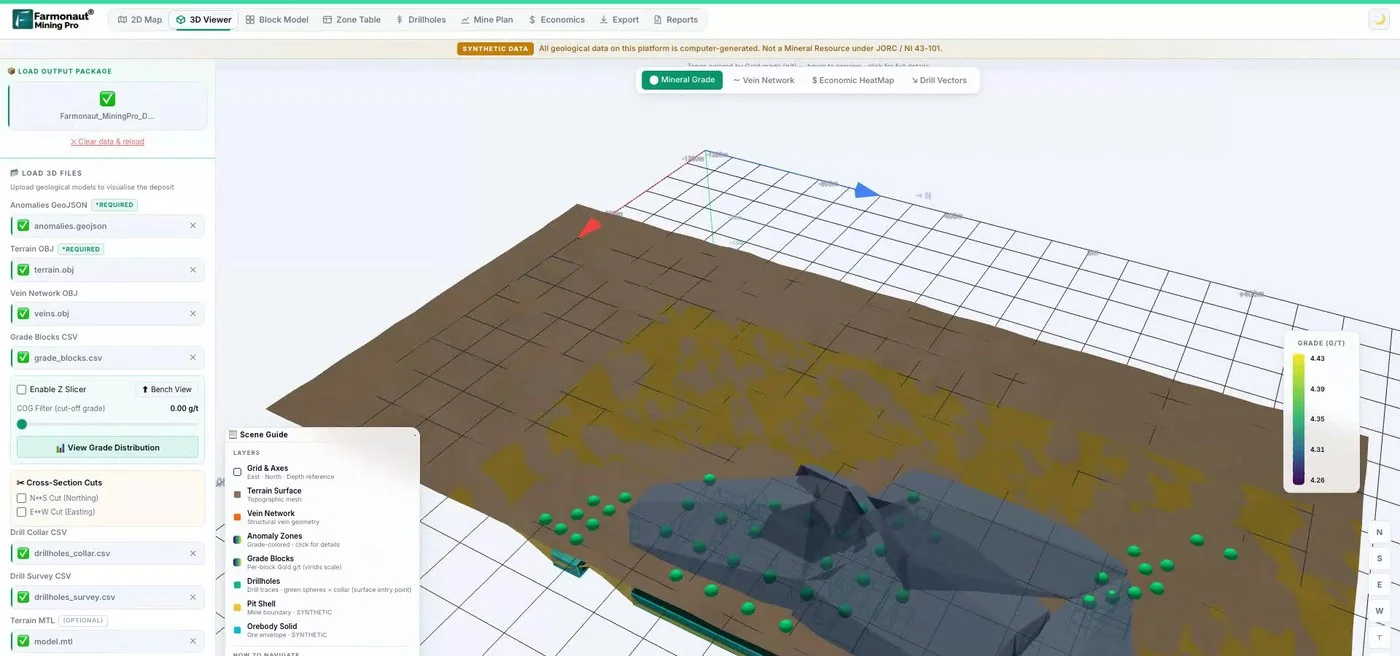
Mining Pro sample view, synthetic data
Sources
- ABS, Mineral and Petroleum Exploration, Australia, June 2026 (latest release): abs.gov.au
- ABS, Table 5 Mineral exploration expenditure by mineral sought (June 2026 workbook): abs.gov.au
- ABS, Table 4 Mineral exploration expenditure by state and territory (June 2026 workbook): abs.gov.au
- Geoscience Australia, AMER 2025: Mineral exploration expenditure and drilling trends: ga.gov.au
- Geoscience Australia, AMER 2025 at a glance: ga.gov.au
- Geoscience Australia, AMER 2025: Maiden Mineral Resources: ga.gov.au
- Geoscience Australia, AMER 2025: Significant drill results, precious metals and other commodities: ga.gov.au
- Geoscience Australia, news release on AMER 2025: ga.gov.au
- Geoscience Australia, Australia’s Identified Mineral Resources 2026 preliminary tables: ga.gov.au
- MinEx Consulting, Are we finding enough copper and gold to meet our future needs (IMARC 2025): minexconsulting.com
- MinEx Consulting, Exploration: Australia vs the World (IMARC 2023): minexconsulting.com
- Rio Tinto, Winu project page: riotinto.com
- Government of Western Australia, GeoVIEW.WA: dmirs.wa.gov.au
- NSW Department of Primary Industries and Regional Development, MinView: minview.geoscience.nsw.gov.au
Discussion
Questions, corrections or field experience? Share them below. First-time comments are reviewed before they appear, and your email is never published.
No comments yet. Be the first to add a question or your experience.

 Lithspo Minerals Limited
 Tintina Mining Group
 Dalgety Minerals Pty Ltd
 Faith At Work (Pty) Ltd
 Geotech Mining Solutions plc
 Vulcan International Limited
 Kidepo Associates
 GKY Mining
 Alkimy SARL
 Double A Trading
 GemSprout Metals Limited
 Qader Group
 Ileys General Trading
 SG Gold Mining LLC
 VRV Global Pte Ltd
 Omsri International FZE
 G.I.T.T.
 Jaunita Erss Ltd
 Almosi SARL
 SRK Consulting
 Berks Gold Limited
 Mwerezi Minerals Company Limited

 Exploration consultancy · South Africa · Gold










