

Farming Marketing Strategy That Works for US Farms
Reviewed August 2026 against USDA NASS/ERS Census of Agriculture data, USDA NIFA grant program pages, and Congressional Research Service (CRS) Cooperative Extension data.
Try it: Enter your numbers above to calculate. →
A farming marketing strategy that works in the United States combines direct-to-consumer channels — farmers markets, CSAs, farm stands, online sales — with the public dollars most farms never apply for: USDA marketing grants, Cooperative Extension education, and Sustainable Agriculture Research and Education (SARE) funding. In 2022, direct marketing accounted for $17.5 billion in farm and ranch sales nationwide, yet the number of farms selling directly to consumers fell 10.3% from 2017 (USDA ERS). That combination — flat-to-growing dollars, shrinking farm count — means marketing skill, not market demand, is now the bottleneck. Below are the channels, the education resources, and the specific subsidy programs behind them, with real award figures and a calculator to size your own grant application.
What a US Farming Marketing Strategy Actually Requires
Every durable farm marketing strategy answers the same five questions, regardless of commodity or season:
- Who buys direct, and through which channel? Farmers market, CSA, farm stand, online sales, or wholesale-direct to restaurants and schools.
- What does the Census of Agriculture say about that channel’s trend? Growing, flat, or consolidating into fewer, larger operations.
- Which public marketing dollars offset your promotion, packaging, or e-commerce costs? FMPP and LFPP exist for exactly this.
- Which education resource fills the specific skill gap? Extension, SARE, or a land-grant short course on pricing, food safety, or digital sales.
- How will you re-check these numbers next cycle? Award amounts and Census figures update on fixed federal schedules, not on your timeline.
This checklist stays useful whether direct sales rise or fall next season, because it points to an update schedule rather than freezing one year’s numbers in place.
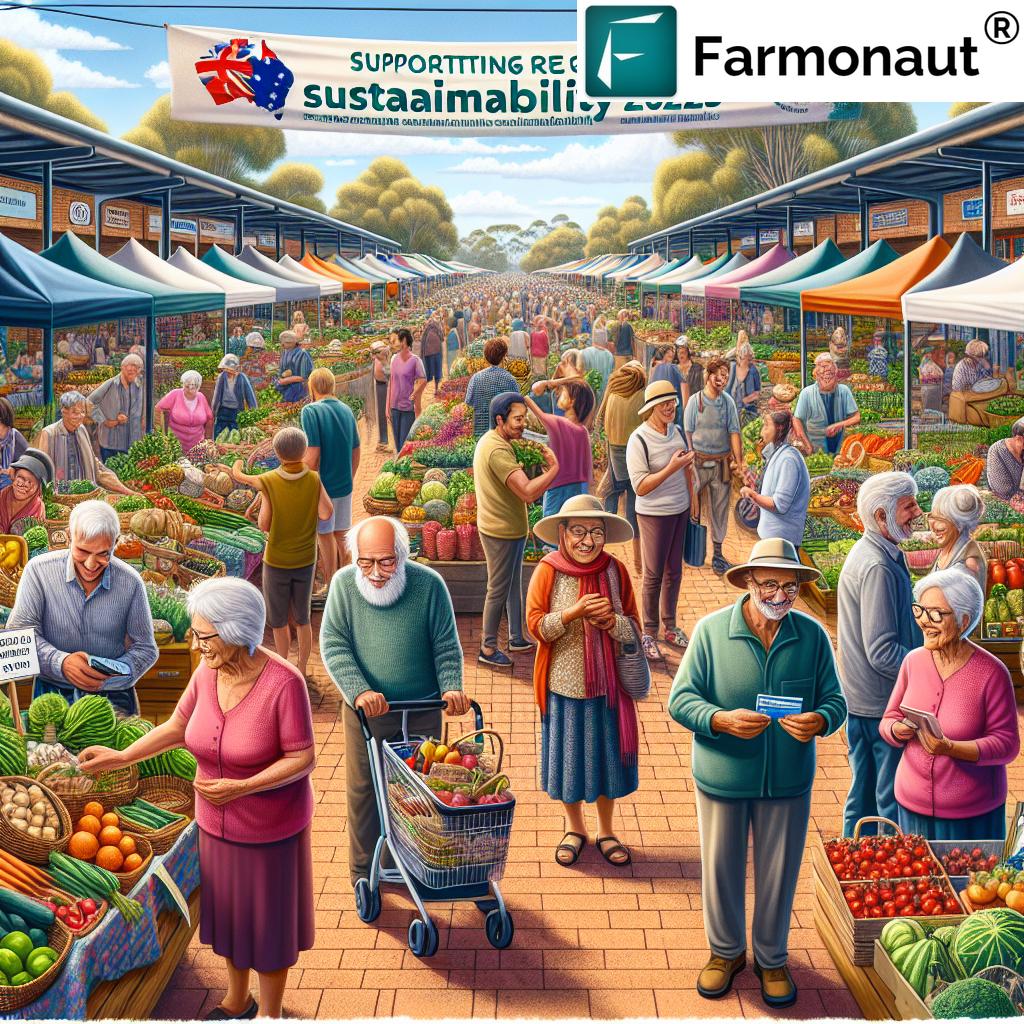
Marketing for Farmers: Choosing and Combining Channels
USDA’s 2022 Census of Agriculture counted 116,617 farms selling directly to consumers — 10.3% fewer operations than in 2017 — even though inflation-adjusted sales through farmers markets, on-farm stores, CSAs, and online marketplaces held level with 2017 (USDA ERS, published March 21, 2024). Read together, those two figures point to consolidation: fewer farms run direct channels, and the ones that remain capture a larger share of the same total. Layer in institutional and food-hub sales and the full direct marketing channel reached $17.5 billion in 2022.
The channel you pick determines which USDA marketing grant actually applies to your costs:
| Channel | What it structurally requires | USDA marketing grant that fits | Where to check the current cycle |
|---|---|---|---|
| Farmers market stall | Stall fee, market rules compliance, SNAP/EBT terminal if the market accepts food benefits | Farmers Market Promotion Program (FMPP) | AMS FMPP grants page |
| CSA subscription | Season-long production plan, member billing platform | FMPP | AMS FMPP grants page |
| On-farm store or stand | Retail permit, signage, point-of-sale system | FMPP | AMS FMPP grants page |
| Online / direct-ship | E-commerce platform, food-safe packaging, shipping compliance | Local Food Promotion Program (LFPP) | AMS LFPP grants page |
| Wholesale-direct to schools/retail (food hub) | Volume contracts, GAP or food-safety certification | LFPP; Regional Food System Partnerships | AMS grants page |

Education for Farmers: Extension, Land-Grant Universities, and Beginning Farmer Training
Free, in-person farmer education in the US runs through the Cooperative Extension System: 56 land-grant universities established under the 1862 Morrill Act, plus 18 historically Black land-grant institutions from the 1890 Morrill Act, deliver county-level agents across all 50 states and US territories (CRS Report R48071). Federal support for this system is shifting in composition, not simply growing: NIFA capacity grants to Extension fell from $509.8 million in FY2017 to $471 million in FY2024, while competitive Extension grants rose from $62.7 million to $83.1 million over the same period — a move toward project-based funding that rewards specific, proposal-driven education programs over general formula funding.
Extension offices publish direct-marketing guidance for free. Penn State Extension, for example, documents that Pennsylvania’s retail farm markets generate over $200 million in state economic activity and that farmers markets there grew 30% over the past decade, with the state ranking third nationally for direct-to-consumer farms — over 6,400 operations — and agritourism, with over 700 operations (Penn State Extension). Find your own state’s land-grant Extension office for the equivalent local numbers; every state runs one. Direct marketing and farmer education aren’t uniquely American problems, either — for a comparison of how a smallholder system builds local market access outside the US, see how agriculture underpins local markets in Lesotho.

Sustainable Farming Education: SARE Grants and On-Farm Research
USDA’s Sustainable Agriculture Research and Education (SARE) program is the federal government’s only farmer-driven research and education grants program, and it is administered through four regional offices — North Central, Northeast, South, and West — rather than a single national office (SARE). SARE funds farmer- and rancher-led projects on cover crops, rotational grazing, pest and weed management, on-farm renewable energy, and — directly relevant here — marketing and local food system development. It explicitly excludes farm startup costs and large capital purchases such as land or equipment; funding covers the research or education project itself, with a small share allowed for materials the project requires. Because each region sets its own deadlines and award ranges, a single national figure would misstate what’s available in your state — check your regional SARE office directly for the open cycle.
Subsidies for Farmers: Where Marketing and Education Grants Fit
“Subsidies for farmers” most often means the large commodity and crop-insurance programs — ARC, PLC, and premium subsidies — which USDA’s ERS forecasts at $44.3 billion in direct government payments for 2026, up 45.2% ($13.8 billion) from $30.5 billion in 2025. ERS attributes the jump to Farm Bill programs that trigger payments when commodity prices fall, alongside continued supplemental and disaster assistance payments (USDA ERS, published February 5, 2026). But a second, much smaller tier of subsidy exists specifically for marketing and education, and it’s the tier most farms never apply to because they don’t know the award sizes or deadlines.
| Program | Purpose | Award range | Match required? |
|---|---|---|---|
| FMPP (Farmers Market Promotion Program) | Direct-to-consumer marketing infrastructure: farmers markets, CSAs, online sales, agritourism | $50,000–$500,000; FY2026 pool of $13.84 million across roughly 55 awards | Yes, cash or in-kind, per the FY2026 Notice of Funding Opportunity |
| LFPP (Local Food Promotion Program) | Local/regional food-business intermediaries: food hubs, processors, wholesalers | Structured alongside FMPP under the Local Agriculture Market Program | Yes |
| BFRDP (Beginning Farmer and Rancher Development Program) | Training, mentoring, and education for farmers in their first 10 years | $49,000 (Simplified Standard, 12-month projects) up to $750,000 (Large Standard/Education Team, 36-month projects) | Not stated on the public fact sheet — confirm in the NOFO |
| SARE Farmer Grants | On-farm sustainable-practice research and education, including marketing | Set independently by each of the four regional offices — no single national figure applies | Set by regional office; confirm directly |

Calculate Your Grant Match Requirement
Before applying to FMPP, LFPP, or BFRDP, most farms need one number first: how much matching or cost-share money they must bring to the table. Enter your project cost, target grant amount, and the match percentage listed in your program’s Notice of Funding Opportunity below.
Enter your numbers above to calculate.
Assumes match is a percentage of total project cost, the structure FMPP and most NIFA competitive grants use. It excludes in-kind match rules, indirect-cost limits, and program-specific eligibility, so confirm the exact method in your program's Notice of Funding Opportunity before finalizing a budget.
How Farmonaut's Tools Support This Strategy
A marketing pitch and a subsidy application both rest on the same underlying asset: verifiable data about what's actually growing on your acres. Farmonaut's satellite-based crop health monitoring, resource-use tracking, and AI advisory tools give farms field-level records that support direct-marketing claims — traceability for CSA members and farmers market buyers — and grant or subsidy documentation, since most NOFOs ask for proof of the practices a program is paying for. Explore the tools through Farmonaut's web app or, for developers building this into your own systems, the API with full developer documentation.





Keeping These Numbers Current
- USDA NASS publishes the Census of Agriculture every five years; the next full release follows the 2027 Census — check nass.usda.gov directly.
- USDA ERS updates its farm income and government-payments forecast several times per year, most recently February 5, 2026 for the 2026 figures — check ers.usda.gov for the next update.
- FMPP, LFPP, and BFRDP each post a Notice of Funding Opportunity once per fiscal year on grants.gov; the FY2026 FMPP window opened April 21, 2026 — check grants.gov, ams.usda.gov, and nifa.usda.gov for the next posting.
- SARE's four regional offices set their own annual grant calendars independently — check sare.org for your region's open cycle.
Frequently Asked Questions
Q: What's the fastest way to improve a farm marketing strategy?
A: Start with Census of Agriculture channel data — $17.5 billion in 2022 direct marketing sales across 116,617 farms — to confirm demand in your channel, then check FMPP or LFPP funding to offset the cost of adding or upgrading it.
Q: Is farmer education free?
A: Cooperative Extension education through your state's land-grant university is free or low-cost. SARE and BFRDP are competitive grants that require an application, and some require a cost-share match.
Q: Do sustainable farming education programs pay farmers directly?
A: SARE grants pay farmers and ranchers directly for approved on-farm research or education projects. Standard Extension programming does not pay farmers — it's free instruction and technical assistance.
Q: How is "subsidies for farmers" different from "marketing grants for farmers"?
A: ARC, PLC, and crop insurance premium subsidies are income-support programs tied to commodity price or yield, forecast at $44.3 billion for 2026. FMPP, LFPP, and BFRDP are competitive, project-based grants requiring a written application and, for FMPP/LFPP, matching funds.
Conclusion
The channel data, the Extension and SARE education paths, and the FMPP/BFRDP subsidy figures above are the concrete inputs a farming marketing strategy needs — not general advice, but numbers you can act on and a schedule for when they refresh. Run the five-question checklist against your own operation, size your grant match with the calculator, and re-check the sources above each year they update.
Earn With Farmonaut: Affiliate Program
Earn 20% recurring commission with Farmonaut's affiliate program by sharing your promo code and helping farmers save 10%. Onboard 10 Elite farmers monthly to earn a minimum of $148,000 annually—start now and grow your income!

 Fair Climate Fund
 TVS Electronics
 BW Pipelines
 WICO
WICO Gen Chayat
 Chimera Innovation
 SkyHarvest
 Polaris Digitech
 Teledarbas
 Wild Oak Farm
 SFX
SFX BACF Africa
 Doodlakine
 Exurbia Geospatial
 FieldZero
 Indico Company
