

Green Ammonia Market Size, Growth & Production Tech
Reviewed August 2026 against U.S. Department of Energy hydrogen-hub records, USDA’s Economic Research Service and Agricultural Marketing Service fertilizer-price data, and the U.S. Energy Information Administration’s natural gas price series.
Try it: Run your own numbers →
The global green ammonia market was valued at $885.83 million in 2025 and is forecast to reach $86.27 billion by 2034, a 66.32% compound annual growth rate, according to Precedence Research’s November 2025 update. Asia-Pacific is the fastest-scaling region in dollar terms, Europe still holds the largest share of installed and planned capacity, and the United States is building its position through seven federally backed hydrogen hubs rather than through consumer-facing green ammonia sales. None of that growth has reached farm-gate fertilizer prices yet, and the natural gas market that still supplies almost all of the ammonia American growers buy hasn’t moved because of it.
What Is Green Ammonia, and How Big Is the Ammonia Market It’s Trying to Enter?
Ammonia (NH3) is one of the highest-volume industrial chemicals made anywhere, and the vast majority of it is still “gray”: hydrogen split from natural gas through steam methane reforming, then combined with nitrogen using the century-old Haber-Bosch process. Green ammonia swaps that hydrogen source for water electrolysis powered by wind, solar, or hydropower, so the nitrogen-fixing chemistry stays identical while the carbon footprint of the hydrogen input drops close to zero at the point of production. This distinction matters commercially because the ammonia market itself is not new or small — green ammonia is a technology segment trying to displace a slice of a mature commodity market that already prices, ships, and trades ammonia by the millions of tons every year, much of it tied to renewable energy’s broader impact on rural agriculture.
That context explains why green ammonia’s dollar figures look small next to its growth rate. A segment can compound at 66% a year for a decade and still be a rounding error against total global ammonia output, because it started from close to zero. The chart below shows what “small base, fast growth” looks like in actual dollars, for both the global market and its fastest-growing region.
Green Ammonia Market Size and Growth Rate
Multiple research firms track this market, and their numbers disagree because they draw the boundary differently — some count only electrolytic ammonia already at final investment decision, others include announced pre-FID capacity. Public estimates for the segment’s compound annual growth rate through the early-to-mid 2030s range from 52.0% to 95.6%; the table below uses the two figures this article verified directly against the publishers’ own pages.
| Market | 2025 Value | Forecast Value | CAGR | Forecast Period |
|---|---|---|---|---|
| Global green ammonia | $885.83 million | $86.27 billion (2034) | 66.32% | 2025–2034 |
| Asia-Pacific green ammonia | $359.19 million | $8.71 billion (2035) | 37.55% | 2026–2035 |
| Europe’s share of the global market | 33% of global revenue in 2024 (largest single region) | — | ||
Two other figures from the same Precedence Research update explain where the growth actually shows up first: transportation (marine and industrial fuel use) held the largest 2024 revenue share at 30.8%, while the fertilizer end-use segment is forecast to grow fastest of any application, at a 75.4% CAGR between 2024 and 2034. In other words, the “green ammonia production market” is currently weighted toward shipping fuel and industrial offtake, and agriculture is the segment analysts expect to catch up quickest — not the segment leading it today.
Sustainable Ammonia Production: The Technology Behind the Numbers
Water electrolysis splits water into hydrogen and oxygen using electricity; the hydrogen then feeds the same Haber-Bosch synthesis loop gray ammonia plants already run. Three electrolyzer families compete for that step: proton exchange membrane (PEM), alkaline, and solid oxide. PEM held the largest technology revenue share in 2024, at 44.5% of the global green ammonia market, with alkaline and solid oxide electrolysis splitting most of the remaining 55.5% between them, per the same Precedence Research dataset cited above. That technology mix is also central to how production technology is evolving across agricultural supply chains, since electrolyzer efficiency is what ultimately sets the electricity bill per ton of ammonia produced.
Water use matters too: electrolysis needs high-purity water as a direct input, on top of any cooling water the plant already uses, which is one reason large developers pair projects with structured resource-management planning for supply chains rather than treating water sourcing as an afterthought.
How to Verify a “Green Ammonia” Claim: A 4-Point Check
“Green” is a marketing word before it is a regulatory one, so a claim is only as good as what backs it. This checklist doesn’t expire the way a price does — use it on any project or supplier you evaluate, whenever you evaluate it:
- Ask for the electricity source, not the adjective. “Renewable-powered” can mean a dedicated wind PPA or it can mean grid-average power in a region that is mostly gas and coal. Ask for the specific contract.
- Check the carbon-intensity number against a federal line, not a brand claim. The U.S. Department of Energy’s Clean Hydrogen Production Standard set a target of 4.0 kg CO2e per kg of hydrogen (well-to-gate), published in DOE’s June 2023 guidance under Section 40315 of the Infrastructure Investment and Jobs Act. Separately, the statutory definition of “clean hydrogen” in that same law caps site-of-production emissions at 2.0 kg CO2e per kg H2. A project quoting a number above 4.0 is not meeting the federal clean-hydrogen bar, regardless of how it’s marketed. Check DOE’s Clean Hydrogen Production Standard page for any revision to that figure.
- Identify the electrolyzer family. PEM, alkaline, and solid oxide have different efficiency curves, and that efficiency is most of what sets the electricity-intensity number a cost estimate depends on.
- Ask whether the synthesis loop is green too, not just the hydrogen. Haber-Bosch itself runs on heat and compression that can still be gas-fired even when the hydrogen feed is fully electrolytic — a genuinely low-carbon ton of ammonia needs both halves covered.

Green Ammonia Market by Region: APAC, Japan, and the United States
Regional demand for green ammonia splits along three distinct logics: Asia-Pacific is buying it as a power-sector decarbonization tool, Japan specifically is testing it as a coal co-firing fuel, and the United States is building supply-side infrastructure around it before demand has fully materialized.
Asia-Pacific (APAC) Green Ammonia Market
The Asia-Pacific green ammonia market was valued at $359.19 million in 2025 and is projected to reach $8.71 billion by 2035, a 37.55% compound annual growth rate for 2026–2035, according to Towards Chem and Materials’ December 2025 update. China’s state-owned power and energy-engineering groups are developing large-scale renewable-to-ammonia projects tied to excess wind generation, South Korea is signing long-term offtake partnerships with exporting countries to secure future power-sector supply, and Australia is positioned to post the fastest national growth rate in the region through 2030 as its wind and solar resource base attracts export-oriented ammonia projects. Japan carries its own dynamics distinct enough to warrant a separate look below.
Japan’s Green Ammonia Market: Co-Firing Reality Check
Japan’s approach runs through power-sector auctions rather than direct green ammonia purchasing, and the results through 2024 undercut the growth story the targets imply. In Japan’s first hydrogen/ammonia co-firing retrofit auction (2023), developers bid for a 1,000 MW target and 826 MW was awarded. In the second auction (2024), only 95 MW was bid — under 10% of the target — from a single bidder, according to the Renewable Energy Institute’s August 2025 analysis. Japan’s 2030 target calls for roughly 1.52 GW of co-firing capacity, enough to supply about 1% of national electricity generation; the government’s own modeling shows that even 100% ammonia combustion (versus coal) delivers only a 62% greenhouse-gas reduction, because ammonia combustion still emits nitrogen oxides and some residual carbon. Japan’s stated path moves from partial co-firing today toward full ammonia conversion in the 2040s, with a 2050 full-decarbonization deadline for the power sector.
United States Green Ammonia Market
The U.S. approach is federally funded infrastructure, not consumer demand: the Department of Energy is backing seven Regional Clean Hydrogen Hubs with up to $7 billion in federal funding, announced October 13, 2023, matched by more than $40 billion in private cost-share, targeting a combined 3 million metric tons of hydrogen production a year. Only one hub names ammonia and fertilizer explicitly as its output.
| Hydrogen Hub | States | Federal Funding (up to) |
|---|---|---|
| Heartland Hydrogen Hub | Minnesota, North Dakota, South Dakota | $925 million |
| California Hydrogen Hub (ARCHES) | California | $1.2 billion |
| Gulf Coast Hydrogen Hub (HyVelocity) | Texas | $1.2 billion |
| Midwest Hydrogen Hub (MachH2) | Illinois, Indiana, Michigan | $1.0 billion |
| Pacific Northwest Hydrogen Hub | Washington, Oregon, Montana | $1.0 billion |
| Mid-Atlantic Hydrogen Hub (MACH2) | Pennsylvania, Delaware, New Jersey | $750 million |
| Appalachian Hydrogen Hub (ARCH2) | West Virginia, Ohio, Pennsylvania | $925 million |
Source: U.S. Department of Energy announcement, Oct 13, 2023.
The Heartland Hydrogen Hub, spanning Minnesota, North Dakota, and South Dakota, is built specifically to decarbonize regional fertilizer production, with Atlas Agro and Xcel Energy named as primary partners. On the demand side, CF Industries’ Donaldsonville, Louisiana project appears in the IEA’s Global Hydrogen Review 2024 as one of the world’s export-ready low-emission ammonia projects with an identified offtaker, at 500,000 tons per year, according to a summary of the IEA’s October 2024 findings — one of the few U.S. green ammonia volumes with a named buyer already attached, rather than a target still being planned toward.
What hasn’t moved is the price American growers actually pay, because it still tracks natural gas, not electrolyzer capacity. U.S. anhydrous ammonia averaged $786 per ton in the first week of August 2025, up 6% year-over-year, after $747 per ton in April 2025, according to University of Illinois farmdocdaily’s August 12, 2025 analysis of USDA-AMS pricing data, which forecast prices holding in the $750–$800 range through the fall. That’s well below the 2022 peak, when anhydrous ammonia exceeded $1,600 per ton, but still above the roughly $650-per-ton average that held from 2008 through 2020, per USDA’s Economic Research Service. Natural gas is the reason: the Henry Hub spot price averaged $3.52 per MMBtu in 2025, a 56% jump from 2024’s inflation-adjusted record low, ranging as high as $9.86/MMBtu on individual days, according to the U.S. Energy Information Administration. This price history is also why domestic fertilizer production capacity stays a live policy question independent of the green ammonia story.
Calculate Your Own Green Ammonia Energy-Cost Gap
Use the calculator below to estimate the energy-cost gap between conventional and green ammonia production for your own natural gas and electricity prices.
Run your own numbers
Assumptions: only the natural gas price is pre-filled, using the U.S. Energy Information Administration’s 2025 average Henry Hub price ($3.52/MMBtu, reported January 2026) as a starting point. Enter your own gas-intensity, electricity price, electricity-intensity, and volume figures from a supplier quote or engineering study to get a number specific to your situation. This tool compares only the energy input cost of the hydrogen-production step; it excludes electrolyzer capital cost, Haber-Bosch synthesis energy, storage, transport, and any tax credits or subsidies.
How Satellite Farm Data Complements Green Ammonia Adoption
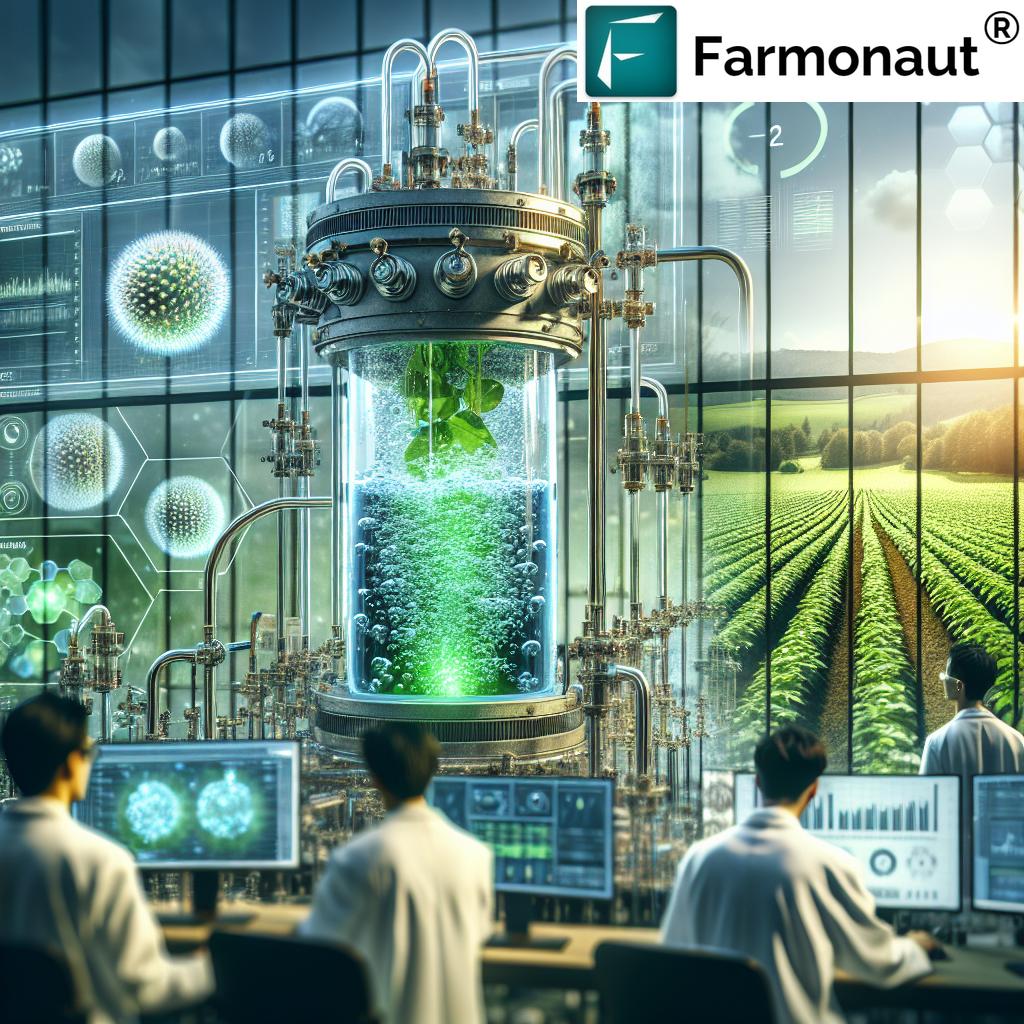
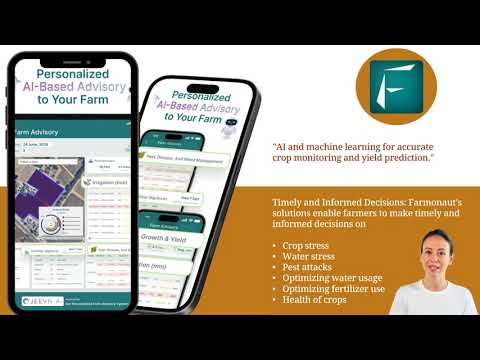
Whatever nitrogen source a farm ends up buying — gray ammonia today, a green-certified ton in the future — the return on it still depends on applying it where the crop needs it. Farmonaut’s satellite-based farm management platform, available via Android, iOS, web browser, and API, layers satellite imagery, AI, and machine learning onto that decision:
- Real-time crop health monitoring to time nitrogen application against actual plant demand rather than a fixed calendar.
- AI-based advisory recommendations that flag where fertilizer is being under- or over-applied.
- Resource management tools that reduce waste across irrigation and nutrient inputs together.
- Carbon footprint tracking so a farm can measure whether its nitrogen source is actually lowering its footprint, not just paying a premium for a label.

Explore Farmonaut’s platform:
API Access | API Developer Docs


Where the Green Ammonia Market Still Falls Short
Three constraints show up across every region covered above, and none of them resolve on a fixed timeline: infrastructure has to be built before volume can move, since pipelines, storage, and port capacity for ammonia as a fuel don’t yet exist at power-plant scale in most markets; cost still runs above gray ammonia almost everywhere, which is why Japan’s second auction drew a 95 MW bid against a roughly 1,000 MW target rather than the reverse; and offtake agreements remain the exception rather than the rule — CF Industries’ 500,000-ton Louisiana volume is notable in the IEA’s dataset precisely because named buyers for green ammonia are still uncommon. Each of these is a checkable fact, not a permanent verdict: the DOE hub funding table, the Japan auction results, and the technology-share split above will all update as new auction rounds and hub milestones land, so re-check the linked sources rather than this article’s numbers a year from now.

Earn With Farmonaut: Join the Sustainable Agriculture Revolution
Earn 20% recurring commission with Farmonaut’s affiliate program by sharing your promo code and helping farmers save 10%. Onboard 10 Elite farmers monthly to earn a minimum of $148,000 annually—start now and grow your income!
Learn More About Our Affiliate Program
Frequently Asked Questions
- What is the green ammonia market’s current size and growth rate?
$885.83 million globally in 2025, forecast to reach $86.27 billion by 2034 (66.32% CAGR), per Precedence Research’s November 2025 update. Published CAGR estimates across firms range from 52.0% to 95.6%, depending on scope and base year. - What does “sustainable ammonia production” actually mean, technically?
Hydrogen made by electrolyzing water with renewable or low-carbon electricity, instead of steam-reforming natural gas, feeding the same Haber-Bosch synthesis loop conventional ammonia plants use. Check the source against DOE’s 4.0 kg CO2e/kg H2 Clean Hydrogen Production Standard target (June 2023 guidance) before accepting a “green” label. - How big is the Asia-Pacific green ammonia market?
$359.19 million in 2025, projected to reach $8.71 billion by 2035 (37.55% CAGR, 2026–2035), per Towards Chem and Materials’ December 2025 update. China, South Korea, and Australia are the region’s most active national markets. - Is Japan’s green ammonia market growing as fast as its targets suggest?
No — bidding fell from 826 MW awarded in the 2023 co-firing auction to just 95 MW bid in 2024, against a roughly 1,000 MW target each round, per the Renewable Energy Institute’s August 2025 analysis. Japan’s 2030 target is about 1.52 GW, roughly 1% of national electricity. - What is the United States doing in the green ammonia market?
Funding supply-side infrastructure: up to $7 billion across seven DOE hydrogen hubs (announced October 2023), with the Heartland Hydrogen Hub ($925 million; Minnesota, North Dakota, South Dakota) explicitly targeting fertilizer decarbonization. CF Industries’ 500,000-ton Louisiana project is one of the few U.S. volumes with a named offtaker. - How is green ammonia different from the broader ammonia market?
The chemistry and end uses are the same; only the hydrogen source changes. The broader ammonia market is priced by natural gas costs today — U.S. anhydrous ammonia averaged $786/ton in August 2025 as Henry Hub gas averaged $3.52/MMBtu for the year, per USDA-AMS/farmdocdaily and the EIA. - How can I check whether a supplier’s “green ammonia” claim meets a real threshold?
Use the four-point check above: verify the electricity contract, compare the lifecycle carbon intensity to DOE’s 4.0 kg CO2e/kg H2 target, identify the electrolyzer type, and confirm the Haber-Bosch synthesis step itself runs on low-carbon power. - Where can I find updated figures after this article’s review date?
DOE’s hydrogen hub program page for funding and milestone updates, USDA’s Economic Research Service and Agricultural Marketing Service for fertilizer prices, the EIA’s Henry Hub series for gas prices, and the Renewable Energy Institute for Japan’s auction results — all linked above at their original source.
Discussion
Questions, corrections or field experience? Share them below. First-time comments are reviewed before they appear, and your email is never published.
No comments yet. Be the first to add a question or your experience.

 Etherspace Network
 Teledarbas
 Wild Oak Farm
 SFX
SFX BACF Africa
 Doodlakine
 Exurbia Geospatial
 FieldZero
 Indico Company
 Kubota
 FFBS
FFBS Jontra
 Tucor
Tucor
