

Reviewed August 2026 against USDA NASS, USDA ERS, and CBOT/Barchart futures data.
To buy wheat futures, you open an account with a futures broker that clears through CME Group’s CBOT exchange, fund it to cover margin, and place an order on a specific contract month (for example ZWU26 for September delivery) — you do not need to own or handle physical grain. A single CBOT wheat contract controls 5,000 bushels, so at the $6.31/bushel settlement recorded for the September 2026 contract on August 6, 2026, one contract represents roughly $31,550 of notional wheat, against which your broker will require a margin deposit that is a fraction of that value. This article covers that process, plus the corn, soybean and wheat production numbers and futures prices US growers and traders are asking about right now.
If you’re a farm operator rather than a speculator, the more common question isn’t how to buy futures outright — it’s how to use futures and other tools to protect your operation from price swings. We cover both paths below, with the USDA and CBOT figures behind the current agricultural commodity market, and a calculator that estimates your exposure to a price move on your own acreage.
Table of Contents
- How to Buy Wheat Futures
- Corn Market Forecast: Acreage, Yield, Price
- Soybean Market Outlook
- Agricultural Commodity Overview: Wheat, Corn, Soybeans Compared
- Agriculture Forecast: What Moves These Markets Next
- Protecting a Farm Business From Price Swings
- Price-Move Exposure Calculator
- Where Satellite Monitoring Fits In
- FAQs
- Try it: Estimated result

How to Buy Wheat Futures
Wheat futures trade on CME Group’s Chicago Board of Trade (CBOT) under the ticker ZW, with contract months typically for March, May, July, September and December delivery. The September 2026 contract (ZWU26) settled at $6.31/bushel on August 6, 2026, according to CBOT/NYMEX data reported by Barchart. Here is the mechanical process:
- Open a futures trading account. You need a broker registered to clear CBOT grain contracts — this is a different account type from a standard stock brokerage account, because futures involve margin and daily mark-to-market settlement rather than full cash payment.
- Fund the account to cover margin. Futures require an initial margin deposit set by the exchange and your broker, not the full contract value. Margin requirements change with volatility, so confirm the current figure with your broker before placing an order.
- Choose your contract month. Each CBOT wheat contract covers 5,000 bushels. Contract symbols combine the month code and year — ZWU26 is the September (“U”) 2026 contract.
- Decide long or short. Buying (going long) profits if wheat prices rise before you close or the contract expires; selling (going short) profits if prices fall. Farmers who grow wheat typically sell (short) futures or use them within a hedge to lock in a price for grain they’ll harvest, rather than buying outright.
- Place the order and monitor daily settlement. Futures accounts are marked to market each session — gains and losses post to your account daily, and your broker can issue a margin call if the balance falls below the maintenance level.
- Close the position or take delivery. Most traders close (offset) their position before expiration rather than making or taking physical delivery of grain.
For real-time wheat futures quotes rather than a point-in-time figure, check the ZW contract series directly — Barchart’s futures pages update during CBOT trading hours. Many farm operations skip direct futures trading altogether and instead use forward contracts with a local elevator, which achieve a similar price-lock effect without requiring a margin account; ask your grain buyer whether they offer forward contracting tied to the CBOT board price.
Wheat Production Backdrop
The USDA NASS August 2026 survey put the US wheat yield estimate for the 2026/27 marketing year at 47.5 bushels/acre. That yield figure, combined with planted acreage, is what ultimately determines whether the crop entering the pipeline pressures or supports the futures price you’d be trading. NASS revises both yield and acreage figures in subsequent monthly reports, so check the current NASS release at nass.usda.gov rather than treating the August figure as final — the agency’s final Crop Production report for a given marketing year is released the following January.

Corn Market Forecast: Acreage, Yield, Price
USDA NASS’s June 30, 2026 acreage report put 2026 US corn planted acreage at 95.3 million acres. The August 2026 survey-based yield estimate for the 2026/27 marketing year is 180.7 bushels/acre. On the futures side, the September 2026 CBOT corn contract (ZCN26) settled at $4.39/bushel on August 6, 2026. USDA’s Economic Research Service put 2026/27 US corn ending stocks at 42.0 million metric tonnes in its August 14, 2026 outlook — a figure that measures how much corn is projected to be left in storage at the close of the marketing year after domestic use and exports, and is one of the single biggest levers on price because tighter ending stocks tend to support futures while burdensome stocks weigh on them.
For the current corn market forecast beyond this snapshot, USDA ERS republishes its Corn and Other Feed Grains outlook on a rolling basis at ers.usda.gov’s corn market outlook page, and the broader WASDE (World Agricultural Supply and Demand Estimates) report that feeds those numbers is released on the 12th of each month.
Why 95.3 Million Acres Matters
Corn acreage above or below trend shifts the entire supply balance before a single yield report comes in. At 95.3 million planted acres and a survey yield of 180.7 bushels/acre, the arithmetic behind USDA’s production estimate is straightforward: acreage harvested (typically 91-92% of planted acres for corn, since some acreage is abandoned or diverted to silage) multiplied by yield per acre gives total bushels produced. Small changes in either number move the total by hundreds of millions of bushels, which is why traders watch both the June acreage report and the monthly yield surveys closely rather than relying on either figure in isolation.
Soybean Market Outlook
US soybean planted acreage for 2026 was estimated at 85.4 million acres in USDA NASS’s June 30, 2026 report. The August 2026 survey yield estimate for 2026/27 stands at 52.7 bushels/acre. On CBOT, the August 2026 soybean contract (ZSN26) settled at $11.57/bushel on August 6, 2026 — the highest per-bushel price of the three major row crops covered here, reflecting soybeans’ higher value density relative to corn and wheat.
Soybean price outlook depends heavily on export demand, and the US competes directly with South American supply on the global market — when Brazil’s harvest is large, it typically pressures US soybean futures because buyers can source cheaper beans from the Southern Hemisphere during the US off-season. USDA does not publish a single “soybean price outlook” figure beyond the WASDE’s monthly season-average price projection; check the current WASDE release for that specific forecast rather than relying on a snapshot number, since it is revised monthly as new production and demand data comes in.
Corn vs. Soybean Acreage: The Planting Trade-Off
Farmers choosing between corn and soybeans for a given field are effectively comparing relative revenue per acre, input costs, and crop rotation needs. The table below lines up the 2026/27 figures side by side.
| Metric | Corn | Soybeans | Wheat |
|---|---|---|---|
| 2026 US planted acreage | 95.3 million acres | 85.4 million acres | Not in June 2026 NASS acreage report figures reviewed for this piece — check NASS directly |
| 2026/27 yield estimate (Aug. 2026 survey) | 180.7 bushels/acre | 52.7 bushels/acre | 47.5 bushels/acre |
| CBOT futures settlement, Aug. 6, 2026 | $4.39/bushel (Sep26, ZCN26) | $11.57/bushel (Aug26, ZSN26) | $6.31/bushel (Sep26, ZWU26) |
| Bushels per futures contract | 5,000 | 5,000 | 5,000 |
| Approx. notional value per contract at settlement price above | $21,950 | $57,850 | $31,550 |
| 2026/27 US ending stocks | 42.0 million metric tonnes (USDA ERS, Aug. 14, 2026) | Not published in the sources reviewed for this piece — check USDA ERS oilseeds outlook directly | Not published in the sources reviewed for this piece — check USDA WASDE directly |
Where the table says a figure “is not published in the sources reviewed for this piece,” that reflects the actual limit of the research behind this article rather than an oversight to paper over — USDA does publish oilseed ending stocks and wheat acreage, but those specific numbers were outside the verified data set used here. The fix is simple: NASS and ERS republish these figures on fixed schedules (acreage reports around the end of June and September; WASDE on the 12th of each month), so the same tables above can be refreshed by pulling the current release from nass.usda.gov.
Agricultural Commodity Overview: Wheat, Corn, Soybeans Compared
“Agricultural commodity” as a search term usually means someone wants the current state of the row-crop complex in one place rather than a definition. Here it is, condensed to the figures that are actually moving: corn planted acreage of 95.3 million acres and a 180.7 bushel/acre yield estimate set up a much larger aggregate crop than soybeans’ 85.4 million acres at 52.7 bushels/acre, even though soybeans carry the higher per-bushel price ($11.57 vs. corn’s $4.39 as of the August 6, 2026 settlements). Wheat, at a 47.5 bushel/acre yield estimate and a $6.31/bushel futures price, sits in between on price but is a smaller-acreage crop in the US relative to corn and soybeans nationally.
Each of these three commodities trades on CBOT under 5,000-bushel contracts, which is why the notional value comparison in the table above is a fair apples-to-apples way to size a position regardless of which crop you’re trading. A single soybean contract at the August 6, 2026 settlement price carries roughly 2.6 times the notional value of a single corn contract — a distinction that matters directly for margin requirements and position sizing, not just for headline price-per-bushel comparisons.
How US Tariff Policy Feeds Into Commodity Pricing
Agricultural export demand is sensitive to trade policy, and tariffs — both those the US imposes and retaliatory tariffs from trading partners — change the relative competitiveness of US grain and oilseed exports against South American and Black Sea region supply. For a detailed breakdown of how recent US tariff actions affect agricultural exporters and what it means for pricing, see Farmonaut’s dedicated analysis: U.S. Tariffs on Agricultural Products: Key Effects.
Explore Farmonaut’s API for advanced agricultural data analytics
Agriculture Forecast: What Moves These Markets Next
An agriculture forecast for row crops rests on three inputs that update on fixed, publicly known schedules: acreage, yield, and ending stocks. NASS’s acreage reports (the June 30, 2026 report is the source for the corn and soybean acreage figures cited throughout this article) set the baseline; the monthly WASDE report layers in updated yield surveys and demand assumptions; and ERS’s commodity-specific outlook pages translate those into ending-stocks and price projections. None of this is proprietary — it’s how to build your own forecast rather than rely on someone else’s.
The Durable Method: How to Read a WASDE-Driven Forecast Yourself
- Start with planted acreage from the most recent NASS acreage report (released quarterly, with the key planting-intentions and final acreage reports in March and June).
- Apply the current yield estimate from the monthly Crop Production report — NASS surveys yields multiple times per season as the crop matures, so August, September, October and November estimates typically converge toward the January final figure.
- Multiply acreage by yield (adjusting for harvested vs. planted acreage, since not all planted acres are harvested) to get total production.
- Compare total production plus carry-in stocks against projected use (feed, export, ethanol/crush, and food use) — the residual is ending stocks.
- Read ending stocks as a stocks-to-use ratio, not an absolute number: a given stocks figure means something different against a small crop than a large one. A falling stocks-to-use ratio historically correlates with rising futures prices, and a rising one with falling prices, though weather shocks and demand surprises can override the trend in any given month.
- Cross-check against futures prices on Barchart or the CME Group site — if the futures market has already priced in a WASDE change, the report itself won’t move prices much on release day.
This five-step method doesn’t expire — it works whether corn is at $4.39/bushel or $6/bushel, because it’s a way of reading any month’s data rather than a fixed conclusion about this month’s data.

Protecting a Farm Business From Fluctuating Commodity Prices
Farm operations have several tools to manage price risk that don’t require becoming a futures trader:
- Forward contracts. A local elevator or grain buyer agrees to purchase your grain at a set price for future delivery, locking in revenue before harvest without you needing a futures brokerage account.
- Hedging with futures or options. Selling (shorting) futures contracts against expected production locks in a price; buying put options sets a price floor while preserving upside if prices rise, at the cost of an upfront premium.
- Crop insurance with revenue protection. USDA-backed revenue protection policies, administered through USDA’s Risk Management Agency, pay out if either yield or price falls below the insured level, combining production risk and price risk in one policy.
- Basis contracts. These lock in the difference between your local cash price and the CBOT futures price, letting you set the futures leg later — useful when you’re confident about local basis but uncertain about the direction of the broader futures market.
- Diversification across crops and marketing windows. Spreading sales across multiple months rather than selling an entire crop at harvest reduces the risk of selling everything at a single low price point.
None of these tools eliminates price risk — they trade one kind of risk for another (a hedge that protects against falling prices also caps your gain if prices rise). The right mix depends on your operation’s balance sheet, storage capacity, and appetite for basis risk versus outright price risk, which is a conversation worth having directly with a commodity broker or your local USDA Farm Service Agency office rather than something a single article can prescribe for every farm.

Price-Move Exposure Calculator
This calculator estimates how much a given move in the futures price would change the value of your crop, using the same per-bushel figures cited above as starting defaults — enter your own acreage, yield and price assumptions to see your actual exposure.
Estimated result:
Assumptions: this tool multiplies acres by yield to estimate total bushels, then applies the price move you enter to show the dollar swing in crop value at your assumed yield. It excludes basis, storage and drying costs, hedging premiums, crop insurance indemnities, and any existing forward contracts or hedges you already hold — it’s a starting estimate for sizing risk, not a substitute for a marketing plan.
Where Satellite Crop Monitoring Fits Into Market Decisions
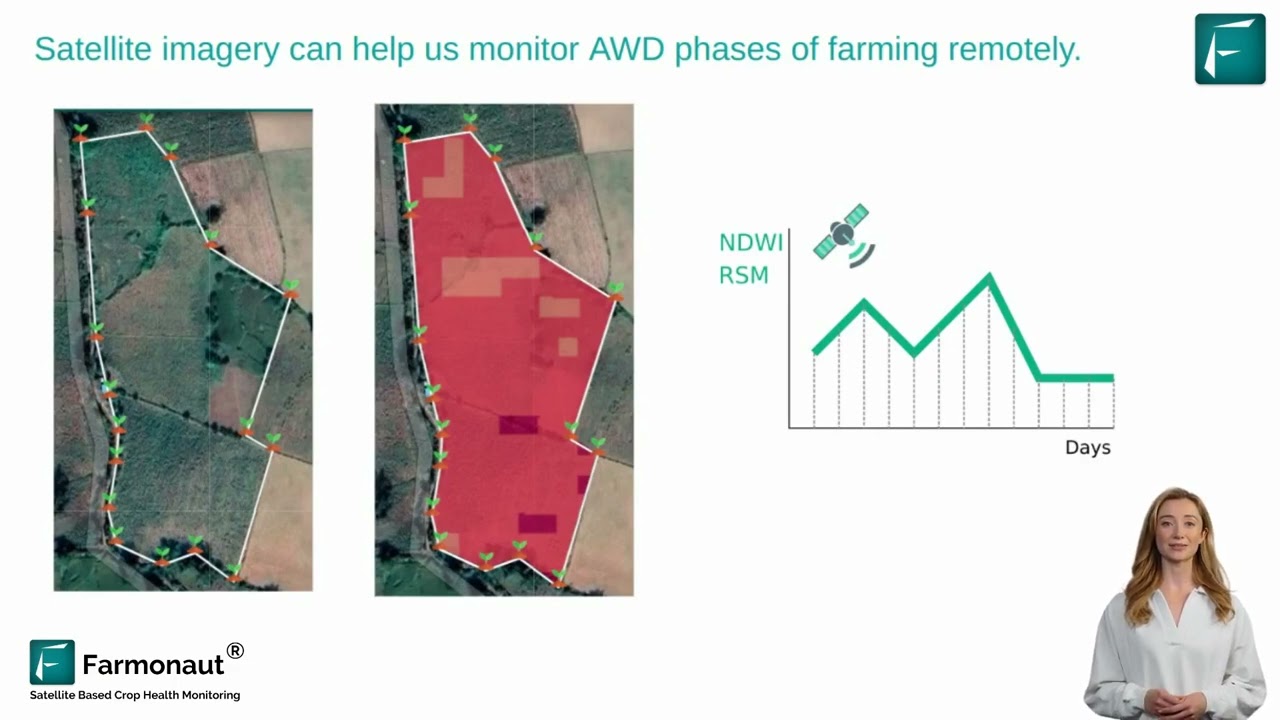
Futures prices react to production expectations well before USDA's official numbers catch up, which is exactly the window where field-level monitoring earns its keep. Farmonaut's satellite-based crop health monitoring tracks vegetation indices, soil moisture and weather conditions across a field in near real time, which helps operations judge whether their own yield is tracking above or below the USDA survey average — useful context whether you're deciding when to forward-contract or when to place a hedge.
Access Farmonaut's API Developer Docs for integrating agricultural data into your systems
Precision Agriculture and Risk Management
Beyond satellite monitoring, GPS-guided equipment and variable-rate application systems let operations control input costs per acre more tightly — a lever that matters more, not less, when commodity prices are volatile, since margin per acre depends on both the revenue side (price × yield) and the cost side (inputs per acre). Farmonaut's mobile apps put field-level NDVI, weather and advisory data in growers' hands directly:


Global Production Context
US corn, soybean and wheat markets don't move in isolation — Brazilian and Argentine soybean harvests, Black Sea region wheat exports, and Chinese import demand all feed back into CBOT pricing. When South American supply is abundant during the US off-season, it typically caps how far US soybean futures can rally even on strong domestic demand, because global buyers have a cheaper alternative source. Conversely, a shortfall in a major exporting region tends to support US futures across all three crops, since global grain and oilseed markets are substitutes to a meaningful degree. For global supply-and-demand figures beyond the US-focused NASS and ERS data cited in this article, the USDA's WASDE report also carries world production and trade tables, released alongside the US figures on the same monthly schedule.
Conclusion: A Method That Outlasts This Month's Numbers
The specific figures in this article — 95.3 million corn acres, 85.4 million soybean acres, a 180.7 bushel/acre corn yield estimate, $4.39 corn and $11.57 soybean and $6.31 wheat futures settlements, and 42.0 million metric tonnes of projected corn ending stocks — are all snapshots from USDA NASS, USDA ERS and CBOT data as of their respective report dates in 2026. They will be superseded by the next monthly WASDE release, the next NASS survey, and the next trading session. What doesn't get superseded is the method: check acreage against the NASS report, check yield against the current Crop Production survey, check ending stocks against ERS's outlook page, and check price against real-time CBOT quotes rather than a cached number. Whether you're learning how to buy wheat futures for the first time or you're a farm operator deciding how much of the current crop to hedge, that sequence — acreage, yield, stocks, price — is the same one USDA's own analysts use, and it works regardless of which direction the market happens to be moving when you read this.
FAQs
- How do I actually buy wheat futures if I've never traded commodities before?
Open an account with a broker registered to clear CME Group/CBOT grain contracts, fund it to the required margin level, and place an order on a specific contract month such as ZWU26 (September 2026). Each contract covers 5,000 bushels; confirm current margin requirements with your broker since they change with market volatility. - What is the current corn market forecast?
USDA NASS's August 2026 survey estimated 2026/27 US corn yield at 180.7 bushels/acre on 95.3 million planted acres (June 30, 2026 acreage report), with ERS projecting 42.0 million metric tonnes of ending stocks as of August 14, 2026. Check USDA ERS's corn market outlook page for the current release, since these figures update monthly. - What is the soybean market outlook right now?
USDA NASS put the 2026/27 US soybean yield estimate at 52.7 bushels/acre in its August 2026 survey, on 85.4 million planted acres. The August 2026 CBOT soybean contract (ZSN26) settled at $11.57/bushel on August 6, 2026. Soybean prices remain sensitive to South American harvest size and export demand from major importers. - How can I protect my farm business from fluctuating commodity prices?
Combine tools rather than relying on one: forward contracts with your local elevator, futures hedges or put options through a broker, USDA Risk Management Agency revenue protection insurance, basis contracts, and spreading sales across multiple marketing windows instead of selling the whole crop at harvest. Each trades one risk for another, so match the mix to your storage capacity and balance sheet. - What role do agricultural tariffs play in commodity price forecasts?
Tariffs and retaliatory trade measures change the relative competitiveness of US exports against South American and Black Sea region supply, which feeds directly into USDA's export demand assumptions and, in turn, its ending-stocks and price projections in the monthly WASDE report. - Where do these figures come from and how often are they updated?
Acreage figures come from USDA NASS acreage reports (the cited figures are from the June 30, 2026 report); yield estimates come from NASS's monthly Crop Production surveys (August 2026 survey cited here); ending stocks come from USDA ERS's outlook pages (August 14, 2026 release cited here); and futures prices come from CBOT/NYMEX via Barchart, updated in real time during trading hours. All four update on fixed schedules, so none of the figures above should be treated as permanent.
Earn With Farmonaut: Affiliate Program
Earn 20% recurring commission with Farmonaut's affiliate program by sharing your promo code and helping farmers save 10%. Onboard 10 Elite farmers monthly to earn a minimum of $148,000 annually—start now and grow your income!
Further reading:
Farmonaut Subscriptions

 Raintree Computing
 Agricultural Credit Policy Council
 BayWa
BayWa MCSOD
MCSOD Marei Nursery
 eKGIS
eKGIS Mostas Tech
 Native Seeds
 Andex
Andex FCF India
 Unifrutti Gulf
 Deluxe Conseil
 TVS Electronics
 WICO
WICO Chimera Innovation
 SkyHarvest
