

Weather data · Farm guide
Oktas: The 0-8 Cloud Cover Scale and How Farms Use It
An okta is one eighth of the sky: 0 oktas is clear and 8 is fully overcast (Bureau of Meteorology). Here is the full scale, its METAR codes, station charts and what a reading can tell a farm manager.
Key takeaways
- Oktas run from 0 (clear) to 8 (overcast). Any trace of cloud is at least 1, and any trace of blue is at most 7 (Bureau of Meteorology).
- In aviation summaries, METAR codes map to oktas: FEW is 1-2, SCT is 3-4, BKN is 5-7 and OVC is 8.
- Solar radiation ranges from about 75% of top-of-atmosphere radiation on a cloudless day to about 25% under extremely dense cloud (FAO-56).
- Clear, calm nights are the classic radiation frost setup, and UV can stay high under cloud (FAO, WHO).
- Oktas do not record cloud thickness or height, so use them with other data.
In this article
- The okta scale from 0 to 8
- How oktas map to METAR codes and forecast words
- How to estimate oktas by eye
- Clear and cloudy days at Australian stations
- What cloud cover changes on a farm
- Sky reading to solar energy calculator
- Where oktas fall short
- Oktas compared with satellite views of your fields
- FAQ
Oktas measure cloud cover in eighths of the sky: 0 oktas is a clear sky and 8 oktas is fully overcast. Australia’s Bureau of Meteorology describes the same method for its climate records: an observer looks at the sky dome and estimates how many eighths are covered.
This guide gives the full scale, how it maps to METAR codes and forecast words, and what a reading can and cannot tell a farm manager. It also has station charts and a calculator that turns a sky reading into a rough solar energy figure.
The okta scale from 0 to 8
One okta is one eighth of the sky. The name comes up in weather station reports, aviation forecasts and weather maps. The table below gives each value with its share of the sky and a plain description.
| Oktas | Share of sky | What you see |
|---|---|---|
| 0 | None | Completely clear, no trace of cloud |
| 1 | 1/8 or a trace | Any trace of cloud in a blue sky |
| 2 | 2/8 | A quarter of the sky covered |
| 3 | 3/8 | Scattered cloud, under half covered |
| 4 | 4/8 | Half the sky covered |
| 5 | 5/8 | Broken cloud, over half covered |
| 6 | 6/8 | Three quarters covered |
| 7 | 7/8 or nearly all | Any trace of blue in a cloudy sky |
| 8 | All | Fully overcast, no blue visible |
Two edge rules matter. The Bureau records any trace of cloud in a blue sky as 1 okta, and any trace of blue in a cloudy sky as 7 oktas. So 0 and 8 are kept for skies that really are fully clear or fully covered.
You may also see a 9. In the SYNOP weather code, an extra value of 9 means the sky cannot be seen at all, usually because of dense fog or heavy snow. It is not “more cloud than 8”. It means the observer could not judge the sky.
Okta or octa?
Both spellings appear in print. “Okta” is the form used by the Bureau of Meteorology and in the US automated station handbook, so we use it here. The plural is oktas.
How oktas map to METAR codes and forecast words
Pilots and airfield staff read cloud as codes, and farmers read forecasts as words. Both connect back to eighths of the sky. A US National Weather Service METAR key lists the codes: CLR, FEW, SCT, BKN and OVC, each followed by a cloud height in hundreds of feet. So BKN015 means broken cloud at 1,500 feet.
The ASOS User’s Guide for US automated stations gives the link between measured sky cover and the human equivalent in oktas.
| METAR code | Meaning | Human equivalent | ASOS sky cover |
|---|---|---|---|
| CLR | Clear below 12,000 ft | 0 oktas | 0 to under 5% |
| FEW | Few | Over 0 to 2/8 | 5 to under 25% |
| SCT | Scattered | Over 2/8 to under 4/8 | 25 to under 50% |
| BKN | Broken | Over 4/8 to under 8/8 | 50 to under 87% |
| OVC | Overcast | 8/8 | 87 to 100% |
A common aviation summary gives whole values: FEW is 1 to 2 oktas, SCT is 3 to 4, BKN is 5 to 7 and OVC is 8. One point catches people out. CLR on an automated report means no cloud was detected below 12,000 feet. High cloud above that level can still be there, so a CLR report does not prove a sunny sky.
Forecast words in eighths
The National Weather Service forecast terms use opaque cloud, in eighths, for its sky words: clear or sunny is 1/8 or less, mostly clear is 1/8 to 3/8, partly cloudy is 3/8 to 5/8, mostly cloudy is 5/8 to 7/8, and cloudy is 7/8 to 8/8. Note the word “opaque”. Thin, see-through cloud may count in an okta estimate yet barely change a forecast word.
Chart
Sky cover band for each METAR code
Percent of sky measured by US automated (ASOS) stations
How to estimate oktas by eye
You need no equipment, only a wide view of the sky and a repeatable habit. These steps suit a farm record book or a crew log.
- Stand where trees and buildings block as little sky as you can manage.
- Split the sky in your head into four quarters.
- Mentally push all the cloud together, then ask how many eighths it would fill.
- Apply the edge rules: any trace of cloud is at least 1, any trace of blue is at most 7.
- Write down the value, the time and the cloud type if you know it, such as thin high cloud or thick low cloud.
- Read at the same times each day. The Bureau uses 9 am and 3 pm for its clear and cloudy day counts.
Different people may give different values for the same sky. Train staff together on the same sky, and compare notes against a nearby station report now and then. Steady habits make the record more useful for spotting patterns across a season.
Clear and cloudy days at Australian stations
Long okta records show how a place’s sky changes through the year. The Bureau counts a clear day when the mean of the 9 am and 3 pm readings is 2 oktas or less. A cloudy day has a mean of 6 oktas or more. The cut-offs were 2.5 and 5.5 oktas in earlier records, so the definition has shifted slightly over time.
Chart
Clear and cloudy days by month at Longerenong, Victoria
Mean days per month, 1970-2000
The Longerenong station sits in the Wimmera grain belt of Victoria. Its 1970 to 2000 averages give 75.8 clear days and 114.4 cloudy days a year, with July the cloudiest month at 13.1 cloudy days and February the clearest at 11.1 clear days.
Places differ a lot. Amberley in southeast Queensland averages 99.1 cloudy days a year, Adelaide Airport 138.7 and the former Melbourne Regional Office 179.4. Record periods differ between these stations, so treat the comparison as a broad guide. To compare your own district, look up the nearest open station.
Chart
Mean cloudy days per year at four Australian stations
Bureau cloudy-day counts (mean of 6 oktas or more at 9 am and 3 pm, 5.5 in earlier records). Periods: 1952-2010 to 1970-2000
What cloud cover changes on a farm
Here are seven ways a sky reading can help. An okta value is one input in each case, never the whole decision.
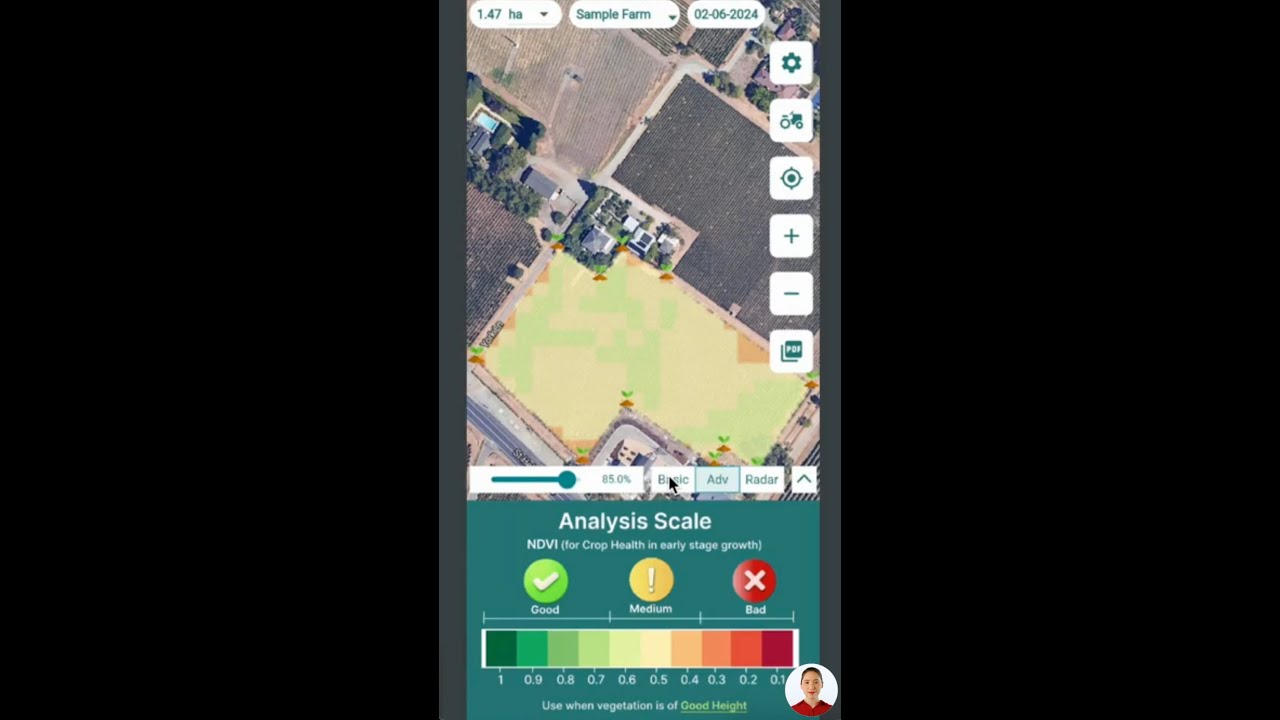
▶ How to interpret satellite data for agriculture · 4:01
1. Solar energy reaching the crop
Cloud reflects and absorbs sunlight. FAO Irrigation and Drainage Paper 56 says solar radiation on a cloudless day is roughly 75% of the radiation at the top of the atmosphere. Under extremely dense cloud, about 25% may still arrive, mainly as diffuse light. That range is the base of the calculator below.
2. Crop water use and irrigation timing
FAO-56 notes that water loss from crops is greater in sunny, warm weather than in cloudy, cool weather. Solar energy is one driver. Air temperature, humidity and wind matter as well, so a dull but windy, dry day can still pull water from the crop. Use oktas as a prompt to check your evapotranspiration figure and soil moisture, then decide. Do not skip irrigation on sky colour alone.
3. Frost risk on clear, still nights
This use is often missed. The FAO frost protection manual describes radiation frosts as having a clear sky, calm or very light wind, a temperature inversion and low dew point. A low evening okta reading with little wind is therefore a warning sign in frost season. The same manual also notes that advection frost comes with cloudy conditions and moderate to strong wind, so cloud does not rule out frost. Check the forecast minimum and your own thermometers.
4. Leaf wetness and disease scouting
Leaf diseases such as tomato early blight depend on wet leaves more than on cloud as such. Penn State Extension, in a tomato home-garden guide, says the early blight fungus needs a wet surface to germinate and grow, and points to morning dew on low leaves as ideal for it. It also links Septoria leaf spot to high humidity with wet foliage. A run of damp, overcast days is a good reason to scout, but leaf wetness and humidity sensors or a local disease model will tell you more. Any spray decision should follow the product label, local rules and your adviser’s advice.
5. Sun safety for field crews
Overcast does not mean safe. The World Health Organization says UV levels are highest under cloudless skies but can be high even with cloud cover. Keep hats, sunscreen and shade plans on broken and overcast days, and follow your local UV index and workplace rules.
6. Timing of field work and site visits
A clear sky gives good light for inspections, photos and drone flights, while low cloud or fog can limit visibility on tracks and work sites. Low ceilings matter for anything airborne, so check the METAR or a local aviation forecast and the rules for your flights. Oktas alone do not give the cloud height, which is why METAR groups pair the amount with a height.
7. Solar-powered equipment
Pumps, sensors and remote gates running on solar panels make less power under heavy cloud. Monthly cloudy-day counts for your nearest station can hint at when a battery or backup source may be under more strain, though shorter winter days matter too. Size equipment from your supplier’s figures and measured solar data for the site, not from okta counts alone.
Sky reading to solar energy calculator
This tool draws a straight line between FAO’s clear-sky and dense-cloud figures. It gives a planning estimate of the solar energy reaching the ground at your okta reading. FAO-56 also gives the conversion from energy to equivalent evaporation: multiply MJ per square metre per day by 0.408. That result is the same energy expressed in water terms, not your crop’s actual water use.
Try the numbers for your own farm below.
Calculator
How much solar energy reaches your field at this sky reading?
Enter your okta reading and your site’s top-of-atmosphere radiation.
- Clear-sky solar energy: 22.5 MJ/m2/day
- Equivalent evaporation at this reading: 6.1 mm/day
- Equivalent evaporation, clear sky: 9.2 mm/day
Example values only, not a forecast. Look up top-of-atmosphere radiation (Ra) for your latitude and month in FAO-56 Annex 2. The 75% and 25% defaults are FAO-56’s general clear-sky and dense-cloud figures. The straight line between them is our simplification: real cloud thickness can move the result a lot. The 0.408 factor is from FAO-56. Results are energy in water terms, not crop water use.
Where oktas fall short
The scale counts how much sky is covered, not how thick the cloud is. As Wikipedia’s entry on oktas points out, this limits their use for estimating solar radiation at the surface. Eight oktas of thin high cloud and eight oktas of dark storm cloud get the same number but let through very different amounts of light.
- No cloud type: add a note on thin, thick, high or low cloud.
- No height: use METAR groups when the ceiling matters.
- One moment: a single reading can miss a sky that changes by the hour.
- One point: your paddock’s sky can differ from that at a station miles away.
- Observer differences: two people may record different values, and automated sensors measure differently from human eyes.
If a decision depends on the actual amount of sunlight, use a pyranometer or a solar radiation record from a nearby station. FAO-56 also gives methods that estimate solar radiation from sunshine hours, using recommended values of 0.25 and 0.50 where no local calibration exists.
▶ Crop health monitoring from space, explained with memes · 4:09
Oktas compared with satellite views of your fields
Ground readings look up, and satellites look down. Satellites on geostationary orbits can estimate cloud cover over wide areas. Optical crop monitoring satellites have a different concern: cloud hides the field. Sentinel-2 has a design revisit of 5 days at the Equator, but a global study of Landsat and Sentinel-2 revisit found that cloud contamination is one of the factors that shapes how many usable observations you get.
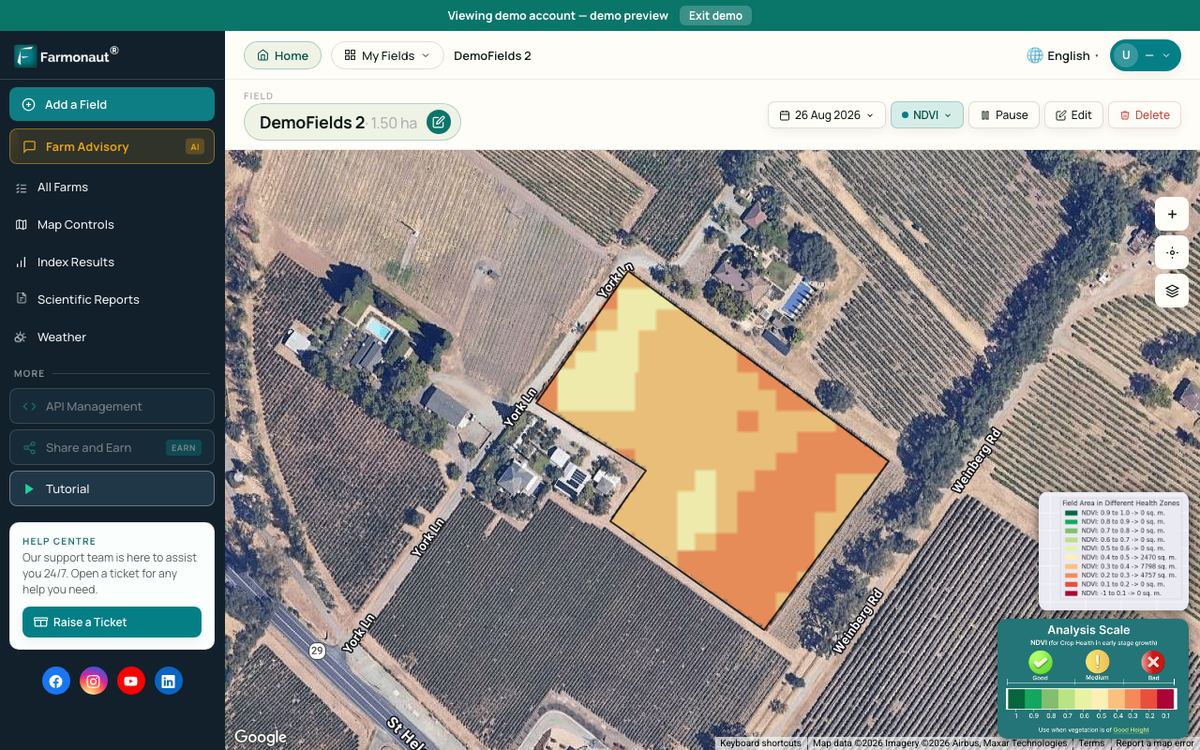
That is why a wet, cloudy stretch can leave a gap in crop imagery just when you want a look. Plan field walks for those gaps, and use the next clear image to see where to go first. Farmonaut uses satellite imagery to show vegetation change across a field. It shows that a change happened, not its cause, so a ground check is still needed.
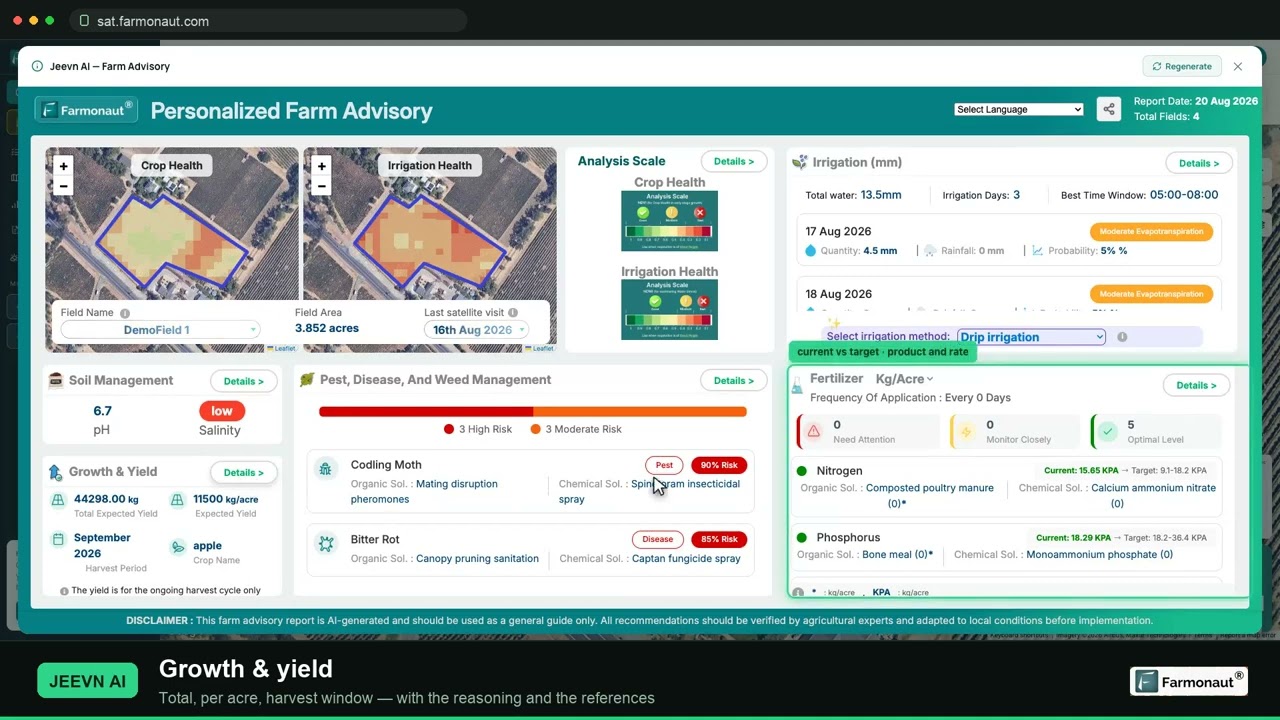
▶ A walkthrough of satellite crop monitoring and how to read NDVI · 19:36
FAQ
What does 8 oktas mean?
The sky is fully overcast with no blue visible. Any trace of blue would make it 7 oktas under the Bureau of Meteorology’s rule.
What does 4 oktas look like?
Half of the sky is covered once you mentally gather all the cloud into one area. The sky may look busier than that when the cloud is spread out, so take your time with the estimate.
How many oktas is overcast or broken?
Overcast (OVC) is 8 oktas. Broken (BKN) is 5 to 7 oktas. Scattered (SCT) is 3 to 4 and few (FEW) is 1 to 2.
How do I convert oktas to percent?
Divide by 8 and multiply by 100, so each okta is 12.5% of the sky. 3 oktas is 37.5% and 6 oktas is 75%. This is simple arithmetic; the percentage bands that automated stations use for each code are slightly different, as the METAR table above shows.
What is a clear day or cloudy day in okta terms?
In Bureau of Meteorology climate statistics, a clear day has a mean of 2 oktas or less across the 9 am and 3 pm readings. A cloudy day has a mean of 6 oktas or more. Other weather services may use different definitions.
Can cloud readings replace soil moisture checks?
No. A sky reading only gives a hint about crop water demand. Temperature, humidity, wind, crop stage and soil all count, so use it with soil moisture and an evapotranspiration estimate.
Related pages on our site: satellite-based mineral detection, mining site mapping, mining query form and contact page.
Farmonaut crop monitoring
See your own fields from space
Check vegetation change across your fields between cloudy spells.



Sources
- Australian Bureau of Meteorology, Climate statistics definitions (accessed November 2026): bom.gov.au
- Bureau of Meteorology, Longerenong climate statistics, 1970-2000 cloud averages: bom.gov.au
- Bureau of Meteorology, Melbourne Regional Office climate statistics, 1955-2010 cloud averages: bom.gov.au
- Bureau of Meteorology, Amberley AMO climate statistics: bom.gov.au
- Bureau of Meteorology, Adelaide Airport climate statistics: bom.gov.au
- NOAA/NWS, ASOS User’s Guide: weather.gov
- US National Weather Service, Forecast terms (Binghamton office): weather.gov
- US National Weather Service, METAR/TAF decode key: weather.gov
- Wikipedia, Okta (citing the UK Met Office Observer’s Handbook): en.wikipedia.org
- FAO, Irrigation and Drainage Paper 56, Chapter 3: Meteorological data (1998): fao.org
- FAO, Frost protection: fundamentals, practice and economics, Vol. 1 (2005): fao.org
- World Health Organization, Ultraviolet radiation fact sheet: who.int
- Penn State Extension, Tomato diseases and disorders in the home garden: extension.psu.edu
- Copernicus SentiWiki, Sentinel-2 mission: sentiwiki.copernicus.eu
- Li and Chen, Global revisit interval analysis of Landsat-8/-9 and Sentinel-2A/-2B (Sensors, 2020): ncbi.nlm.nih.gov
Discussion
Questions, corrections or field experience? Share them below. First-time comments are reviewed before they appear, and your email is never published.
No comments yet. Be the first to add a question or your experience.

 Sarvome
 Polaris Digitech
 Teledarbas
 Wild Oak Farm
 SFX
 BACF Africa
 Doodlakine
 Exurbia Geospatial
 FieldZero
 Indico Company
 Kubota
 FFBS
 Jontra

 Licence holder · Niger · Gold
 Client · Tanzania · Gold










