

How to Estimate a Used Tractor’s Resale Value Using Hours, Condition, and Farm Data
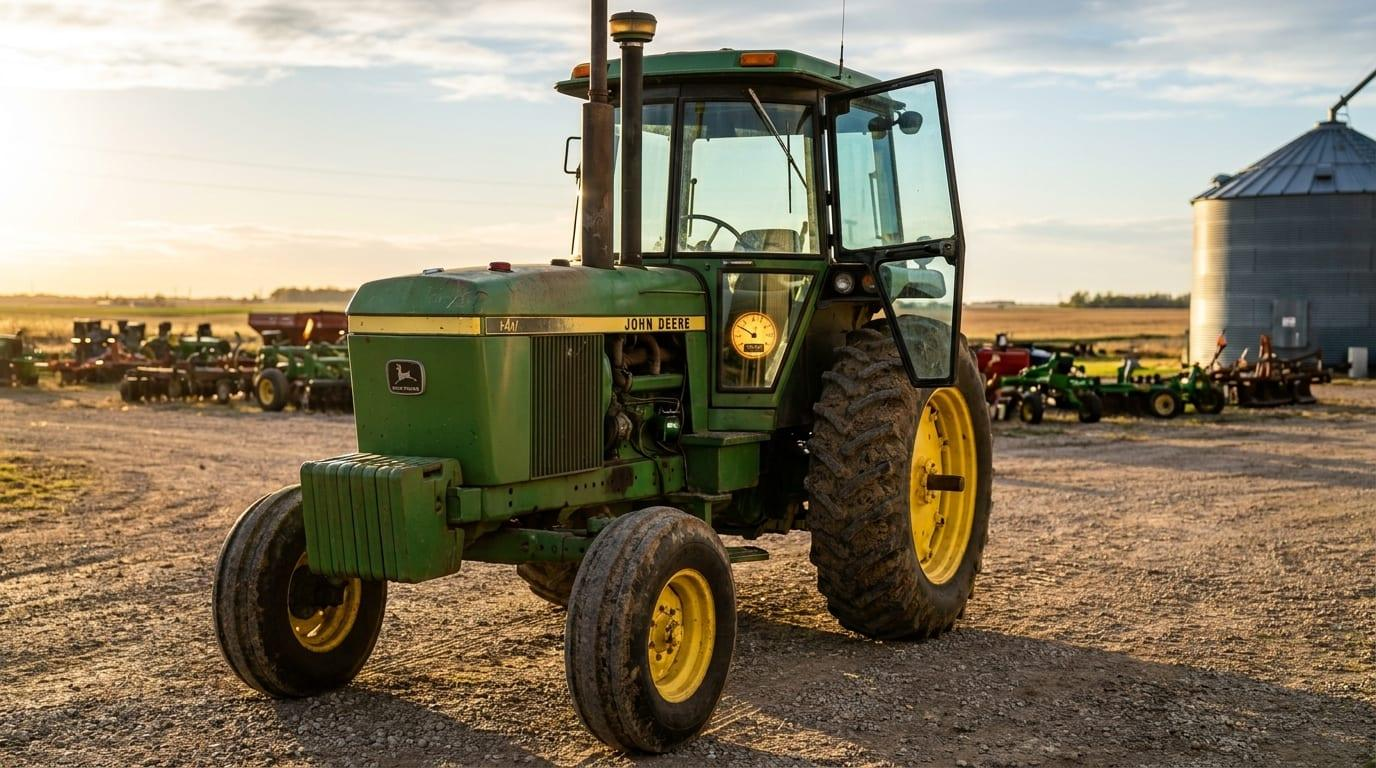
A used tractor’s price tag rarely matches what it’s actually worth. Two machines from the same model year, sitting side by side at an auction, can be worth thousands of dollars apart once you factor in how each one was used, how it was maintained, and what records exist to back that up. Estimating resale value accurately means combining three inputs: age-based depreciation, hours of use, and documented condition.
Farmers and buyers who understand how these factors interact can avoid overpaying at purchase and avoid underselling when it’s time to trade up. The same logic that satellite-based farm monitoring platforms apply to tracking equipment utilization and field operations also applies here: consistent, granular usage data produces a more defensible number than a gut estimate.
Why Age Alone Never Tells the Full Story
A tractor’s model year sets a starting point, not a final answer. Farm equipment depreciation typically follows a steep curve early on, with many machines losing roughly 12 to 15 percent of their ex-showroom value in the first year alone. After the five-year mark, that rate usually slows to somewhere between 5 and 8 percent annually as the depreciation curve flattens.
Farm management extension research uses a related concept called a remaining value factor, calculated from auction data across thousands of transactions. A 300-horsepower tractor used around 400 hours per year, for example, may retain only about 28 percent of its current list price after 12 years. That figure becomes the base value before any hour or condition adjustments are applied.
What Counts as Normal Hours Per Year
Average annual hours is the single most useful diagnostic number in a tractor valuation, and it is simple to calculate: total hours divided by the tractor’s age in years.
The benchmark ranges vary by tractor class and application:
- General farm and property tractors: roughly 200 to 400 hours per year is considered typical.
- Row-crop and full-time production tractors: some valuation guides place normal usage closer to 500 to 800 hours per year.
- Compact tractors under 5 years old with fewer than 500 total hours are often treated as low-use machines capable of commanding near-new pricing.
A tractor running well below its class benchmark can justify a premium over straight age-based depreciation. One running well above it should carry a discount, particularly when physical wear confirms the heavier use.
Turning Hours Into a Dollar Adjustment
Once the average annual hours figure is calculated, it gets converted into an adjustment against the depreciated base value. Detailed valuation calculators typically apply an engine hours adjustment ranging from roughly 1,000 to 15,000 dollars or more, scaled to the tractor’s size and class, and applied as a positive or negative figure depending on whether usage sits above or below the norm for that age.
This is also where documented usage patterns become valuable. A tractor appraisal supported by clear service and hour logs gives a buyer or lender confidence that the reported number reflects reality rather than a rolled-back odometer or an estimate. Farms that track equipment usage through digital fleet monitoring or maintenance software tend to produce exactly this kind of defensible record.
Condition Adjustments: What Actually Moves the Number
Hours describe how much a tractor worked. Condition describes how well it held up. The two do not always agree, and when they disagree, condition often carries more weight in the final price.
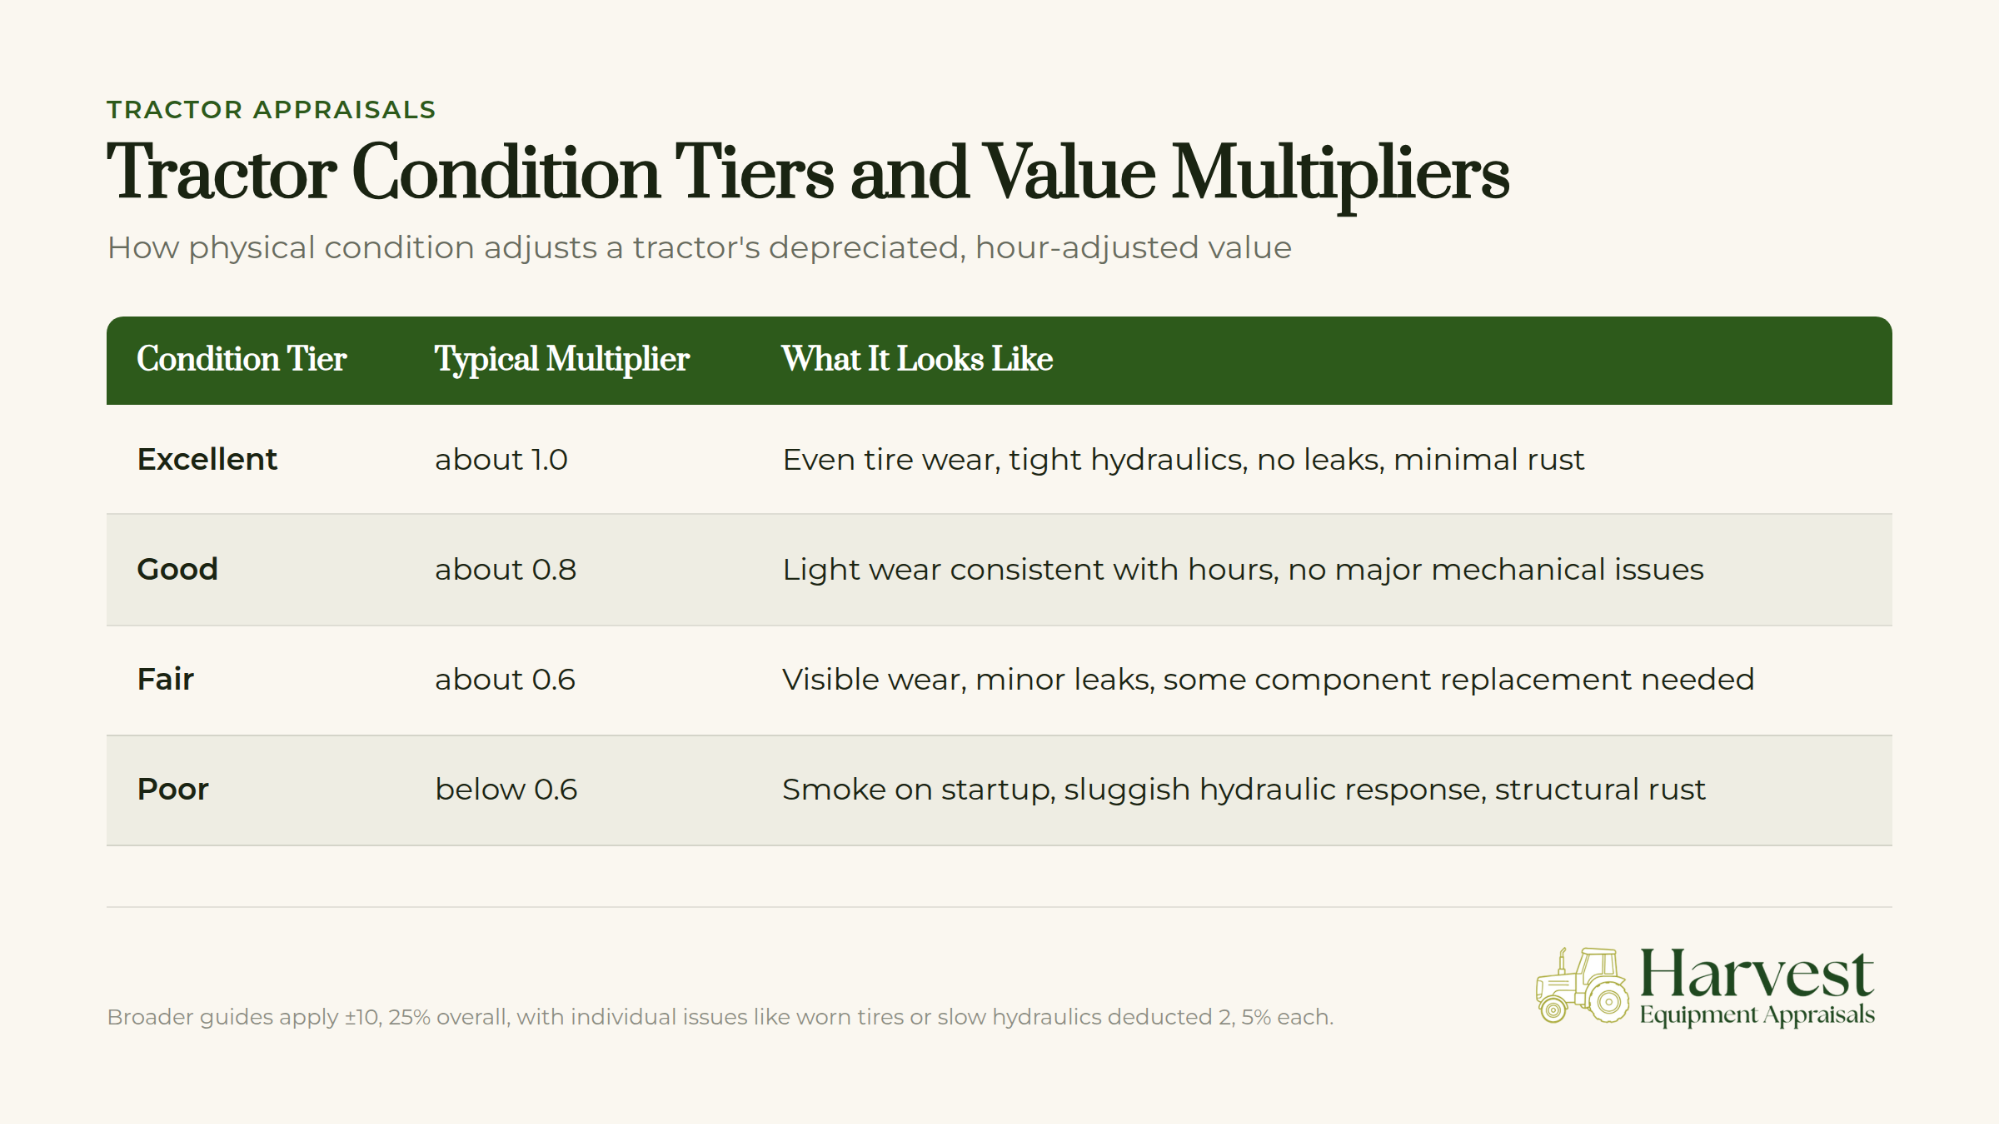
A useful way to frame condition is as a multiplier applied to the depreciated, hour-adjusted value:
| Condition tier | Typical multiplier | What it looks like |
|---|---|---|
| Excellent | about 1.0 | Even tire wear, tight hydraulics, no leaks, minimal rust |
| Good | about 0.8 | Light wear consistent with hours, no major mechanical issues |
| Fair | about 0.6 | Visible wear, minor leaks, some component replacement needed |
| Poor | below 0.6 | Smoke on startup, sluggish hydraulic response, structural rust |
More granular guides apply a broader condition adjustment band of roughly plus or minus 10 to 25 percent of the depreciated value, and treat each individual issue, such as worn tires, a smoking engine, or a slow hydraulic lift, as an independent 2 to 5 percent deduction. Inspectors should also check whether wear matches the hour reading. Heavy seat, pedal, or drawbar wear on a tractor claiming low hours is a red flag worth investigating before accepting the listed number.
Why a Higher-Hour Tractor Can Still Win
Hours and condition interact in ways that surprise a lot of buyers. A 10-year-old tractor showing 2,500 hours with excellent documentation can genuinely outvalue a 5-year-old unit with 6,000 hours and no service history, because the older machine’s usage rate and maintenance trail both point to careful ownership.
A sharper example: a 3,000-hour tractor with incomplete records, worn tires, fluid leaks, and drawbar scarring may end up priced below a 4,500-hour tractor that comes with a full maintenance log and visibly well-kept sheet metal and controls. Age matters, and hours matter, but the story those numbers tell together, backed by evidence, usually matters most.
The Role of Farm Records and Documentation
Documentation is often the most underused lever in a tractor sale. A complete paper trail, meaning invoices, service records, and a clean title with no outstanding loan hypothecation, can add roughly 3 to 6 percent to a tractor’s value compared to an identical machine sold without records.
Buyers and sellers should be prepared to reference:
- Annual hours logged by task, such as tillage, loader work, or transport, since heavy loader duty wears hydraulics differently than light mowing.
- Records of major component work, including engine overhauls or transmission repairs, and whether that work is consistent with the tractor’s visible condition.
- Operating environment, since a tractor that spent its life in dusty or corrosive conditions typically shows more wear than one used on drier, cleaner ground.
- Operator history, since a single dedicated operator generally produces less wear-and-tear variability than a tractor passed among several users.
Farms that keep structured usage records, whether through paper logs or digital tracking tools, put themselves in a stronger negotiating position at resale.
Features That Shift the Price Beyond the Base Formula
Certain configuration details move the needle independently of age, hours, or condition. A factory-matched front-end loader in good working order can add roughly 4,000 to 8,000 dollars to a tractor’s value, while an aftermarket loader typically adds less, closer to 2,000 to 4,000 dollars. A loader with bent arms, cracked mounts, or leaking cylinders can add little or nothing, and may even reduce the offer if a buyer has to budget for repairs.
An enclosed cab with heat and air conditioning commonly adds 5,000 to 10,000 dollars over an open ROPS station, depending on the market and season. Horsepower class and brand reputation also factor into most valuation tools, since some manufacturers and model lines are known to hold value better than others as technology ages.
Putting the Formula Together
A full valuation walks through the same sequence every time: start with a depreciated base value from age, adjust for hours relative to the class benchmark, apply a condition multiplier, add or subtract for documentation, and layer in feature adjustments for loaders, cabs, or brand. Expressed simply, estimated value equals base depreciated value plus condition adjustment plus hours adjustment plus feature adjustments.
Consider a 300-horsepower row-crop tractor, 8 years old, with 3,200 hours, roughly 400 hours per year and squarely within the typical range. Starting from a depreciated base value of around 35 percent of current list price, a good condition rating might apply an 0.8 multiplier, complete documentation adds another 4 percent, and a factory loader in solid shape adds a flat 6,000 dollars. Each of those steps is a separate, checkable line rather than a single guess.
Cross-Checking Against the Local Market
No formula replaces a final reality check against what similar tractors are actually selling for nearby. Regional demand for a specific horsepower band or brand can push prices above or below a theoretical calculation, especially during planting season or after a strong commodity year when equipment turnover increases.
Comparing a calculated estimate against recent local listings and auction results for the same brand, horsepower range, and rough condition tier is the last step before settling on a number. When the two diverge significantly, it usually means either the local market is unusually tight or loose, or one of the earlier adjustments needs a second look.
Discussion
Questions, corrections or field experience? Share them below. First-time comments are reviewed before they appear, and your email is never published.
No comments yet. Be the first to add a question or your experience.

 MISE Maroc
 Drift-Sense
 NWNS
 Hydenmet
 Dirks Bros Farms
 Red August Group
 Farm Inc
 WeMe Global
 Agrotoken
 Blue BearX
 Insignito
 Croptimum
 DnCubed
 Field Capacity
 Indosistim Teknologi
 Liquify Digital
 CU Foods
 BeyondTech Global

 Licence holder · Niger · Gold
 Licence holder · Nigeria · Gold + lithium










