

Reviewed August 2026 against USDA’s Economic Research Service farm sector forecasts, USDA NASS Land Values reports, and ABARES’ Farmland Price Indicator.
Try it: Asset Coverage & Monitoring Cost Calculator →
Agricultural Asset Management: Software, Data and a Way to Check Your Numbers
Agricultural asset management means tracking, valuing and protecting everything a farm owns — land, machinery, growing crops, water rights and the records that prove all of it — in one place that updates as conditions change, instead of an annual guess. The scale involved is not small: USDA’s Economic Research Service (ERS) forecasts total farm sector asset management exposure at $4.54 trillion for 2026, up 3.2% from 2025, with farm real estate alone making up 83% of that figure. Below is what those assets are worth right now in the US and Australia, what farm record management actually requires, and a comparison of the software tiers available to manage it — plus a calculator to run your own numbers.

What Counts as an Agricultural Asset
Farm asset management treats five distinct categories differently, because each is valued and verified a different way:
| Asset type | What it includes | How it’s valued or tracked | Where to check it |
|---|---|---|---|
| Land | Cropland, pasture, farm real estate | Per-acre or per-hectare market value from recent sales | USDA NASS (US); ABARES (Australia) |
| Machinery & fleet | Tractors, harvesters, irrigation rigs, trucks | Depreciation schedule plus GPS/telematics utilization | Equipment ledger + fleet management software |
| Growing crops | Standing crop value before harvest | Vegetation health index (NDVI) and yield estimate | Satellite crop monitoring |
| Water rights & irrigation | Allocations, wells, pivots | Entitlement volume and soil moisture readings | State/regional water authority |
| Records | Compliance, insurance, loan documentation | Audit-trail completeness | FSA/crop insurance filing requirements |
Land dominates the balance sheet. On the ERS forecast, US farm real estate assets reach $3.77 trillion for 2026 — a 3.8% nominal increase from 2025 (1.9% after inflation) — while total farm sector debt rises 5.2% to $624.7 billion, pushing the debt-to-asset ratio to 13.75%, up from 13.49% in 2025. Farm sector equity is forecast at $3.92 trillion. That single ratio — debt against assets — is the number most lenders and investors watch first when assessing an operation’s risk.
Farmland Asset Management: What Land Is Worth Right Now
US farm real estate averaged $4,500 per acre in the 2026 NASS Land Values summary, up 3.4% ($150) from 2025, according to Pro Farmer’s coverage of the report, released August 5, 2026. Cropland reached a record $6,020 per acre (+3.3%, +$190), and pasture hit a record $2,000 per acre (+4.2%, +$80). A year earlier, per the American Farm Bureau Federation’s market intel on the August 2025 release, farm real estate stood at $4,350 per acre, cropland at $5,830, and pasture at $1,920. That is a fifth straight year of increases across every category tracked.
Australia: The ABARES Farmland Price Indicator
Australian broadacre farmland has grown at an average annual rate of 9.8% over the decade to March 2026, though the pace slowed across 2025, per reporting on the ABARES Farmland Price Indicator. Regional growth diverged sharply over that decade: Tasmania averaged 14.5% annual growth and Victoria 13.3%, both well above the national figure. ABARES publishes the Farmland Price Indicator on a recurring schedule, so a Victorian or Tasmanian operation should pull the current regional breakdown rather than apply the national average.
How to Check the Current Figure Yourself
NASS republishes farm real estate values every August, and ERS updates the farm sector balance sheet forecast several times a year. Before valuing land on your own register, check the NASS farm real estate value map for the current release date and figure rather than relying on last year’s number.
Farm Record Management: What Lenders and Insurers Expect
Farm record management is not optional bookkeeping — it is the audit trail that crop insurance claims, farm loan underwriting and tax filings all draw on. Lenders reviewing a farm’s balance sheet against the debt-to-asset ratio above want production history, input-application logs and harvest weights that tie back to specific fields and dates, not a single annual total. A farm management website or app that logs this continuously, rather than at tax time, is what turns a compliance chore into a usable asset register. To see how a continuous record feeds directly into farm management, open Farmonaut’s web application.

Agriculture Asset Software: Comparing the Three Tiers
Most operations sit in one of three tiers of agriculture asset software, and each has a different failure point:
| Tier | Typical tools | What it tracks | Where it falls short |
|---|---|---|---|
| Spreadsheets & paper logs | Excel/Sheets, field notebooks | Basic input/output ledger, planting dates | No live condition data; entries lag days to weeks |
| Generic farm record apps | Standalone task/expense trackers | Task logs, expense tracking, basic mapping | Rarely linked to real-time land condition or valuation |
| Satellite-based platforms | e.g. Farmonaut web/app | Real-time NDVI, soil moisture, fleet and AI advisory tied to one register | Needs connectivity and periodic ground-truthing |
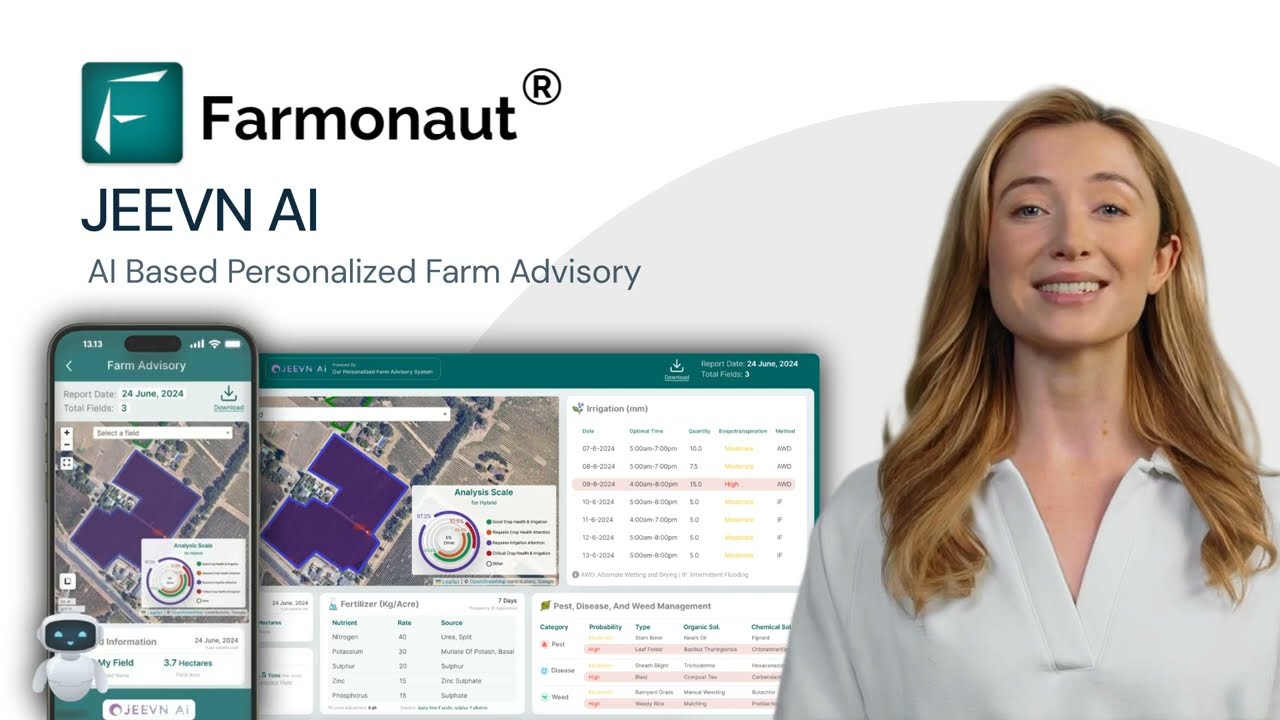
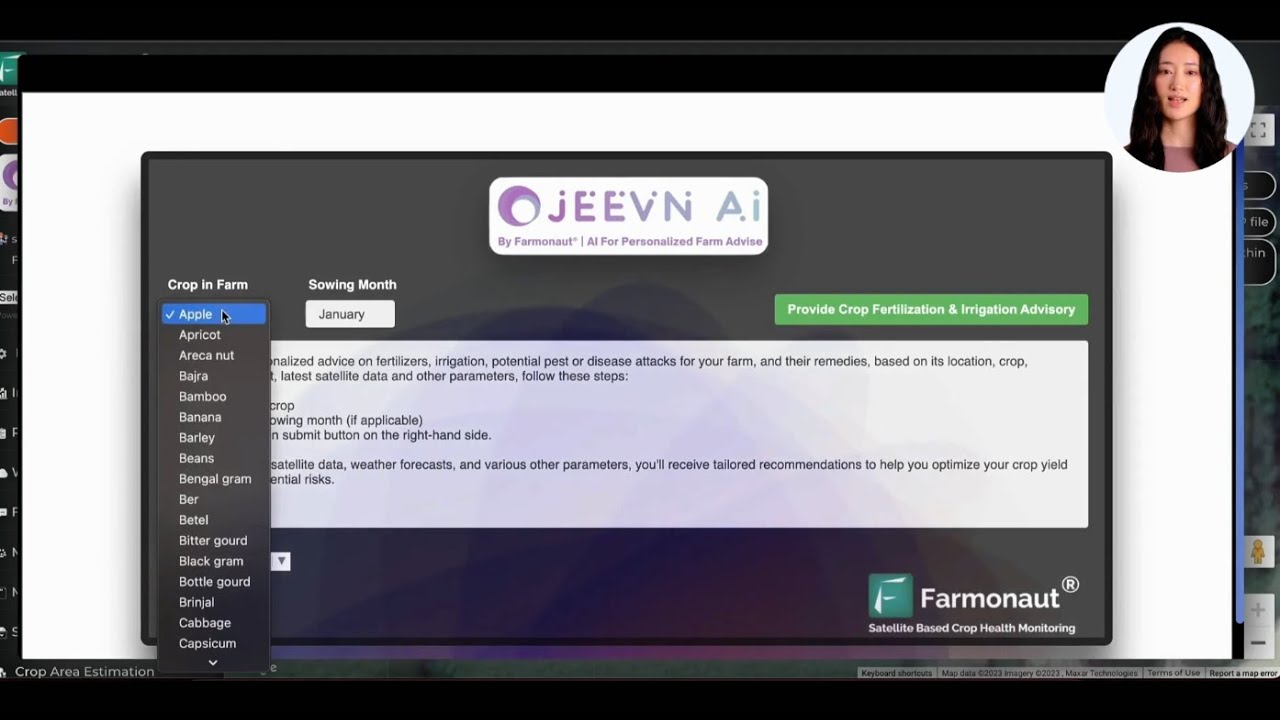
Farmonaut’s Jeevn AI advisory system sits in the third tier: it combines satellite imagery, weather data and historical performance into per-farm recommendations rather than generic averages.
Blockchain-based traceability is the other piece of the third tier: it timestamps supply-chain movements so investors and buyers can verify a record wasn’t edited after the fact. A walkthrough of the advisory system in practice is below.
Agricultural Asset Tracking: Equipment, Fleet and Crops in the Field
Tracking physical assets matters most at scale, and US farm structure keeps consolidating: the 2022 Census of Agriculture counted 1,900,487 US farms, a 7% drop from 2017, while average farm size rose 5% to 463 acres and total land in farms fell 2.2% to 880 million acres. Fewer, larger operations is exactly the pattern behind rising adoption of precision tools. ERS’s 2023 survey data shows autosteer guidance systems on 70% of large-scale crop farms and 52% of midsize farms, while yield monitors, yield maps and soil maps combined reached 68% of large-scale farms. ERS classifies small family farms as those with gross cash farm income under $350,000 — the segment with the lowest adoption in every category measured.

Fleet and resource management tools extend the same tracking logic to machinery: GPS-linked utilization data replaces a static equipment list, so a tractor sitting idle shows up as a cost against the asset register, not just a line on a depreciation table.
Smart Farming Investment: From Monitoring Data to Capital Decisions
Smart farming investment decisions rest on four inputs the sections above already cover: a current land value, a debt-to-asset position, a real-time condition read on the crop, and a record set that survives an audit. Early-warning monitoring (pest and drought detection), weather forecasting, and diversification recommendations based on local conditions all feed the same risk-mitigation goal that shows up in the ERS debt-to-asset figure — protecting equity, not just yield. To move from concept to your own numbers, use the calculator below with your actual acreage and costs.
Asset Coverage & Monitoring Cost Calculator
Assumptions: figures are simple annual arithmetic, not compounded; it excludes labor cost of manual monitoring, financing costs, and any yield gain beyond input savings. Land and equipment values are what you enter, not an appraisal.
For risk management on the go, Farmonaut’s mobile apps carry the same asset register:


A Checklist for Building an Agricultural Asset Management System
- Inventory every asset class separately — land, machinery, growing crops, water rights, records — using the taxonomy table above, and assign each a value and a re-check date.
- Pull a real per-acre or per-hectare land benchmark from NASS (US) or ABARES (Australia) at least once a year, and log the source date beside the figure.
- Attach real-time condition data — NDVI, soil moisture — to the land value so it reflects this season’s crop, not last season’s appraisal.
- Track machinery with a depreciation schedule plus telematics utilization, not a static purchase list.
- Keep one audit-ready record set — planting dates, input applications, harvest weights — built once and exportable to both a lender and a crop-insurance claim.
- Recalculate your debt-to-asset ratio whenever debt or the land benchmark changes; ERS republishes the farm sector forecast several times a year.
- Review the whole register quarterly, not annually — US land values moved 3.3–4.2% in the single year from 2025 to 2026, fast enough to outdate a static number.
Where This Is Headed
Three developments are already changing what the register above looks like next: ground-level IoT sensors combined with satellite passes for finer-grained monitoring, machine-learning models trained on longer yield histories for better forecasts, and automated task triggers that act on a threshold (a soil-moisture reading, a pest-detection alert) without waiting for a manual review.

FAQ
- Q: What is a farm management website, and how is it different from a spreadsheet?
A: A farm management website centralizes records, mapping and (in the satellite-based tier) live field condition data in one login, updated continuously. A spreadsheet only holds what’s manually entered, so it lags days to weeks behind actual field conditions. - Q: What records do I actually need for farm record management?
A: At minimum: planting and harvest dates, input applications by field, yield weights, and any insurance or loan documentation tied to those fields. Crop insurance claims and farm loan underwriting both draw on this same record set, so building it once and exporting it twice is more efficient than keeping separate logs. - Q: How often is satellite monitoring data updated?
A: Update frequency depends on the subscription tier and satellite pass schedule — some areas get daily coverage, others every few days. Check Farmonaut’s current subscription plans below for the specific cadence attached to each tier. - Q: Does agriculture asset software work for a small farm, or only large operations?
A: Farmonaut’s tools scale from individual fields to large agribusiness portfolios. Adoption data shows large-scale farms lead on autosteer (70%) and yield/soil mapping (68%), but the software itself is not restricted by farm size. - Q: Where do I check today’s land values instead of relying on this page?
A: US readers should check the current NASS farm real estate value map; Australian readers should check the current ABARES Farmland Price Indicator release. Both are republished on a set annual or quarterly schedule, so the newest figure will always be more current than a page like this one. - Q: What return should I expect from agriculture asset software?
A: Farmonaut does not publish an audited average ROI figure, and no single number would apply across farm sizes and crop types. Use the calculator above with your own acreage, input costs and expected savings percentage to model the payback for your specific operation.
Earn With Farmonaut: Join our affiliate program and earn a 20% recurring commission by sharing your promo code and helping farmers save 10%. Onboard 10 Elite farmers monthly to earn a minimum of $148,000 annually—start now and grow your income!
For more information about our affiliate program, visit Farmonaut’s Affiliate Program.
Farmonaut Subscription Plans
Ready to put a real asset register behind your farm’s balance sheet? Choose the plan that fits your acreage and start tracking today.
For developers integrating Farmonaut’s satellite and weather data into their own systems, see our API and API Developer Docs.
Agricultural asset management works when the numbers on the page match the numbers in the field. Pull the current NASS or ABARES figure, log its date, and rebuild your register around it — not around last year’s estimate.

 Mostas Tech
 AgroStar
 Native Seeds
 Andex
Andex FCF India
 Unifrutti Gulf
 Deluxe Conseil
 TVS Electronics
 BW Pipelines
 WICO
WICO Chimera Innovation
 SkyHarvest
 Polaris Digitech
 Teledarbas
