

Satellite Grape Farming Advisory: 34 Plots, 2 States

An Indian grower group monitors 39 plots for its member farmers across Pune Division in Maharashtra and Belgaum Division in Karnataka. Thirty-four of them are table grape — and in the week we examined, those thirty-four vineyards were sitting at four different points in the vine’s year. This is what per-plot guidance looks like when one crop is spread across two states and two seasons at once.
A grower group has a harder problem than a farmer. The farmer needs to know what to do on his own land. The group needs to know which of its members to call this week, and what to tell each of them — and the answer is different for every plot, because no two members planted, pruned or picked on the same day. This account is a clean example: 39 separately mapped plots totalling 42.3 acres, held for individual member farmers across two Indian states, with 34 of them under table grape and the rest split between marigold, sugarcane and ber.
In mid-2026 the account submitted feedback on its satellite grape farming advisory — twice, seven weeks apart, and positively on both occasions. On the second submission it reported that the reports had helped optimise irrigation, optimise fertiliser application, and take action on pest, disease and weed pressure. By that date the account had received 791 plot advisories drawn from 40 separate satellite acquisition dates. This article opens that week and traces what the guidance actually said, plot by plot.
Of the 39 plots, 28 were prescribed no fertiliser at all — and 22 of those 28 were at harvest or post-harvest, where the vine has nothing left to fill. Of the 11 plots that were fed, 8 were at veraison, the sugar-accumulation window when the crop genuinely needs feeding. Nutrient followed the vine’s calendar, not the operator’s.
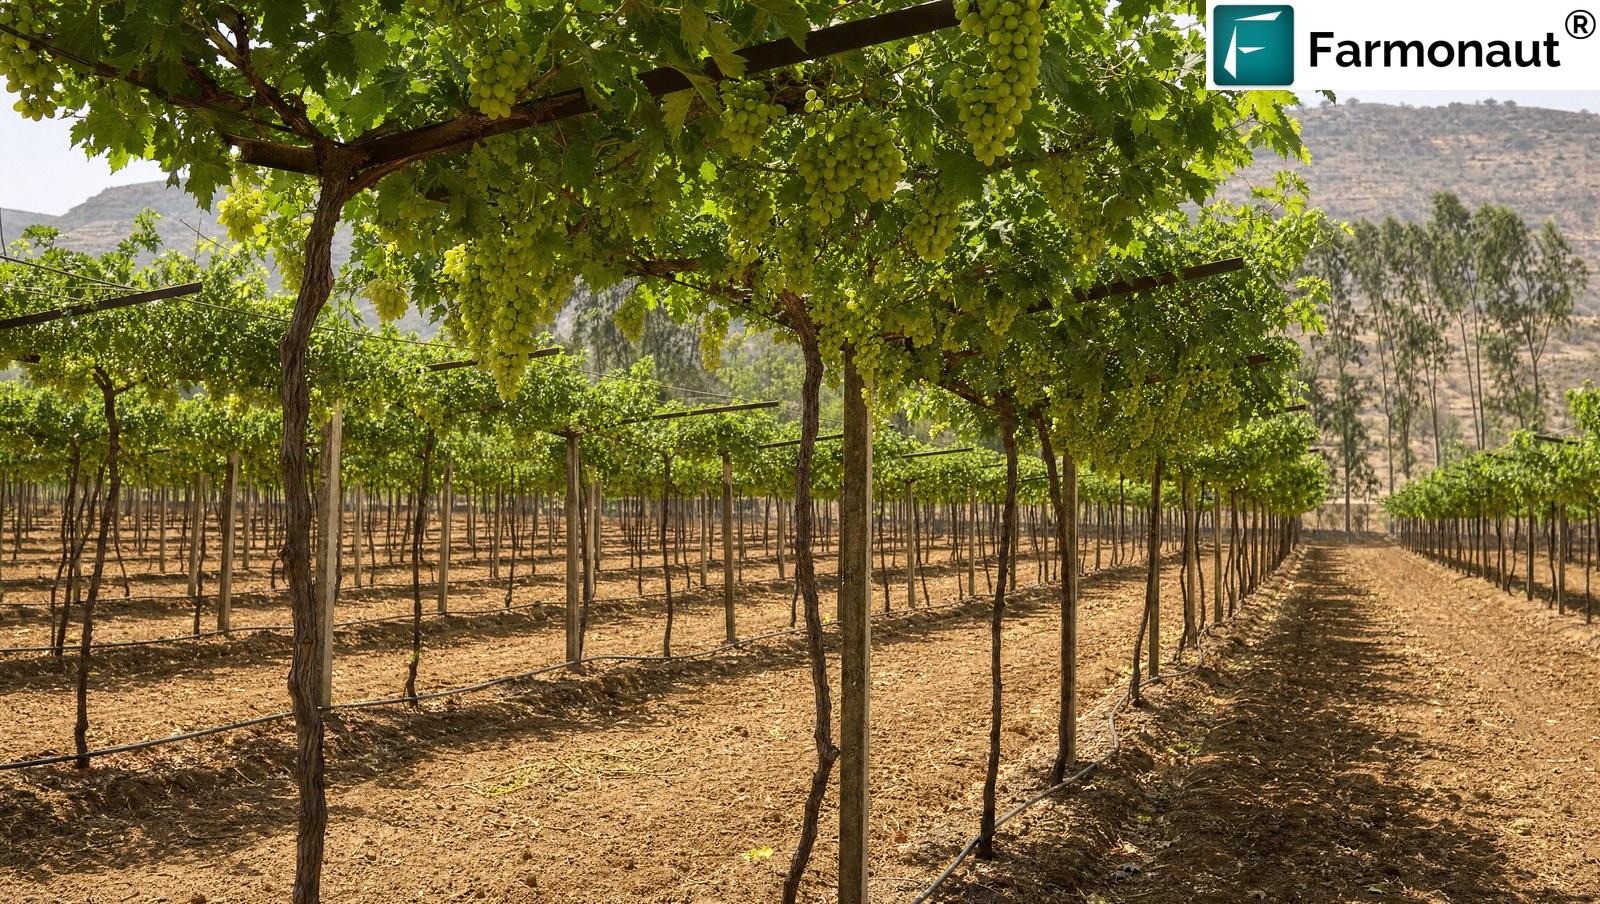

One operator, 39 plots, two states
The group has been monitoring since February 2026. Its plots are small — the median is under an acre, the largest 4.66 acres — which is characteristic of Indian table-grape holdings, where a member’s vineyard is often a single block rather than a farm. What makes the portfolio demanding is not its size but its spread: Pune Division and Belgaum Division are roughly 300 kilometres apart, with different rainfall onset, and the plots within each are at different points in the vine cycle.
| Plot | Crop | Stage | Acres | N kg/ac | P kg/ac | K kg/ac |
|---|---|---|---|---|---|---|
| 1 | Grape | Veraison | 2.04 | 18.2 | — | — |
| 2 | Grape | Veraison | 0.46 | 12.0 | 10.0 | 20.0 |
| 3 | Grape | Veraison | 0.77 | 11.1 | 11.1 | 11.1 |
| 4 | Grape | Veraison | 0.49 | 11.1 | 11.1 | 11.1 |
| 5 | Grape | Veraison | 0.96 | 11.1 | 22.8 | 45.5 |
| 6 | Grape | Veraison | 2.18 | 11.1 | 10.0 | — |
| 7 | Grape | Ripening | 0.86 | 10.0 | — | 45.5 |
| 8 | Grape | Veraison | 4.66 | 10.0 | 10.0 | 20.0 |
| 9 | Grape | Ripening | 0.48 | 1.8 | 1.2 | 4.5 |
| 10 | Grape | Veraison | 1.09 | — | 11.1 | 44.2 |
| 11 | Sugarcane | Ripening | 2.29 | — | — | 18.2 |
| Other 28 plots | No fertiliser required | |||||
Read down the nitrogen column and the point makes itself. Eight of these eleven plots are the same crop at the same stage in the same week, and the prescriptions run from 18.2 kg/acre down to nothing. Plot 10 is told to apply no nitrogen but 44.2 kg/acre of potassium; plot 1 is told the exact opposite — 18.2 kg of nitrogen and no potassium or phosphorus at all. Neither is a rounding difference. They are two vineyards whose soils were read separately and found to need opposite things.
Plot 1 needs nitrogen and nothing else. Plot 10 needs everything except nitrogen. Same crop, same stage, same week.
Buying one blended fertiliser for a whole grower group. A single NPK blend cannot serve plots 1, 5 and 10 at once — one needs nitrogen alone, one needs heavy phosphorus and potassium, one needs no nitrogen whatsoever. On a mixed-stage portfolio a blend is wrong somewhere by definition, and the waste is invisible because the total tonnage still looks reasonable.
Because the plots sit at different latitudes and were imaged on different passes, fresh guidance arrives for some part of the portfolio on most days. Across the monitored period that produced 791 advisories over 40 acquisition dates — an average of roughly twenty plot-reports per satellite pass, each resolved independently.
Thirty-four vineyards of the same grape, and no two of them given the same instruction.

What the satellite grape farming advisory delivers per plot
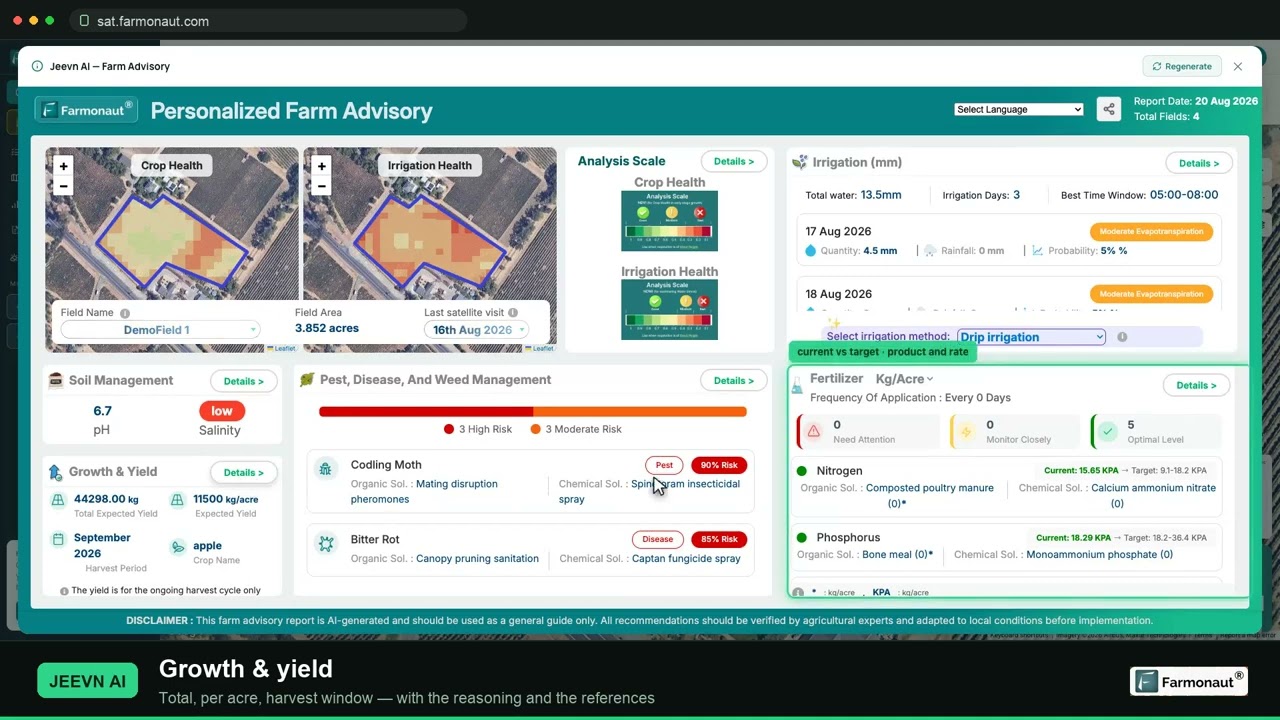
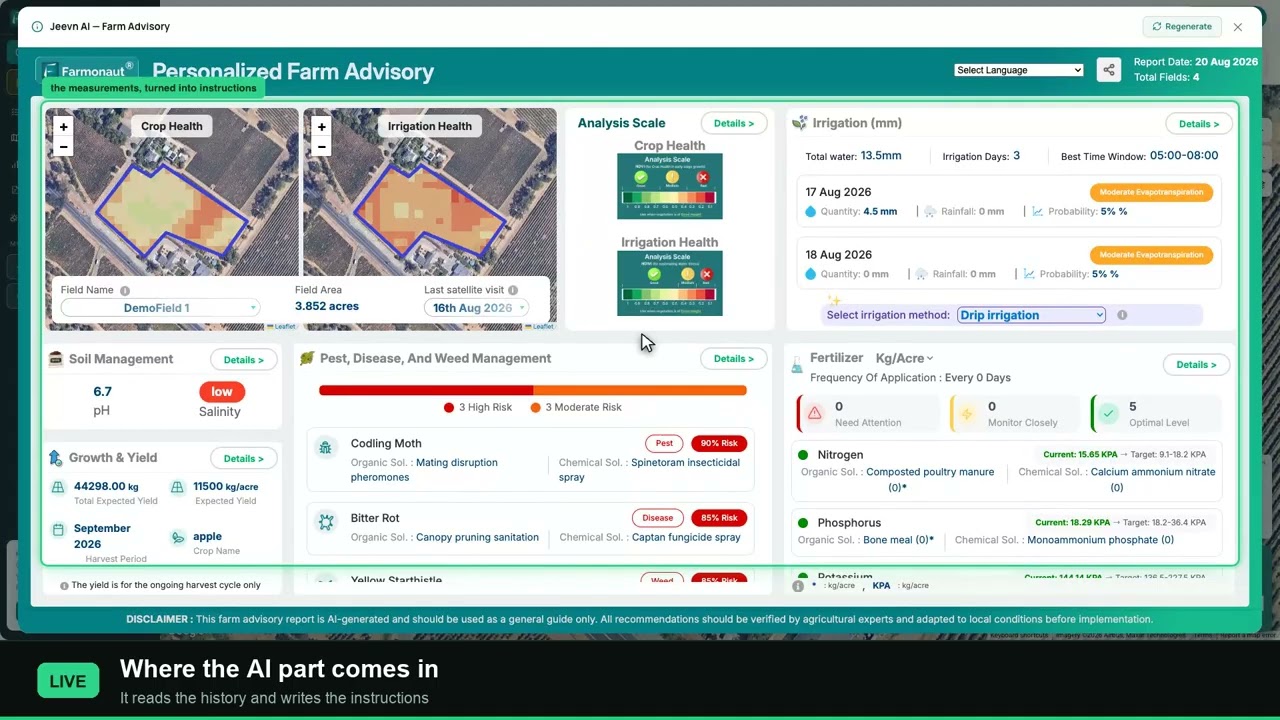
Each plot receives its own report per satellite pass: a day-by-day irrigation schedule with a recommended delivery method, per-nutrient fertiliser rates with organic and chemical sources, pest and disease risk with control options, weed pressure, soil chemistry, and a yield estimate. On a 39-plot account that is 39 separate answers per pass, not one farm-level summary.
Fertiliser: twenty-eight plots needed nothing
This is where the portfolio’s value concentrates. Summed across all 39 plots the advisory prescribed roughly 560 kg of nitrogen, phosphorus and potassium combined. Applying the average of the fed-plot rates uniformly across all 42.3 acres — a reasonable default without per-plot data — would have meant about 1,950 kg. The prescribed programme is 71.3% lower.
The eleven fed plots are the more interesting half, because they show that stage alone does not determine the answer. Eight of them are at veraison — the same crop, the same stage, the same week — and yet no two received the same prescription. Nitrogen ranged from 1.8 to 18.2 kg/acre, a 10.1-fold spread; phosphorus from 1.2 to 22.8, a 19-fold spread. Two plots were given no nitrogen at all while still receiving phosphorus and potassium, because their own soil reading already had nitrogen in range.
For a grower group, the useful output is not a recommendation — it is a shortlist. Twenty-eight plots needing nothing means twenty-eight members who do not need a visit or a purchase this week, and eleven who do. That is the difference between advising a portfolio and guessing at it.
Irrigation: drip on twenty-six plots, and 42% skip days
Across the portfolio the advisory covered 266 plot-days of irrigation guidance, of which 112 carried a zero — 42.1% of the scheduled period. Against a baseline of irrigating every plot every day at its own peak recommended rate, following the schedule applies 32.5% less water.
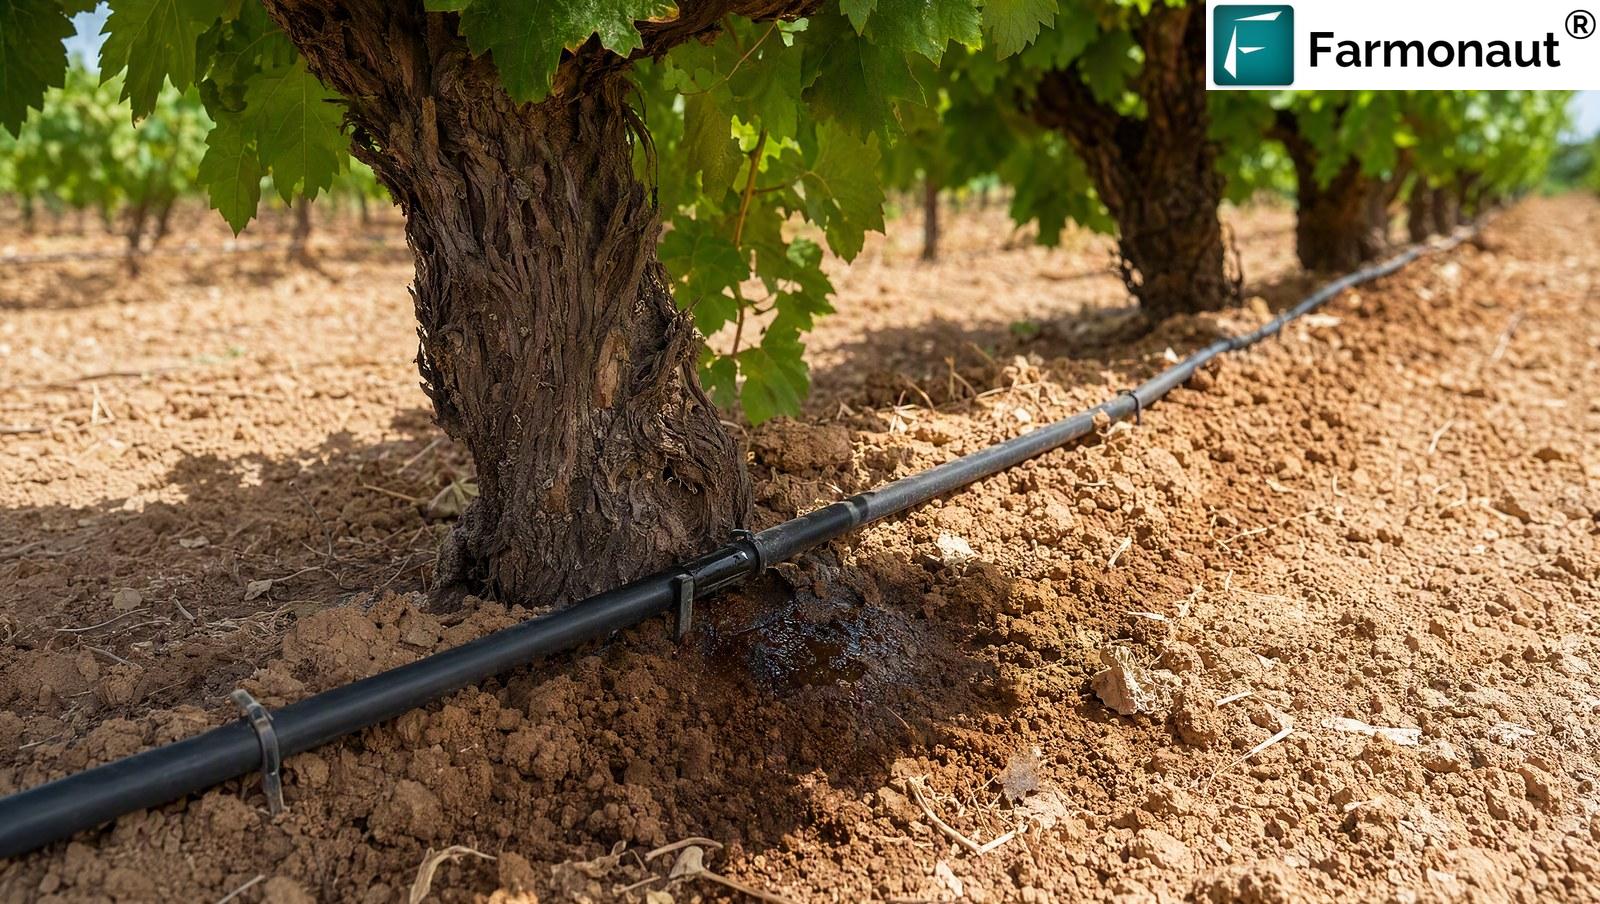
The delivery method was resolved per plot rather than assumed: drip irrigation on 26 plots, flood on 3, matching what each member actually has installed. Indian table grape is overwhelmingly drip-irrigated, and the advisory works with that rather than against it — the schedule is expressed in millimetres at the emitter, which is what a drip operator can actually set.
Pest and disease: mealybug and downy mildew, plot by plot
Across the 39 plots the advisory raised 54 alerts at 80% probability or above, and the pattern is unmistakably Indian table grape: mealybugs on 18 plots and downy mildew on 18, with anthracnose behind them on six. Those two are the defining problems of Maharashtra and north Karnataka viticulture — downy mildew because the monsoon arrives exactly when the canopy is dense, mealybug because it shelters under bark and moves between blocks.
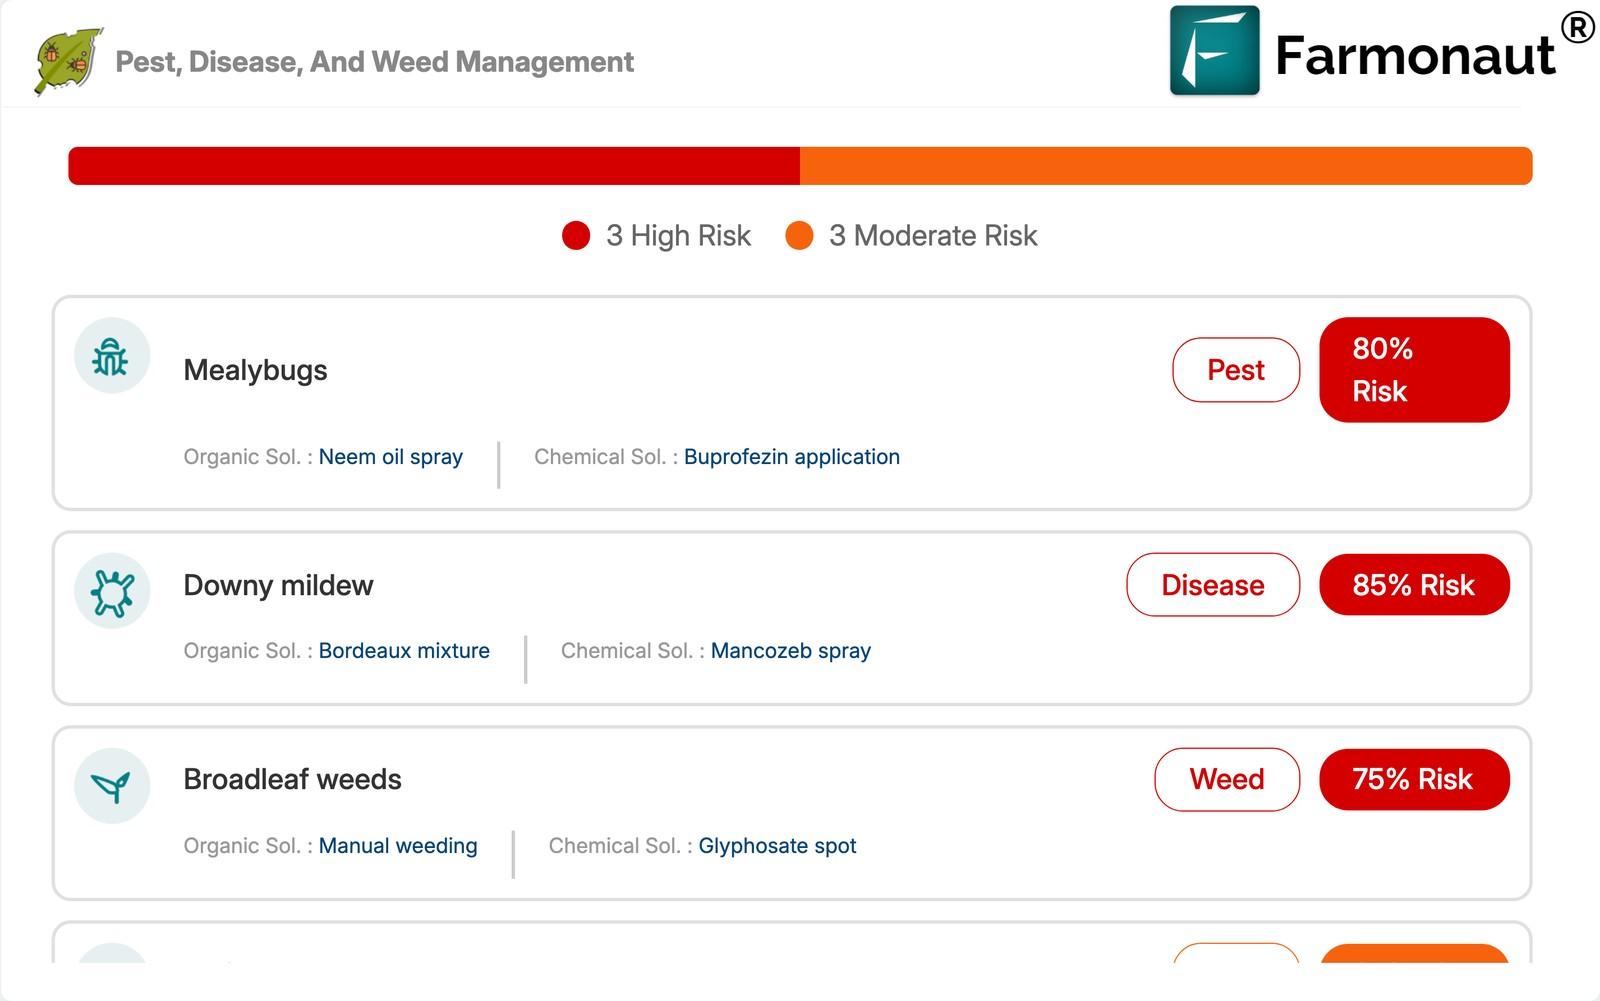
The specificity extends past grape. The two sugarcane plots on the same account were flagged for red rot and internode borer; the ber plot for fruit fly (Carpomyia vesuviana), which is the ber-specific fruit fly rather than a generic one. Where powdery mildew appeared on grape it was named Oidium, and downy mildew was identified as Plasmopara viticola. Four crops on one account, each getting its own organisms.
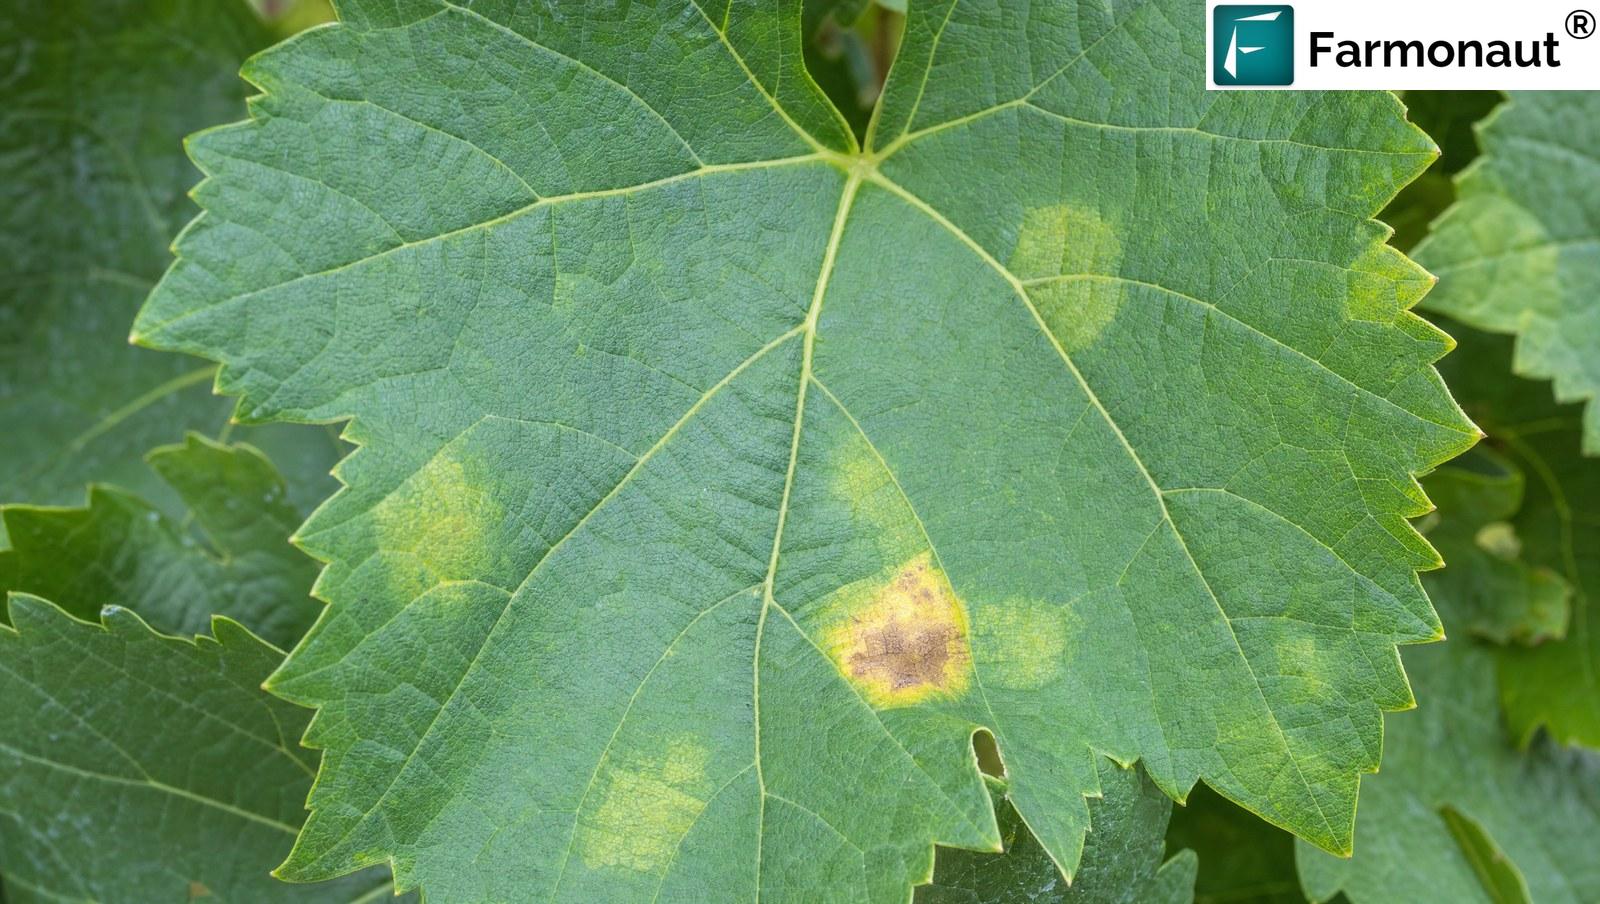
Every alert carried both an organic and a chemical option. On a member-farmer portfolio that matters commercially as well as agronomically: an export-oriented table-grape block has residue limits to respect, and a copper-based organic option is often the only choice available late in the season.
What the numbers add up to
Each figure below is computed from the advisory data itself.
| Mechanism in the advisory | What it delivers on this portfolio |
|---|---|
| Nutrient prescribed only where the vine is still filling — 28 of 39 plots given nothing | 71.3% less N, P and K than a uniform programme at the fed-plot average |
| Per-plot rates even within the same crop and stage — nitrogen spanning 10.1×, phosphorus 19× | Two plots correctly given zero nitrogen while still receiving P and K |
| 112 of 266 plot-days set to zero irrigation | 32.5% less water than irrigating every plot daily at its own peak rate |
| Delivery method resolved per plot — drip on 26, flood on 3 | Schedules expressed in terms each member can actually set |
| 54 alerts at ≥80%, crop-correct across grape, sugarcane and ber | A weekly shortlist of which members to call, and about what |
The nutrient figure is the one to take seriously here, because it is the largest and the best evidenced. 71.3% of a blanket programme avoided comes from a single input — knowing which plots are still filling fruit and which have been picked. On a 39-plot group that is a purchasing decision, not just an agronomic one.

Grower-reported outcomes, as submitted
This account submitted feedback twice, seven weeks apart, and positively on both occasions. The cards below reproduce both sets of answers exactly as recorded.
The reported fertiliser figure and our own calculation land in the same place. The group estimated its fertiliser use was optimised by above 70% in May and 50–70% in July; working independently from the advisory data, we compute 71.3% less nutrient than a blanket programme. Two different methods, the same answer — which is a stronger result than either on its own.
There is a commercial dimension to that precision worth naming. Indian table grape is heavily export-oriented, and a member selling into a market with maximum residue limits has to be able to show what went onto the block and when. A per-plot record of what was recommended — and, on twenty-eight plots that week, what was explicitly not recommended — is the beginning of that paper trail. A group-level average cannot produce it, because it never existed at plot level in the first place.
Building soil under vines
One reading is consistent across the whole portfolio and shapes the nutrient approach: soil organic carbon sits between 0.10% and 0.16%, averaging 0.12%. Organic matter is what holds water and nutrients in the root zone, so on a drip-irrigated vineyard — where wetting is deliberately confined to a small volume around each vine — the carbon fraction in that volume matters more than the farm-wide figure would suggest.
Soil pH reads 6.5 to 7.5 across 38 plots, mildly acidic to mildly alkaline, which is comfortable for grape and is why the prescriptions concentrate on nutrient quantity rather than availability correction. Salinity reads low on 36 of the 39 plots. Tracking these per plot rather than per farm is what lets a group tell one member their block is fine and another that theirs is drifting.
Both savings here reduce what enters the soil and the groundwater, not just what leaves the bank account. Nutrient not applied to a picked vineyard cannot leach, and on drip-irrigated sandy-loam plots with 0.12% organic carbon, leaching is the default fate of anything the vine is not actively taking up.
Why per-plot beats per-farm for a grower group
The case for plot-level resolution is strongest exactly where this account sits. A single grower with one vineyard can walk it and know its stage. A group holding 39 blocks across 300 kilometres cannot, and the cost of being wrong is asymmetric: a missed downy mildew window on one member’s block can take that block’s crop, while an unnecessary nutrient application on another wastes money quietly for a season.
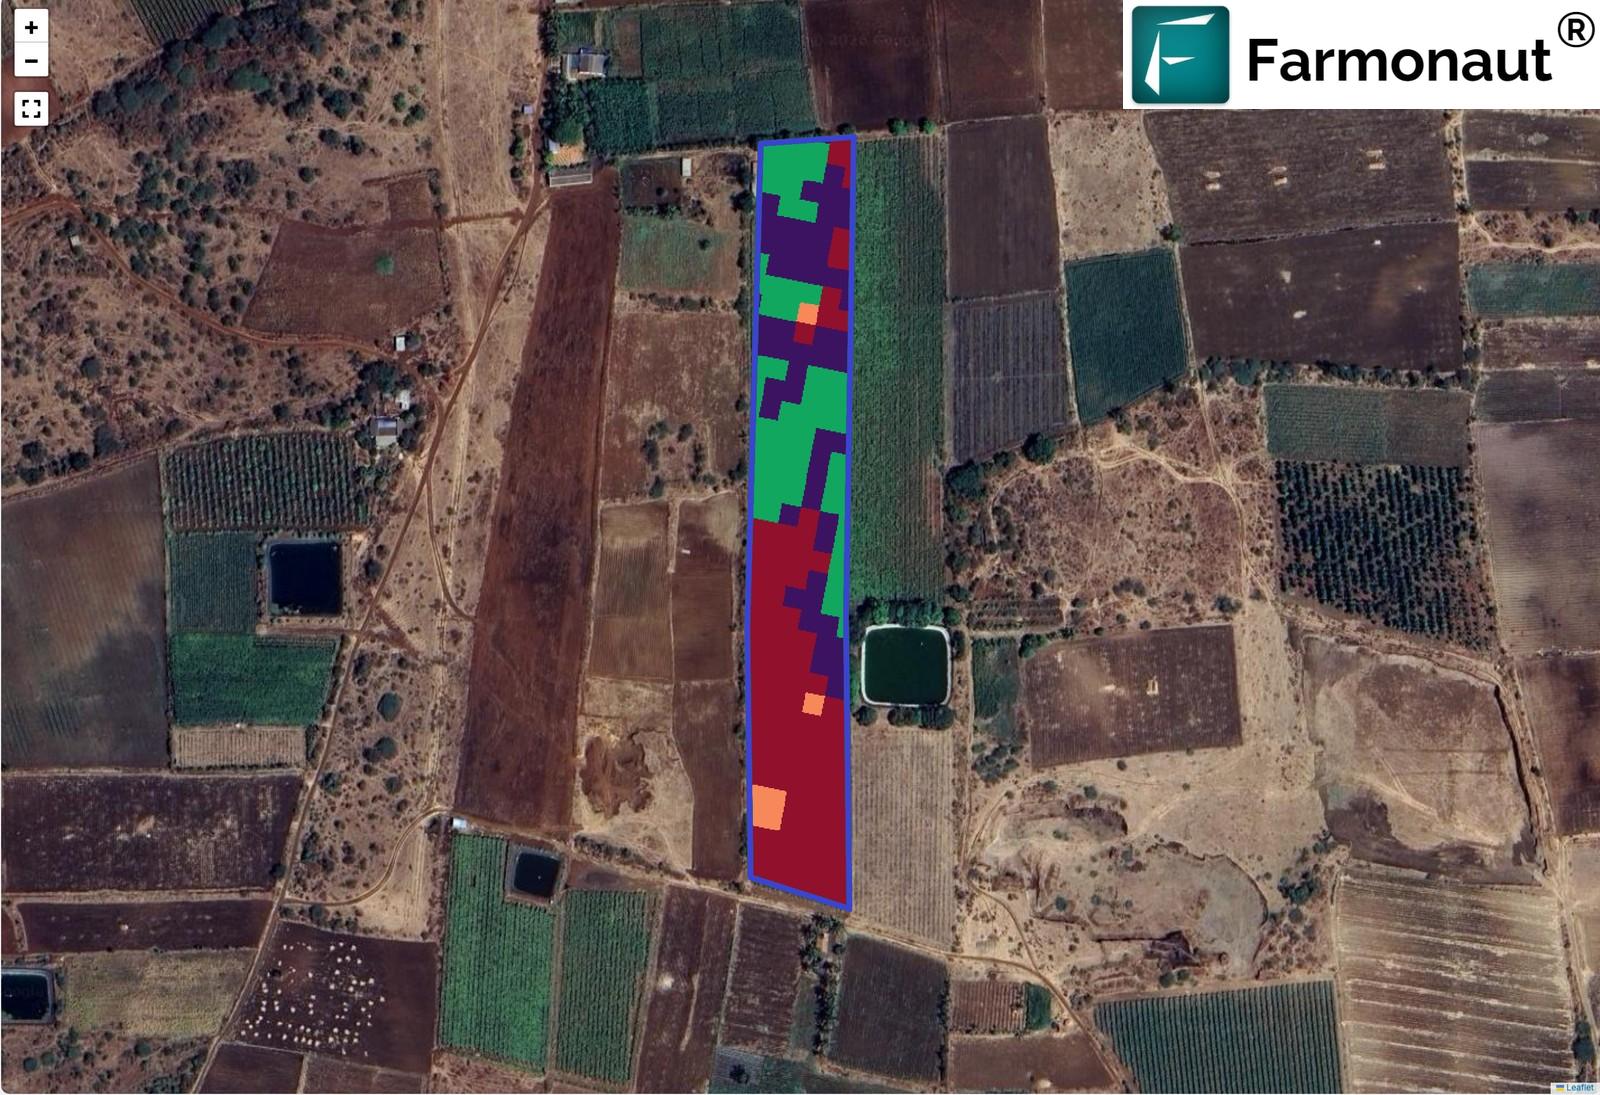
Underneath every section sits a per-pixel read of each plot from satellite, resolved through crop coefficients and regional pest models into instructions for that block at that stage. With 791 advisories over 40 acquisition dates, the group is not receiving a monthly report — it is receiving a rolling shortlist that updates as each pass lands.
Running this on your own plots
- Map every member block separately. Thirty-nine boundaries produce thirty-nine answers; one boundary around the group produces none of them.
- Keep each plot’s stage current. The entire fertiliser result here follows from knowing which vineyards were picked and which were still at veraison.
- Read the zero plots first. On this portfolio 28 of 39 needed nothing — that list is where the saving is, and it is the fastest thing to act on.
- Compare mixes, not totals. Eight plots at the same stage received eight different prescriptions; a group-level average would have hidden all of it.
- Use the organic column for late-season blocks. Bordeaux mixture and neem oil are named because they are available and appropriate where residue limits apply.
Explore the platform at sat.farmonaut.com, read more about our satellite and AI-based farm advisory in the JEEVN AI overview, or talk to our team about onboarding a grower group or FPO. JEEVN AI is a paid product; plan detail is on the platform.
Thirty-nine plots, one shortlist a week
Map each member block, set its crop and stage, and get per-plot irrigation, nutrient and pest guidance from satellite passes over their own ground.
Frequently asked questions
What is a satellite grape farming advisory and what does it deliver per plot?
It is a per-plot report generated from a satellite pass over that block’s own boundary, covering a day-by-day irrigation schedule with a recommended delivery method, per-nutrient fertiliser rates for N, P, K, S and Zn with organic and chemical sources, pest and disease risk, weed pressure, soil pH, organic carbon and salinity, and a yield estimate. On this account 39 plots each received their own, producing 791 advisories over 40 acquisition dates.
Can a grower group or FPO monitor plots for many member farmers on one account?
Yes. This account holds 39 separately mapped plots across Pune Division in Maharashtra and Belgaum Division in Karnataka, roughly 300 kilometres apart, for individual member farmers. Each plot is advised independently from its own crop, stage and satellite pass, which is what allows the group to produce a weekly shortlist of which members need attention.
How can a fertiliser advisory cut input use by 71%?
By prescribing nothing where nothing is needed. In the week analysed, 28 of the 39 plots required no fertiliser at all — 22 of them because they were at harvest or post-harvest. Summed across the portfolio the advisory prescribed about 560 kg of N, P and K, against roughly 1,950 kg for a uniform programme at the fed-plot average rate. The saving is in the plots that were skipped, not in smaller doses on the plots that were fed.
Why did plots at the same stage get different nutrient rates?
Because each plot’s soil reading is its own. Eight of the eleven fed plots were at veraison, and no two received the same prescription: nitrogen spanned 10.1× and phosphorus 19× across them, and two plots were given no nitrogen at all because theirs was already in range. Stage decides whether a plot is fed; the soil reading decides what it is fed.
Does it handle downy mildew and mealybug specifically?
Those were the two dominant alerts on this portfolio — mealybugs on 18 plots and downy mildew on 18, each at 80% probability or above, with downy mildew identified as Plasmopara viticola. Both arrive with an organic and a chemical option; the organic column offers Bordeaux mixture for the mildew and neem oil for the mealybug, which matters on blocks with residue limits.
Are the pest probabilities confirmed infestations?
No — they are modelled risk scores built from satellite indices, weather and regional pest pressure, and they work as a scouting priority list. Their value on a 39-plot group is specificity: the sugarcane plots were flagged for red rot and internode borer while the ber plot was flagged for Carpomyia vesuviana, the ber-specific fruit fly, and the grape plots for mildew and mealybug.
Does it work with drip irrigation?
Yes, and it resolves the method per plot rather than assuming one. On this account drip was the recommended method on 26 plots and flood on 3, matching what each member has installed. The schedule is expressed in millimetres at the emitter, which is the unit a drip operator can actually set.
Glossary
- Veraison
- The stage at which grape berries stop growing by cell division and begin to soften, colour and accumulate sugar. Peak nutrient sensitivity — and the stage eight of the eleven fed plots were at.
- Downy mildew (Plasmopara viticola)
- The principal fungal disease of grape in monsoon-influenced India, producing angular oil-spot lesions on the leaf. Managed preventively, which is why an early probability flag has value.
- Mealybug
- A sap-feeding insect that shelters under vine bark and spreads between blocks, producing honeydew and sooty mould on bunches. The most common table-grape pest on this portfolio.
- Ber (jujube)
- Ziziphus mauritiana, an Indian fruit crop grown on marginal land. Flagged here for Carpomyia vesuviana, the ber fruit fly, rather than a generic fruit fly.
- Soil organic carbon (SOC)
- A proxy for soil organic matter, governing water-holding capacity and nutrient buffering. Measured at 0.10–0.16% across these plots, which is what drives the emphasis on organic amendment.
Case-study basis: JEEVN AI plot advisories for a single Farmonaut account, taking each plot’s most recent advisory as of the client’s second feedback submission (portfolio state at 16–17 July 2026, 39 plots), plus both of the account’s in-app feedback submissions (26 May 2026 and, for the advisory dated 17 July 2026, submitted 18 July 2026). Crops, states, plot count and area are reported from the account’s own records on the platform. This is a grower group holding plots on behalf of individual member farmers: the account holder is not named, and the member farmers whose names appear on individual plot records within the platform are third parties and are not identified here, nor is any statement attributed to them. Precise plot locations are withheld. The reported percentages are the account’s own estimates from a structured feedback form, not metered or invoiced measurements; the 71.3% nutrient figure and the 32.5% water figure are our own calculations from the advisory data against stated baselines. Pest, disease and weed percentages are modelled probabilities, not confirmed infestations. Yield figures are estimates, not guarantees. Imagery: the platform screenshot and the crop-health zone map are genuine captures of this account’s own advisory and satellite data; the five wider field photographs are AI-generated illustrative imagery, each labelled as such in its caption, and do not depict the group, its members or their plots. JEEVN AI is a paid product.
Discussion
Questions, corrections or field experience? Share them below. First-time comments are reviewed before they appear, and your email is never published.
No comments yet. Be the first to add a question or your experience.

 Hydenmet
 Dirks Bros Farms
 Red August Group
 Farm Inc
 WeMe Global
 Agrotoken
 Blue BearX
 Insignito
 Croptimum
 DnCubed
 Field Capacity
 Indosistim Teknologi
 Liquify Digital
 CU Foods
 BeyondTech Global
 Rouge VC
 AgroGreen Dynamics
 Licence holder · Niger · Gold










